
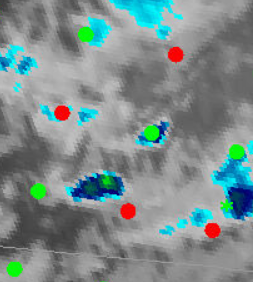
1-minute Mesoscale Domain Sector GOES-16 (GOES-East) “Red” Visible (0.64 µm) and “Clean” Infrared Window (10.35 µm) images — with and without an overlay of GLM Flash Extent Density (above) — showed the development of a large Mesoscale Convective System (MCS) that developed over North Dakota and began moving eastward into Minnesota on 17 July 2020 (surface analyses). These thunderstorms produced... Read More
![GOES-16 “Red” Visible (0.64 µm) and “Clean” Infrared Window (10.35 µm) images, with and without an overlay of GLM Flash Extent Density [click to play animation | MP4]](https://cimss.ssec.wisc.edu/satellite-blog/images/2020/07/nd_glm-20200717_234600.png)
GOES-16 “Red” Visible (0.64 µm) and “Clean” Infrared Window (10.35 µm) images (with and without an overlay of GLM Flash Extent Density) [click to play animation | MP4]
1-minute
Mesoscale Domain Sector GOES-16
(GOES-East) “Red” Visible (
0.64 µm) and “Clean” Infrared Window (
10.35 µm) images — with and without an overlay of
GLM Flash Extent Density (above) — showed the development of a large Mesoscale Convective System (MCS) that developed over North Dakota and began moving eastward into Minnesota on
17 July 2020 (
surface analyses). These thunderstorms produced a variety of severe weather, and heavy rainfall with up to
6 inches in North Dakota and
4 inches in Minnesota.
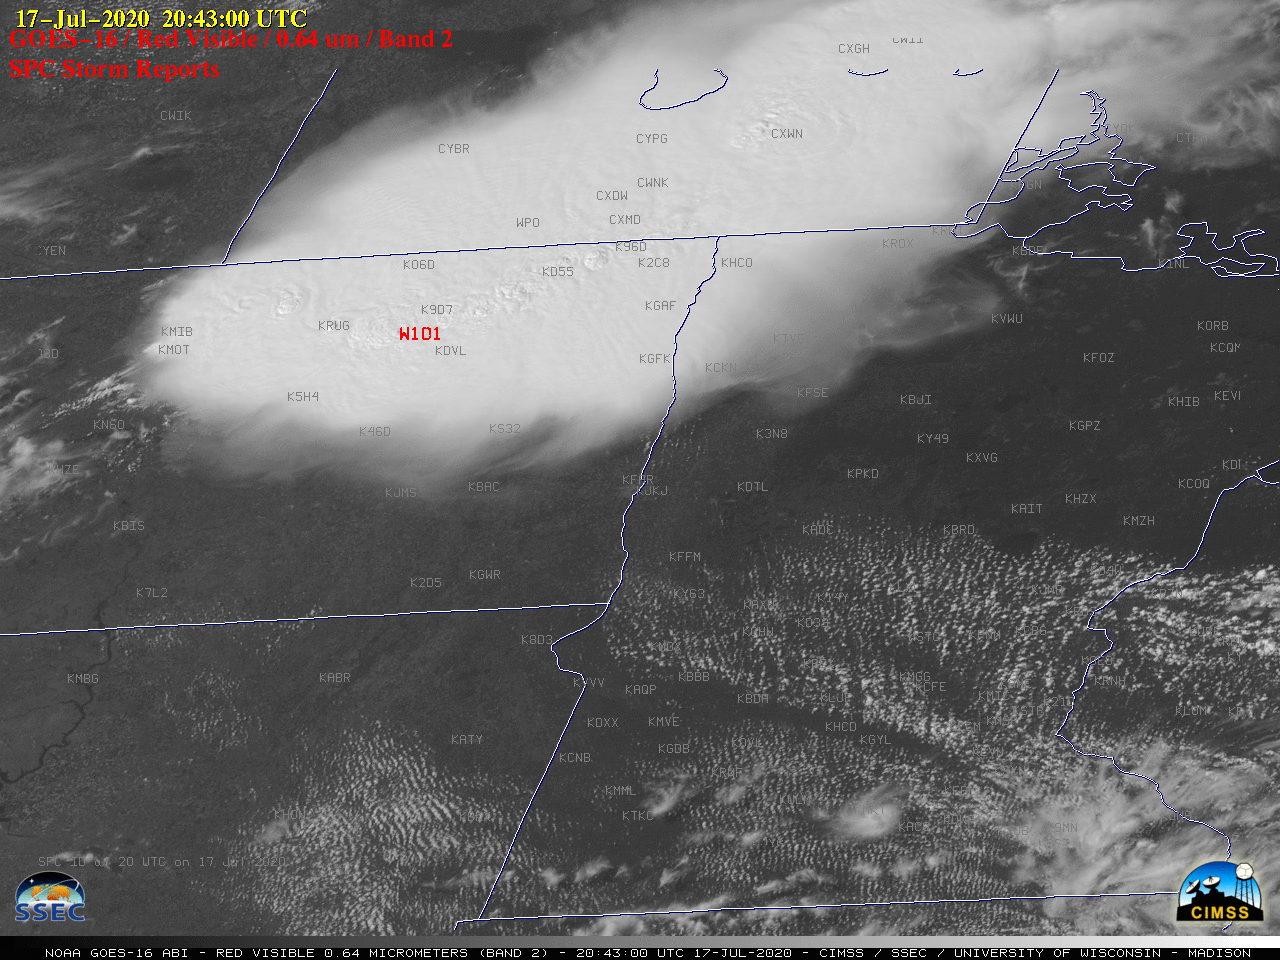
![GOES-16 “Red” Visible (0.64 µm) images, with SPC Storm Reports plotted in red [click to play animation | MP4]](https://cimss.ssec.wisc.edu/satellite-blog/images/2020/07/G16_VIS_ND_SPC_17JUL2020_B2_2020199_224800_GOES-16_0001PANEL_FRAME00269.GIF)
GOES-16 “Red” Visible (0.64 µm) images, with time-matched SPC Storm Reports plotted in red [click to play animation | MP4]
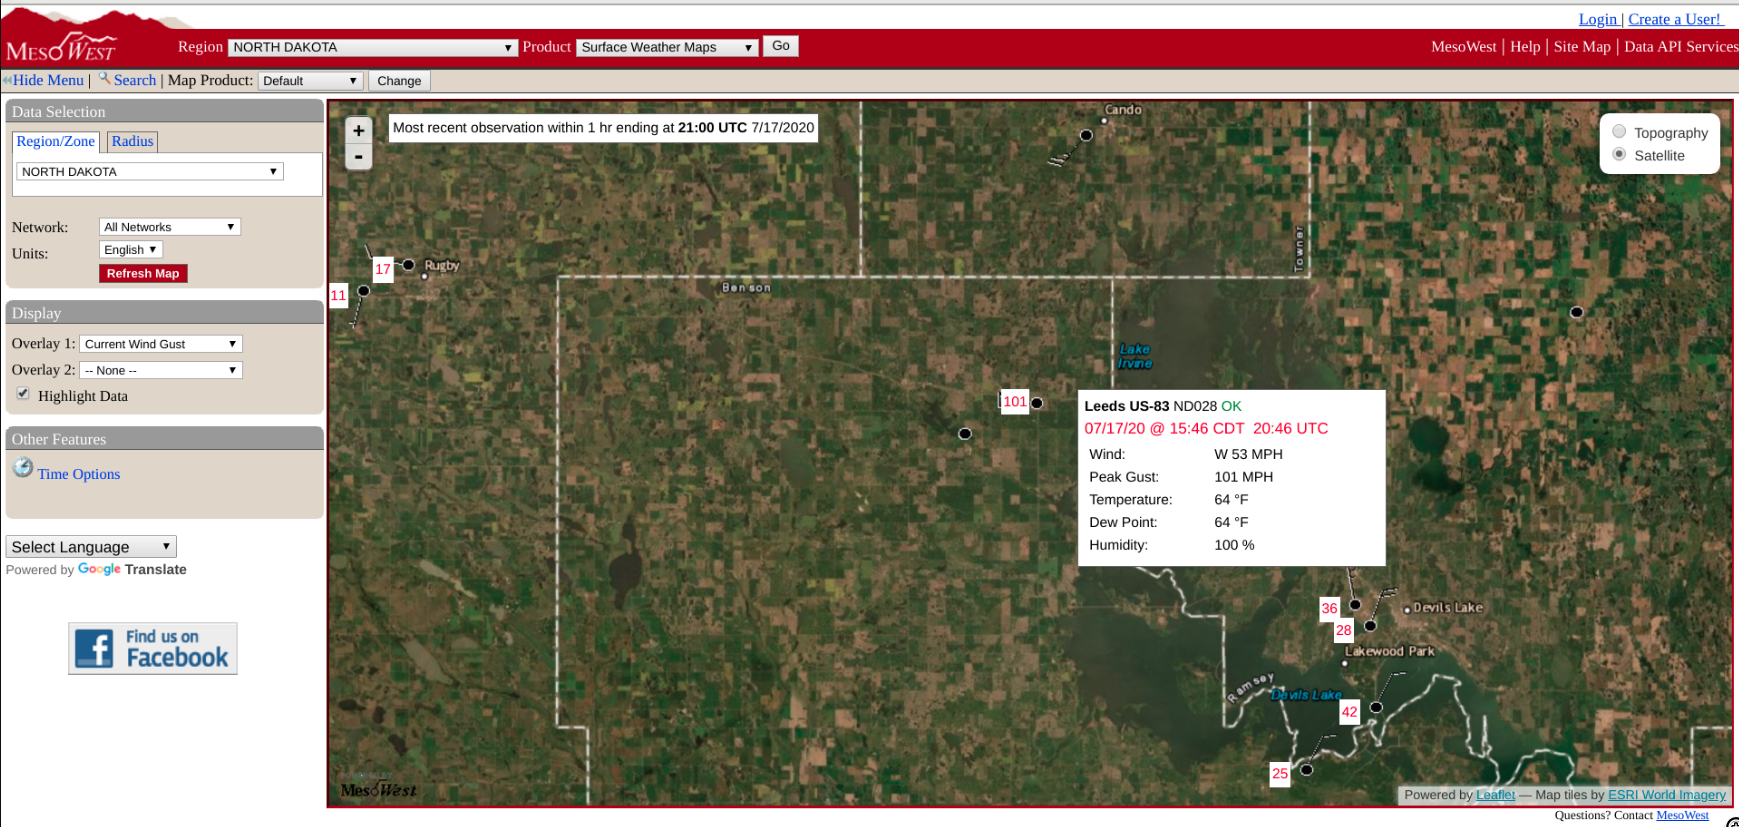
1-minute GOES-16 Visible images
(above) and Infrared images
(below) include time-matched plots of
SPC Storm Reports — of particular note was the wind gust of
101 mph (
GOES-16 Visible / Infrared images) that occurred at a
RAWS site in northeastern North Dakota around 2045 UTC, in the vicinity of a brief tornado. As the MCS continued to expand southward and eastward during the subsequent nighttime hours, it eventually produced damaging winds across northeastern South Dakota, much of Minnesota and northwestern Wisconsin.
![GOES-16 “Clean” Infrared Window (10.35 µm) images, with time-matched SPC Storm Reports plotted in cyan [click to play animation | MP4]](https://cimss.ssec.wisc.edu/satellite-blog/images/2020/07/G16_IR_ND_17JUL2020_B13_2020199_224800_GOES-16_0001PANEL_FRAME00269.GIF)
GOES-16 “Clean” Infrared Window (10.35 µm) images, with time-matched SPC Storm Reports plotted in cyan [click to play animation | MP4]
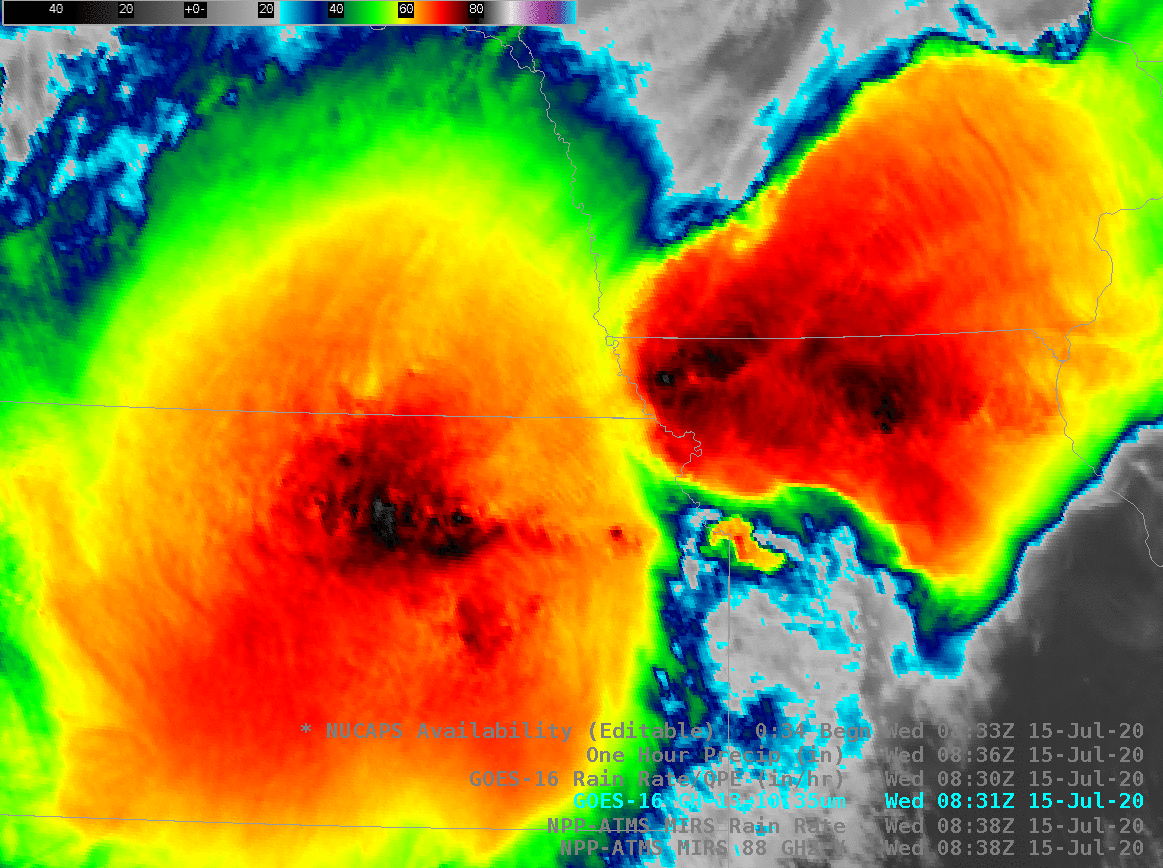
Animations of CIMSS Clear Sky Convective Available Potential Energy (CAPE), Lifted Index (LI) and Total Precipitable Water (TPW) products
(below), from
this site, showed the rapid destabilization and moisture increase of the air mass south and southeast of the developing MCS; this corridor of moist and unstable air was feeding northward, helping to sustain MCS growth and propagation.
![CIMSS Clear Sky CAPE images [click to play animation]](https://cimss.ssec.wisc.edu/satellite-blog/images/2020/07/200717_1926z_cape.png)
CIMSS Clear Sky CAPE images [click to play animation]
![CIMSS Clear Sky LI images [click to play animation]](https://cimss.ssec.wisc.edu/satellite-blog/images/2020/07/200717_1926z_li.png)
CIMSS Clear Sky LI images [click to play animation]
![CIMSS Clear Sky TPW images [click to play animation]](https://cimss.ssec.wisc.edu/satellite-blog/images/2020/07/200717_1926z_tpw.png)
CIMSS Clear Sky TPW images [click to play animation]
These severe thunderstorms with tall cloud tops provided a good demonstration of the
parallax shift inherent in GOES imagery at higher latitudes. Time-matched comparisons of Infrared images from NOAA-20
at 1933 UTC and Suomi NPP
at 2023 UTC with the corresponding images from GOES-16
(below) showed that the GOES images were shifted northwest of the more accurate NOAA-20/Suomi NPP images. The superior 375-meter spatial resolution of the
VIIRS instrument allowed subtle cloud-top gravity waves to be seen — and the VIIRS cloud-top infrared brightness temperatures were about 10ºC colder than those sensed by the
ABI instrument. The 1933 UTC images were about 15 minutes prior to the tornado and 101-mph wind gust at Churches Ferry (located about 20 miles northwest of Devils Lake KDVL).
![Infrared Window images from NOAA-20 (11.45 µm) and GOES-16 (10.35 µm) at 1933 UTC [click to enlarge]](https://cimss.ssec.wisc.edu/satellite-blog/images/2020/07/200717_1933utc_noaa20_goes16_infrared_ND_anim.gif)
Infrared Window images from NOAA-20 (11.45 µm) and GOES-16 (10.35 µm) at 1933 UTC [click to enlarge]
![Infrared Window images from Suomi NPP (11.45 µm) and GOES-16 (10.35 µm) at 2023 UTC [click to enlarge]](https://cimss.ssec.wisc.edu/satellite-blog/images/2020/07/200717_2023utc_suomiNPP_goes16_infrared_ND_anim.gif)
Infrared Window images from Suomi NPP (11.45 µm) and GOES-16 (10.35 µm) at 2023 UTC [click to enlarge]
An image showing parallax correction vectors and distance for a 50,00 ft (15.2 km) cloud top feature at various points within the GOES-16 CONUS domain
(below) is from
this site — and indicated a southeastward correction of about 28-30 km (or 17-19 miles) over northern North Dakota. This is in good agreement with what was seen in the 2 VIIRS/ABI infrared image comparisons shown above.
![Parallax correction vectors (green) and distance (in km, red) for various points within the GOES-16 CONUS domain [click to enlarge]](https://cimss.ssec.wisc.edu/satellite-blog/images/2020/07/g16_plax.png)
Parallax correction vectors (green) and distance (in km, red) for a 50,00 ft (15.2 km) cloud top feature at various points within the GOES-16 CONUS domain [click to enlarge]
View only this post
Read Less
![GOES-16 “Red” Visible (0.64 µm) and “Clean” Infrared Window (10.35 µm) images, with and without an overlay of GLM Flash Extent Density [click to play animation | MP4]](https://cimss.ssec.wisc.edu/satellite-blog/images/2020/07/200717_goes16_visible_infrared_glmFlashExtentDensity_ND_MN_anim.gif)
![GOES-16 “Red” Visible (0.64 µm) images, with SPC Storm Reports plotted in red [click to play animation | MP4]](https://cimss.ssec.wisc.edu/satellite-blog/images/2020/07/200717_goes16_visible_spcStormReports_ND_MN_anim.gif)
![GOES-16 “Clean” Infrared Window (10.35 µm) images, with time-matched SPC Storm Reports plotted in cyan [click to play animation | MP4]](https://cimss.ssec.wisc.edu/satellite-blog/images/2020/07/200717_goes16_infrared_spcStormReports_ND_MN_anim.gif)
![CIMSS Clear Sky CAPE images [click to play animation]](https://cimss.ssec.wisc.edu/satellite-blog/images/2020/07/200717_cape_anim.gif)
![CIMSS Clear Sky LI images [click to play animation]](https://cimss.ssec.wisc.edu/satellite-blog/images/2020/07/200717_li_anim.gif)
![CIMSS Clear Sky TPW images [click to play animation]](https://cimss.ssec.wisc.edu/satellite-blog/images/2020/07/200717_tpw_anim.gif)
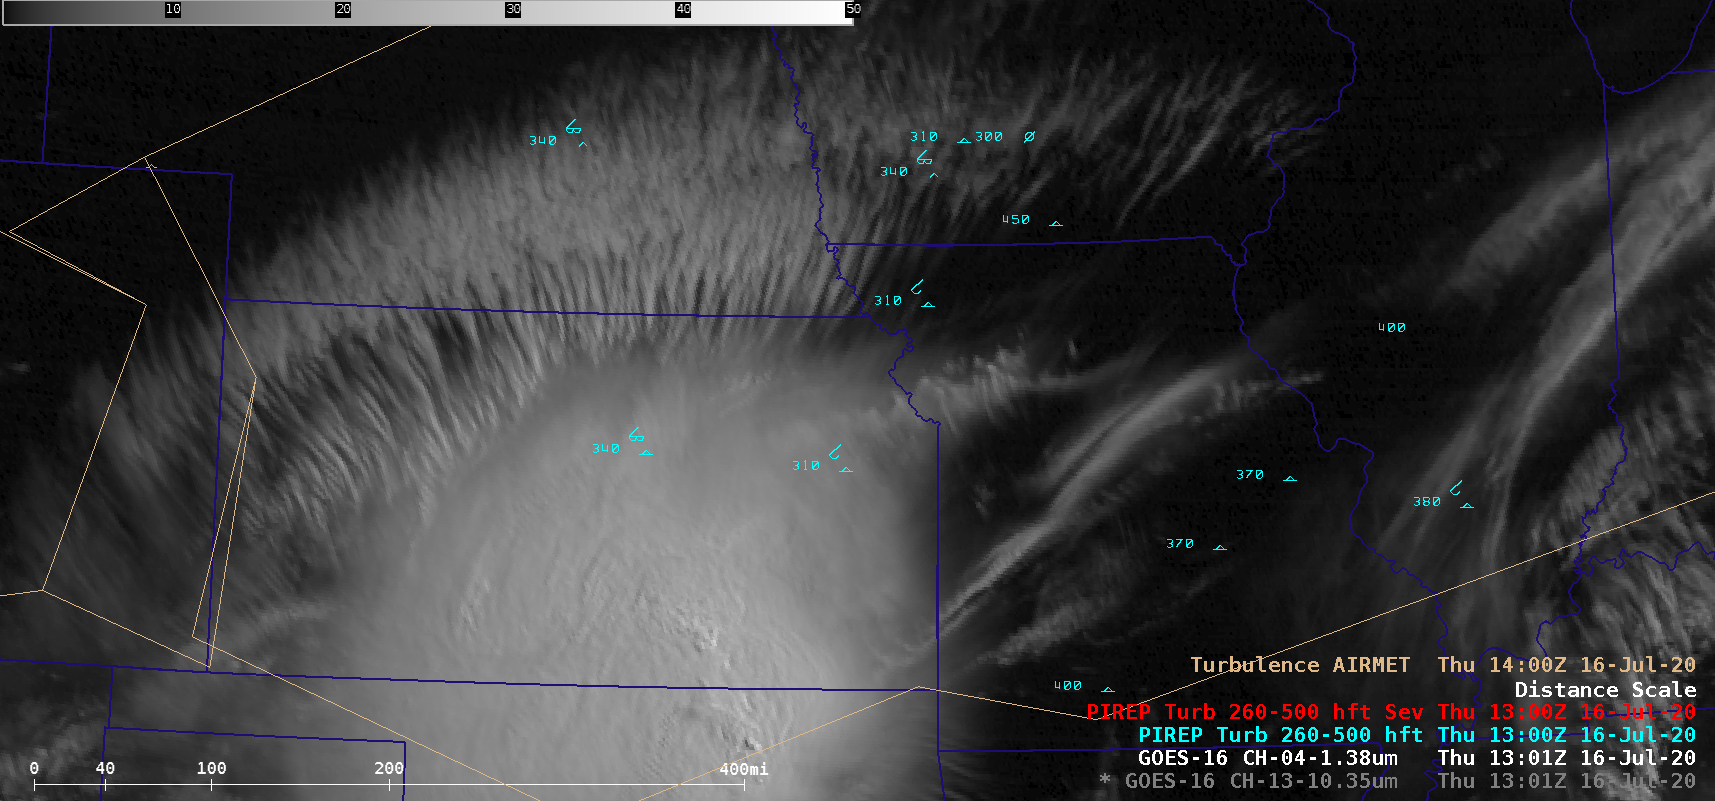
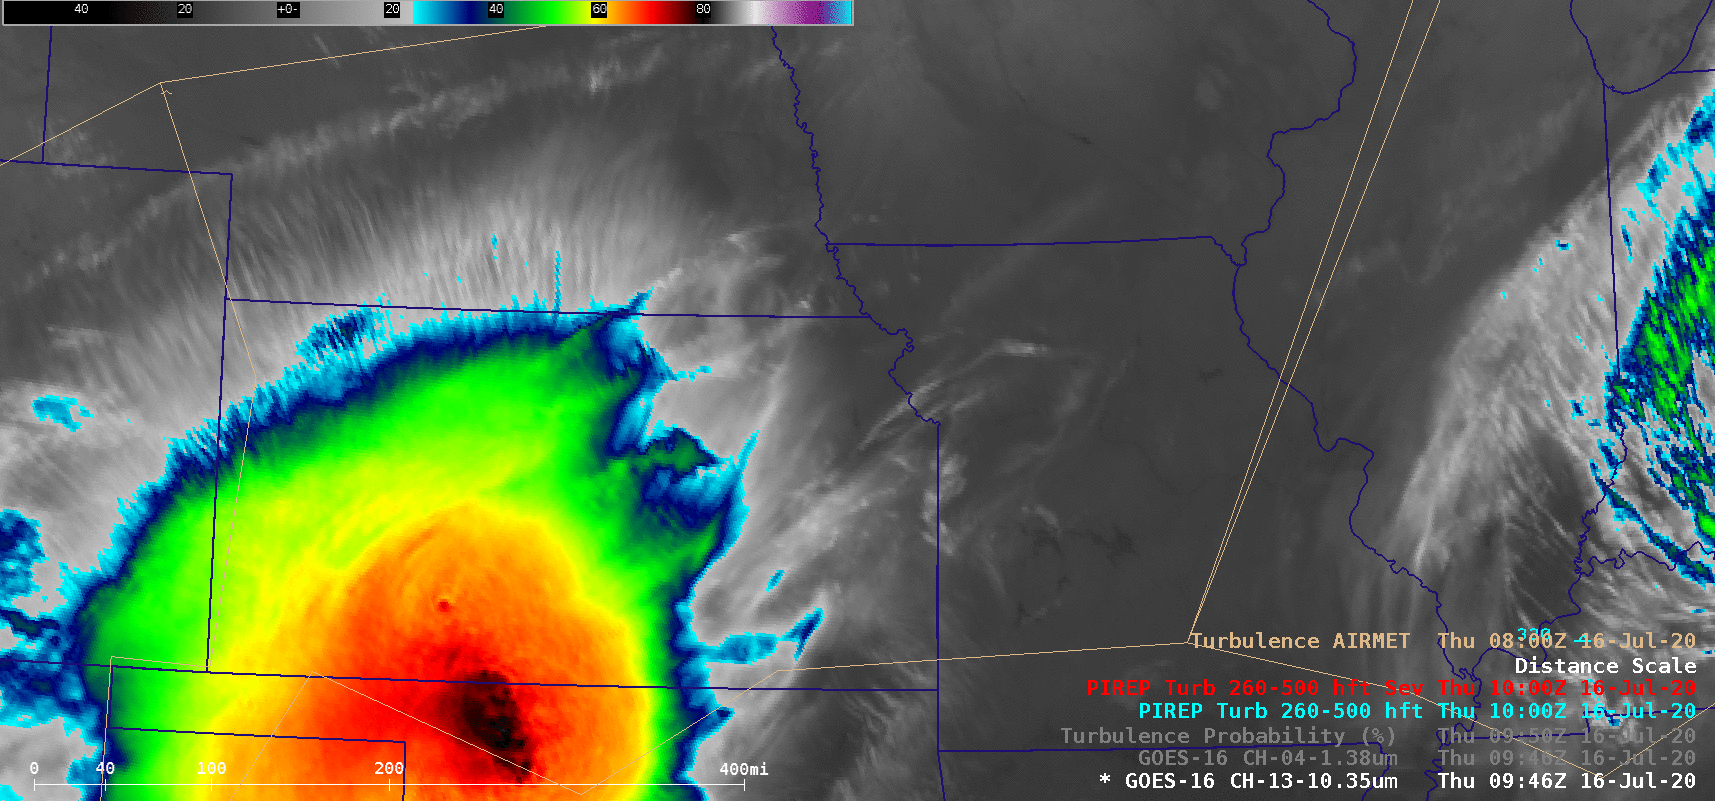
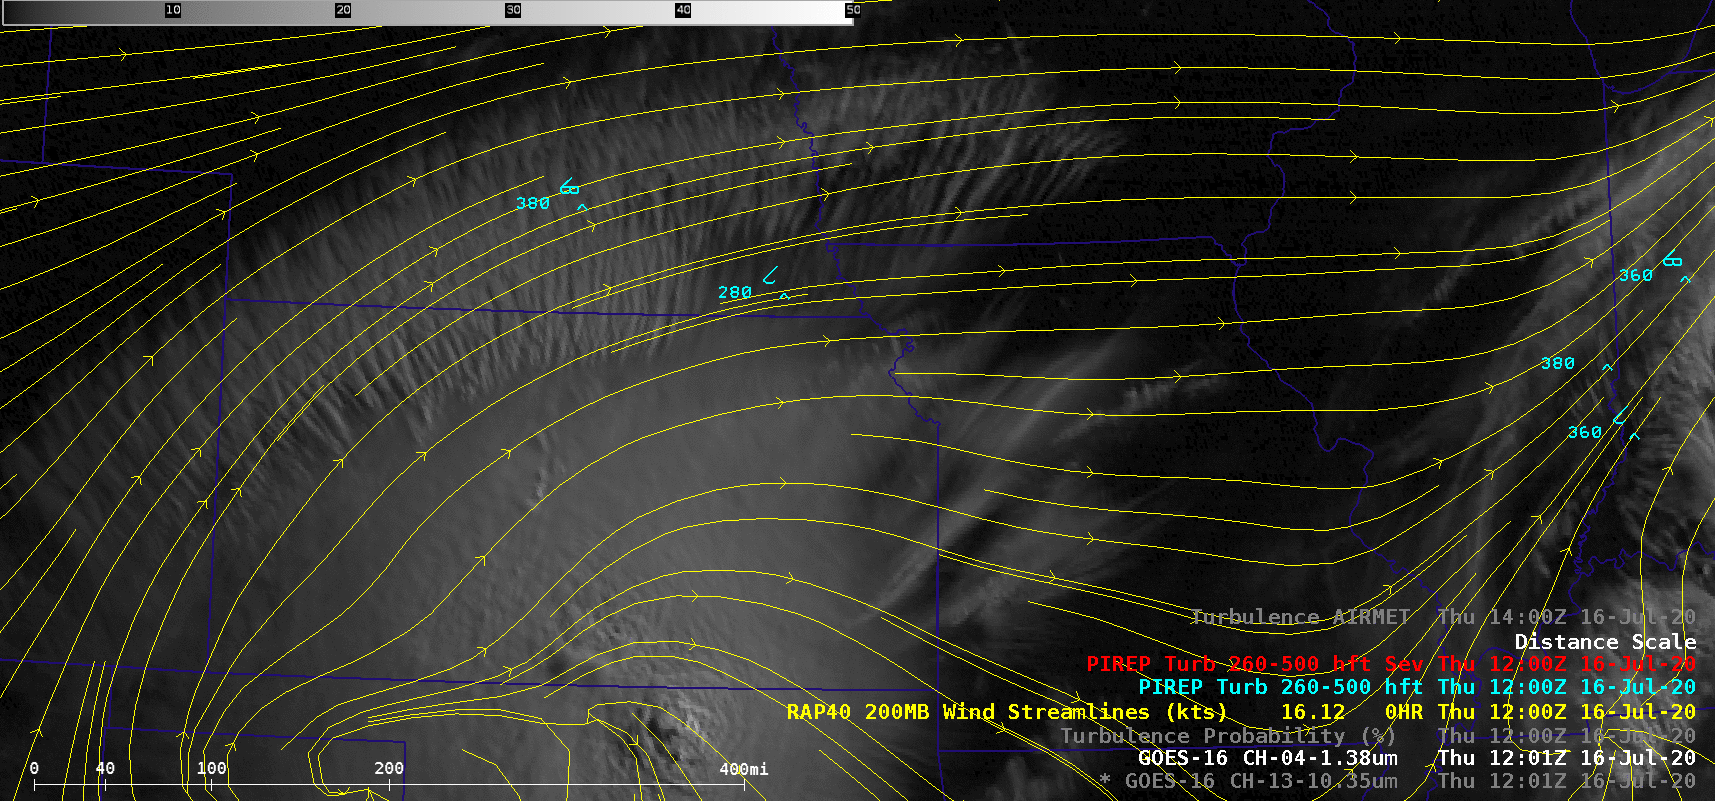
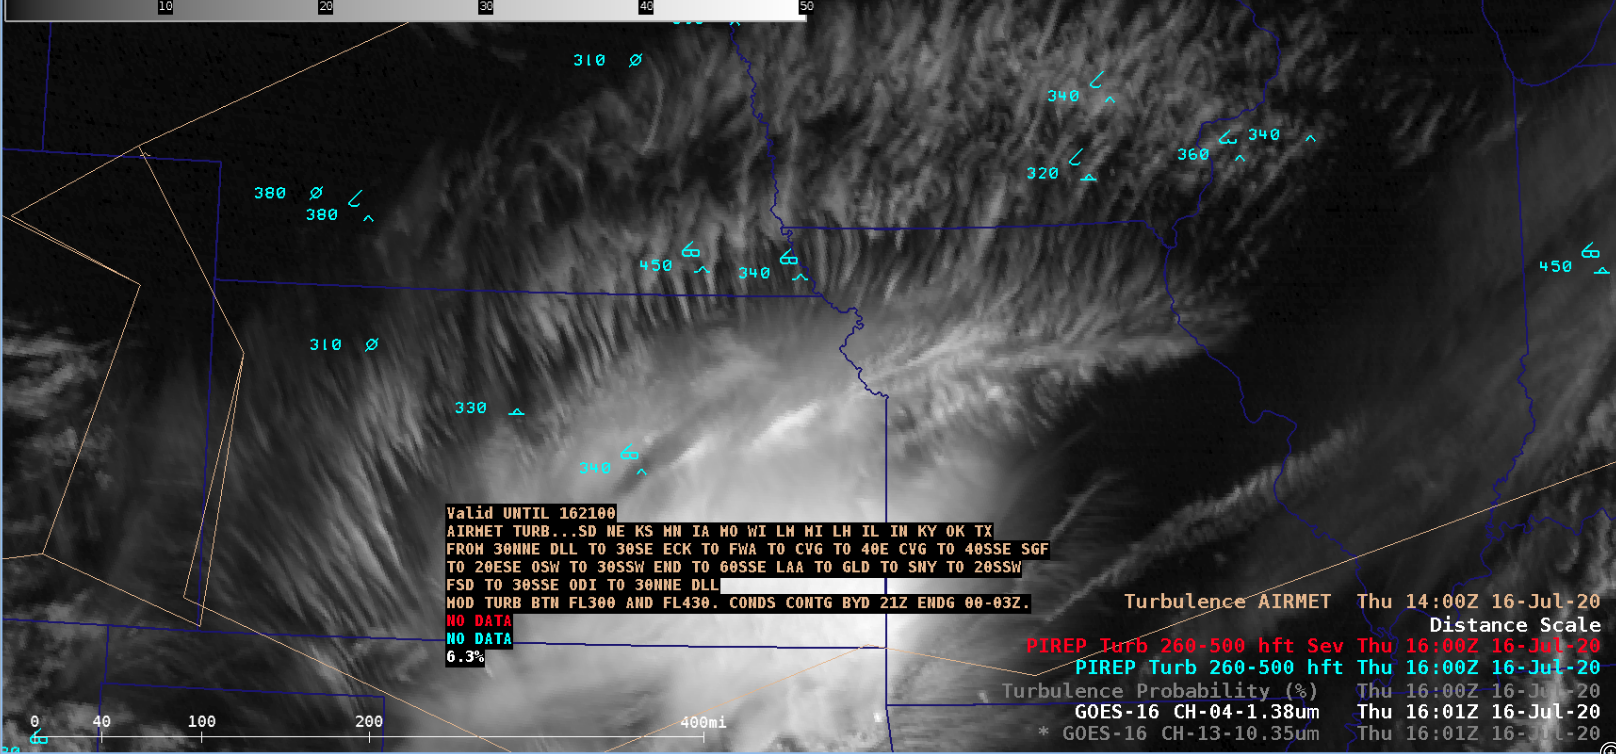
![GOES-16 Turbulence Probability product, with plots of PIREPs and AIRMETs [click to play animation | MP4]](https://cimss.ssec.wisc.edu/satellite-blog/images/2020/07/200716_goes16_turbulenceProbability_pireps_airmets_Midwest_transverse_banding_anim.gif)


/na2020_07_17_199.gif)
/na2020_07_17_199.gif)