Transverse banding: a signature of potential turbulence
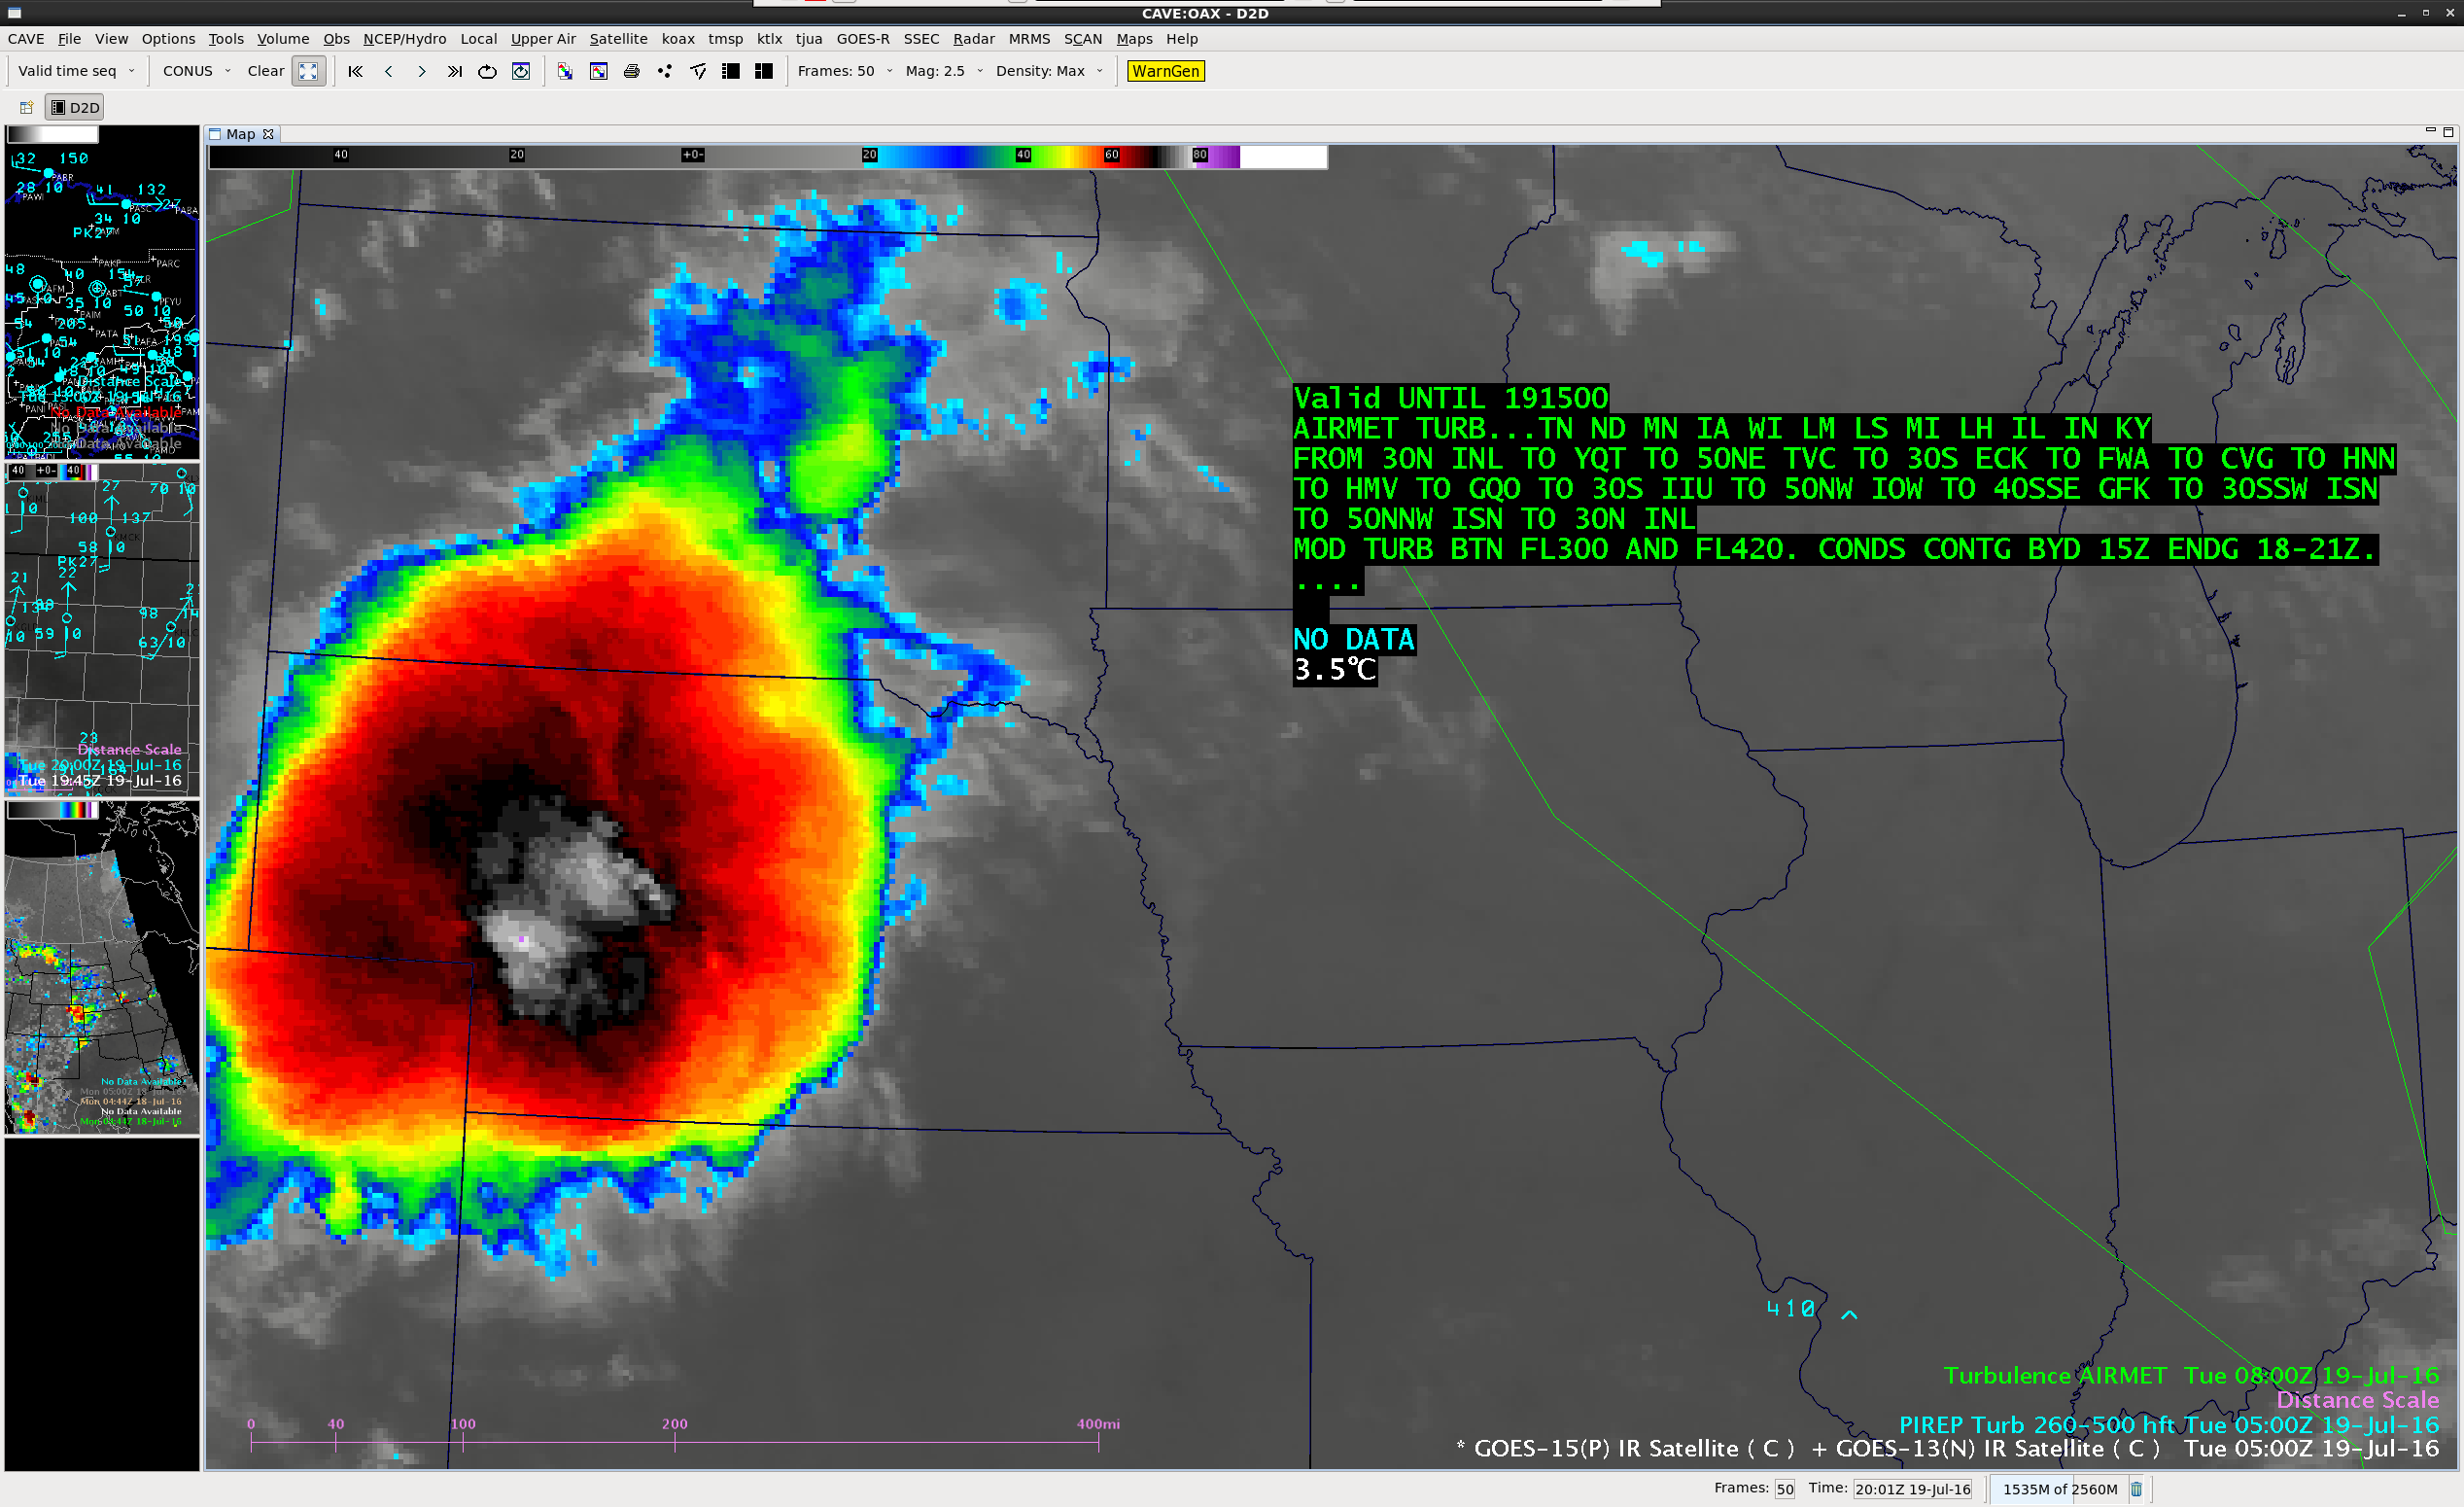
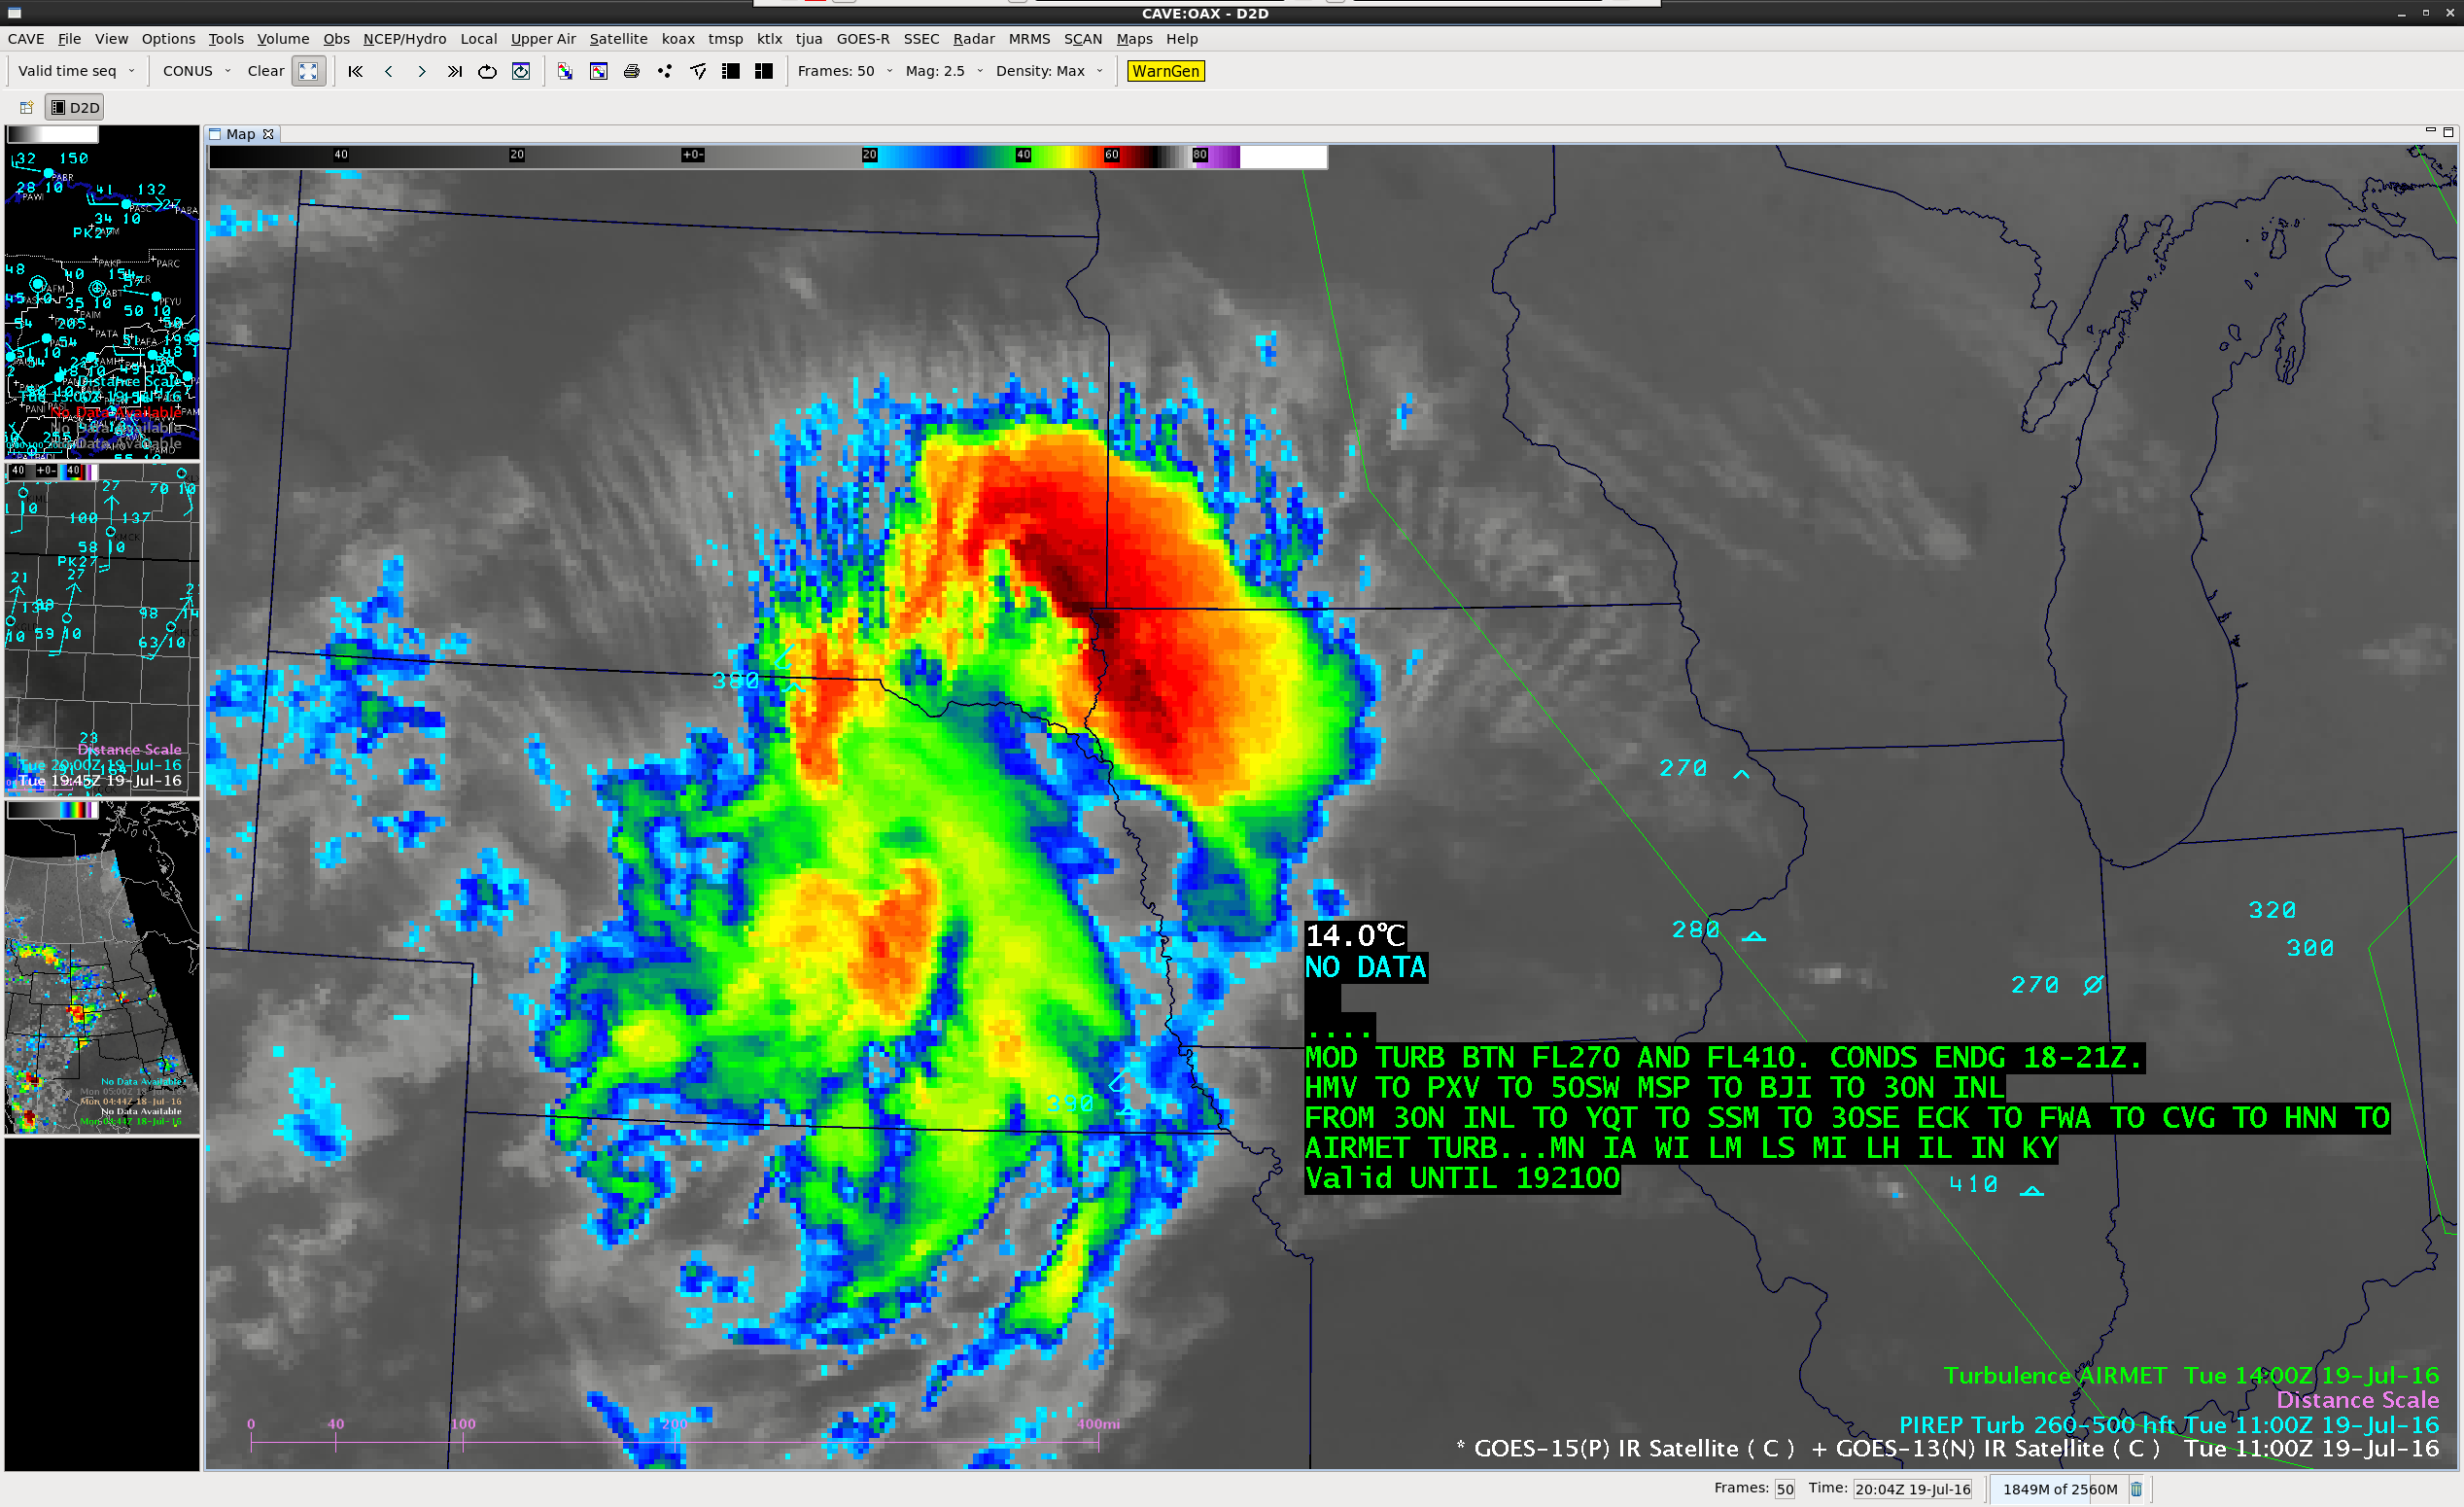
![GOES-13 Infrared Window (10.7 um) images, pilot reports of turbulence, Turbulence AIRMET boundaries [click to play animation]](https://cimss.ssec.wisc.edu/satellite-blog/wp-content/uploads/sites/5/2016/07/160719_goes13_ir_transverse_banding_pireps_anim.gif)
GOES-13 Infrared Window (10.7 um) images, pilot reports of turbulence, Turbulence AIRMET boundaries [click to play animation]
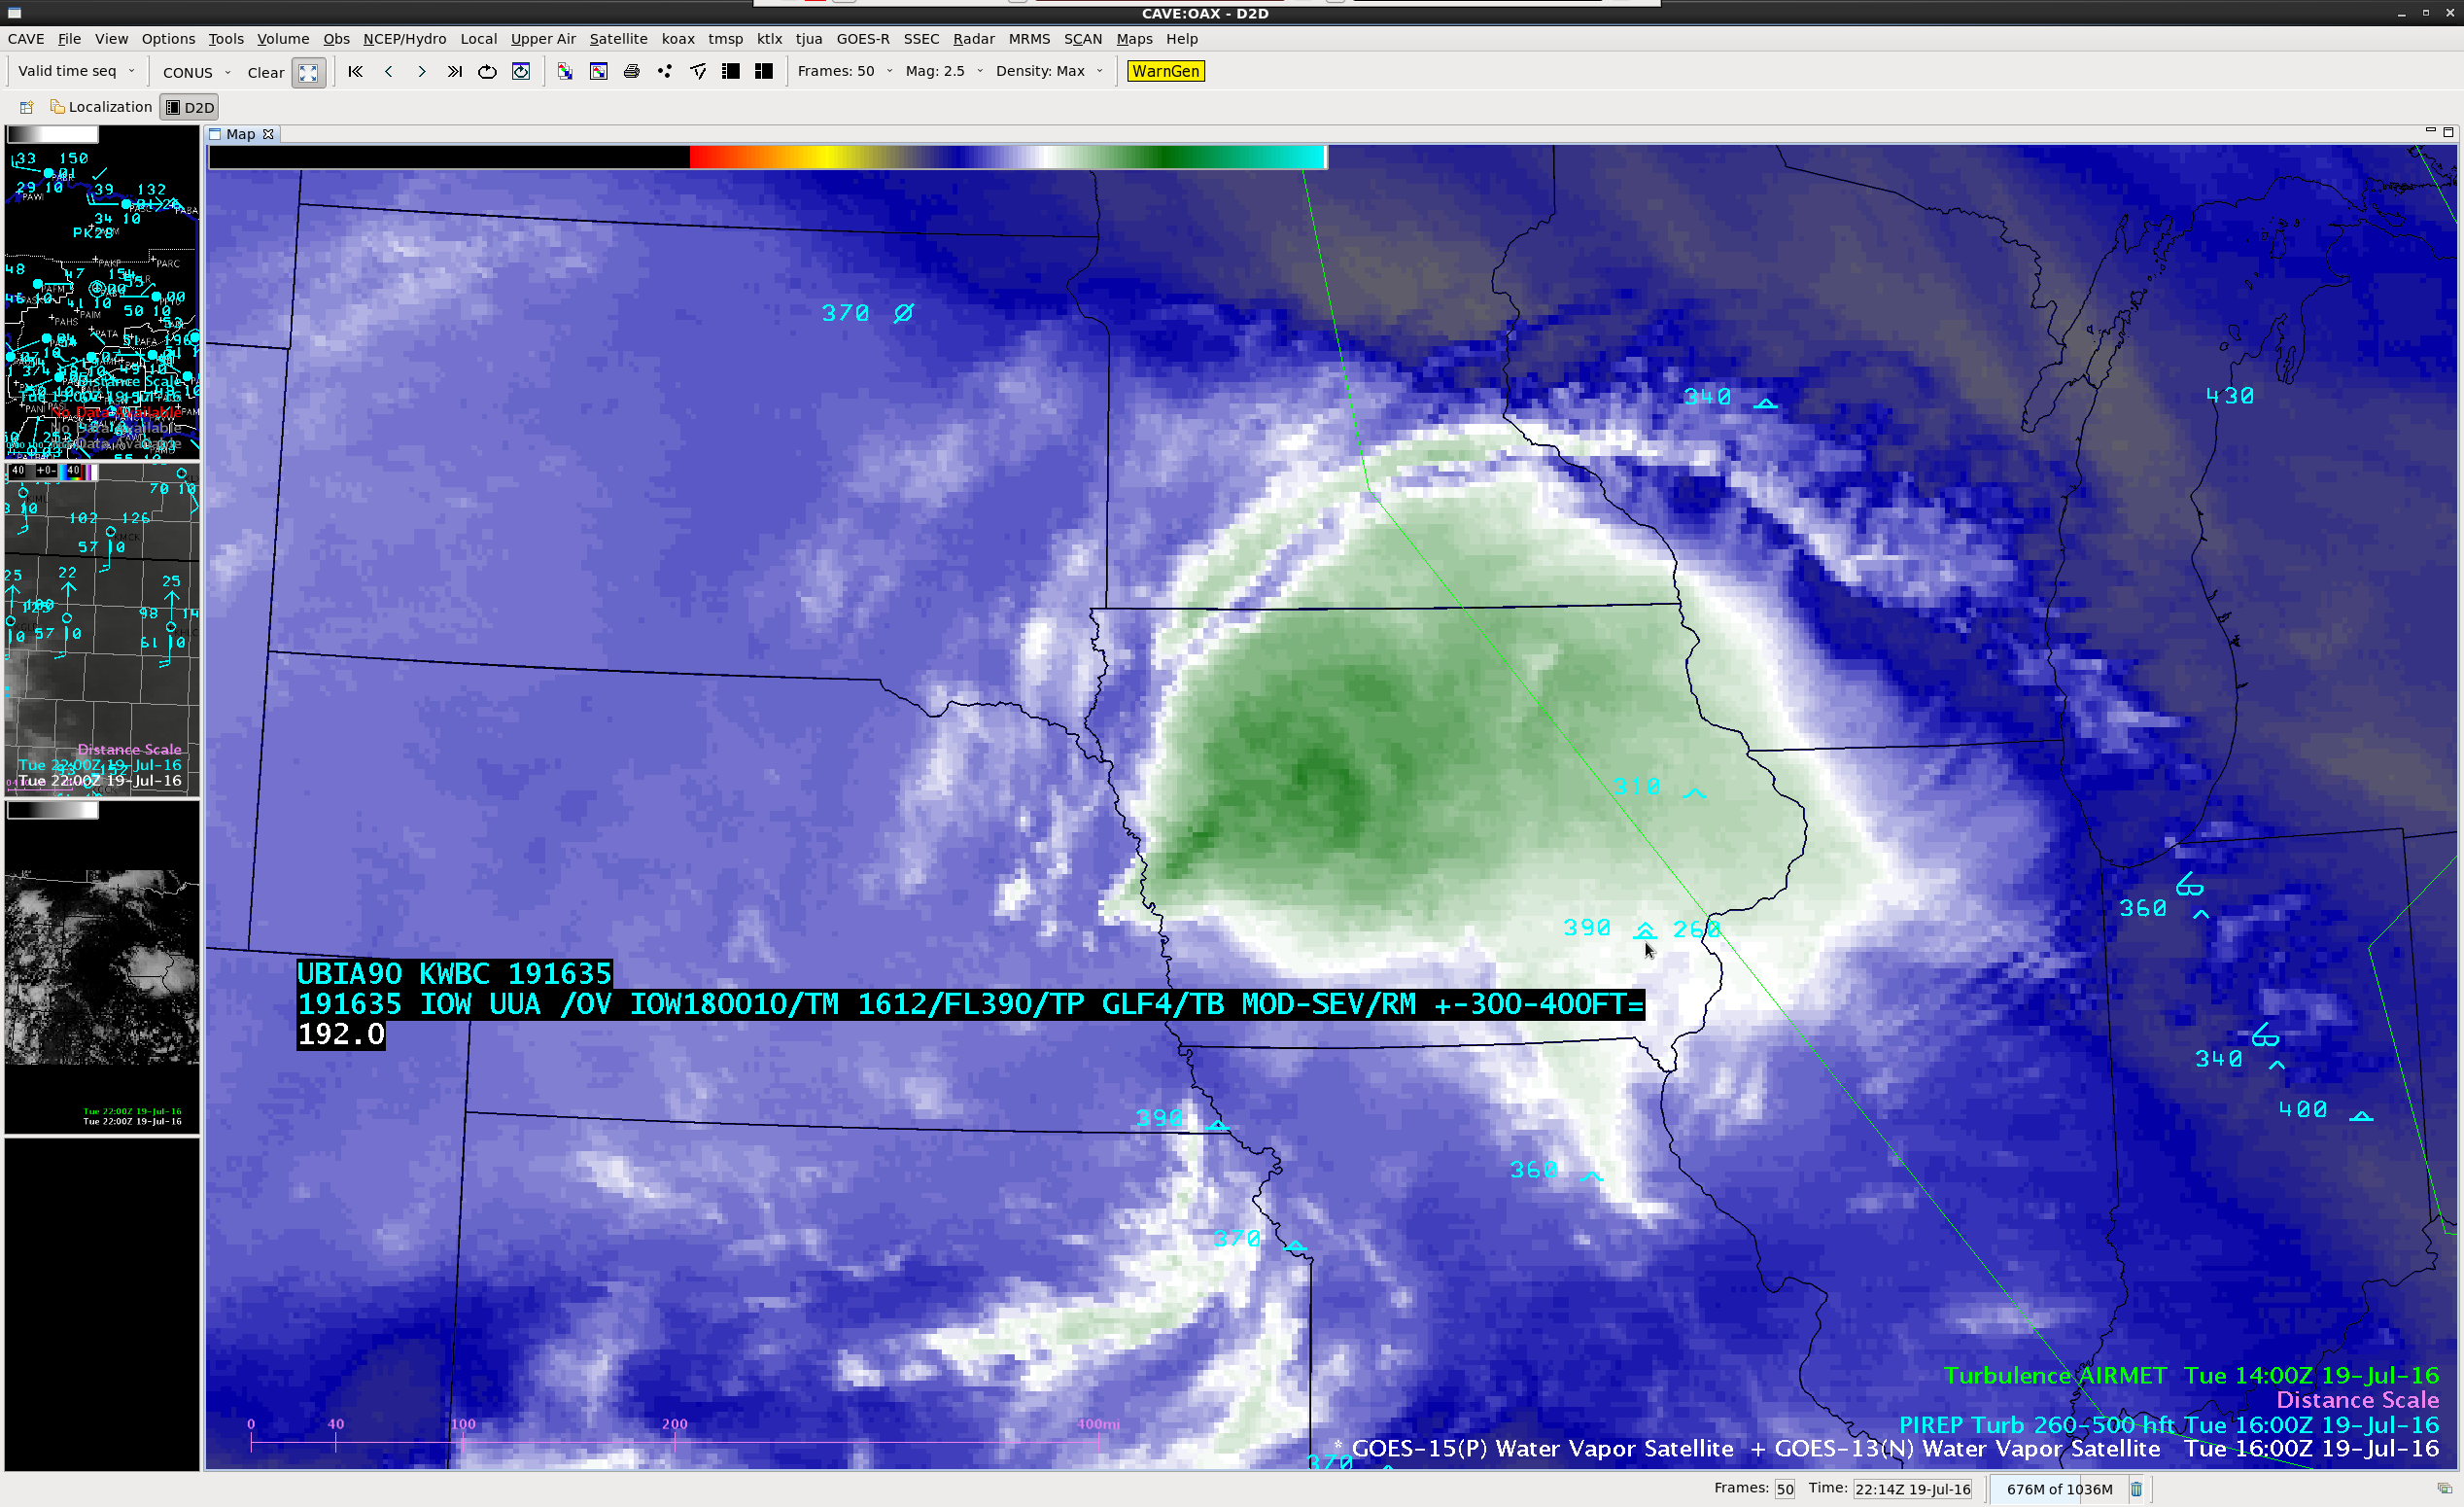
The corresponding GOES-13 Water Vapor (6.5 µm) images (below) perhaps highlighted the transverse banding features a bit better at times, since the weighting function for that spectral band generally peaks in the middle to upper troposphere where the transverse banding cloud features existed.
![GOES-13 Water Vapor (6.5 um) images, pilot reports of turbulence, Turbulence AIRMET boundaries [click to play animation]](https://cimss.ssec.wisc.edu/satellite-blog/wp-content/uploads/sites/5/2016/07/160719_goes13_wv_transverse_banding_pireps_anim.gif)
GOES-13 Water Vapor (6.5 um) images, pilot reports of turbulence, Turbulence AIRMET boundaries [click to play animation]
![Infrared Window images from POES AVHRR (10.8 µm) and Suomi NPP VIIRS (11.45 µm) [click to enlarge]](https://cimss.ssec.wisc.edu/satellite-blog/wp-content/uploads/sites/5/2016/07/160719_avhrr_modis_viirs_infrared_mcs_transverse_banding_anim.gif)
Infrared Window images from POES AVHRR (10.8 µm) and Suomi NPP VIIRS (11.45 µm) [click to enlarge]
![Suomi NPP VIIRS Infrared Window (11.45 µm) and Day/Night Band (0.7 µm) images [click to enlarge]](https://cimss.ssec.wisc.edu/satellite-blog/wp-content/uploads/sites/5/2016/07/160719_0949utc_suomi_npp_viirs_NE_SD_mcs_transverse_banding_anim.gif)
Suomi NPP VIIRS Infrared Window (11.45 µm) and Day/Night Band (0.7 µm) images [click to enlarge]
![Terra MODIS Infrared Window (11.0 µm) and Cirrus (1.37 µm) images [click to enlarge]](https://cimss.ssec.wisc.edu/satellite-blog/wp-content/uploads/sites/5/2016/07/160719_1727utc_modis_infrared_cirrus_anim.gif)
Terra MODIS Infrared Window (11.0 µm) and Cirrus (1.37 µm) images [click to enlarge]