![GOES-16 Mid-level Water Vapor (6.9 µm) and “Clean” Infrared Window (10.35 µm) images, with pilot reports of turbulence plotted in cyan/yellow [click to play animation | MP4]](https://cimss.ssec.wisc.edu/satellite-blog/images/2021/08/210807_goes16_waterVapor_infrared_Upper_Midwest_transverse_banding_anim.gif)
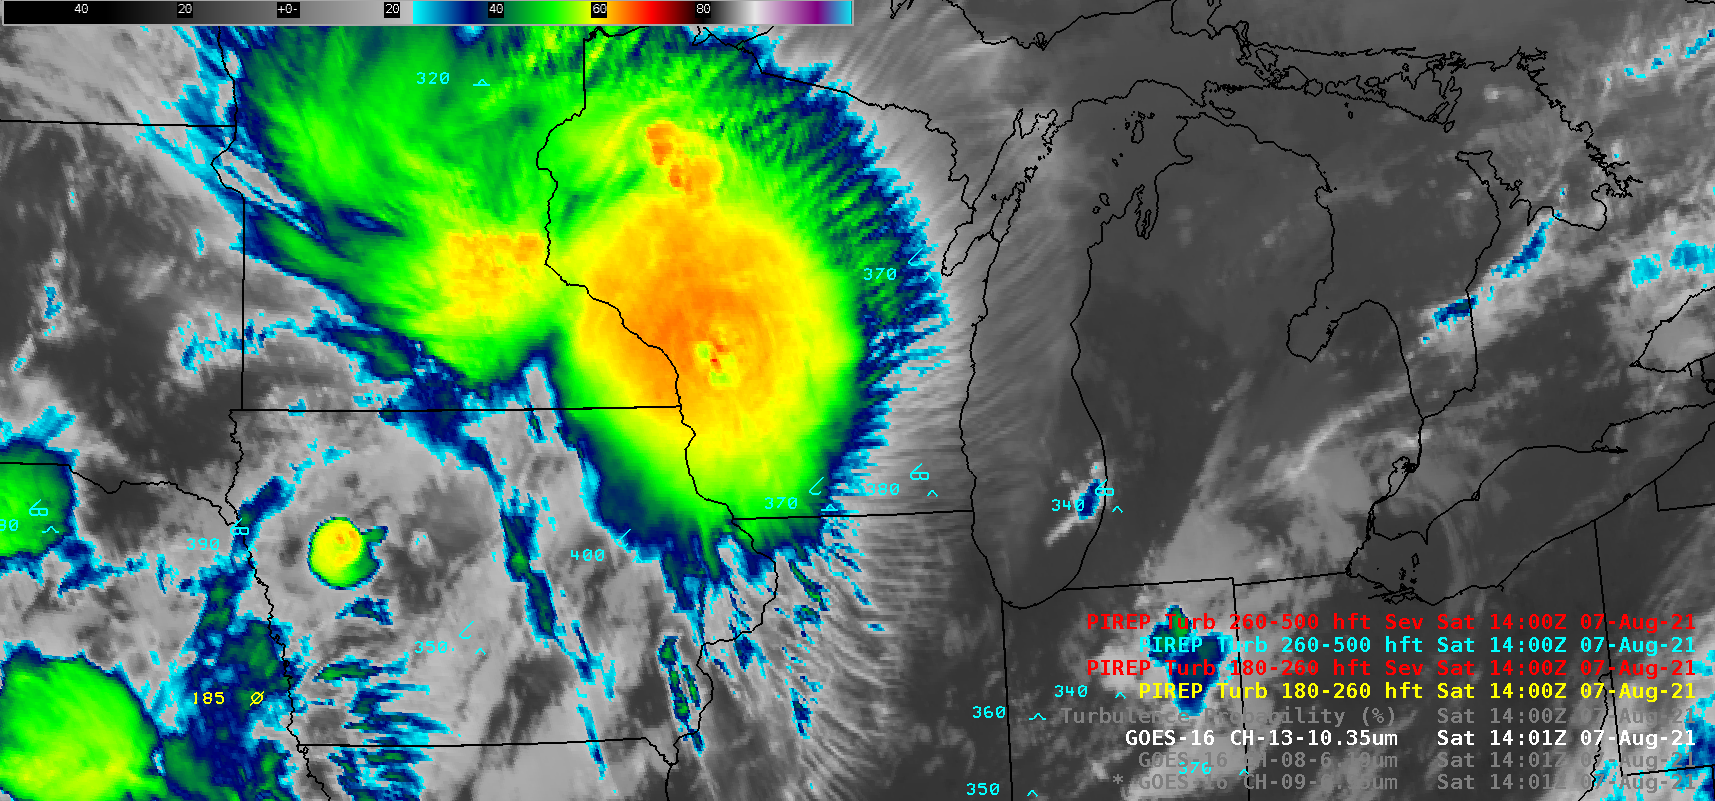
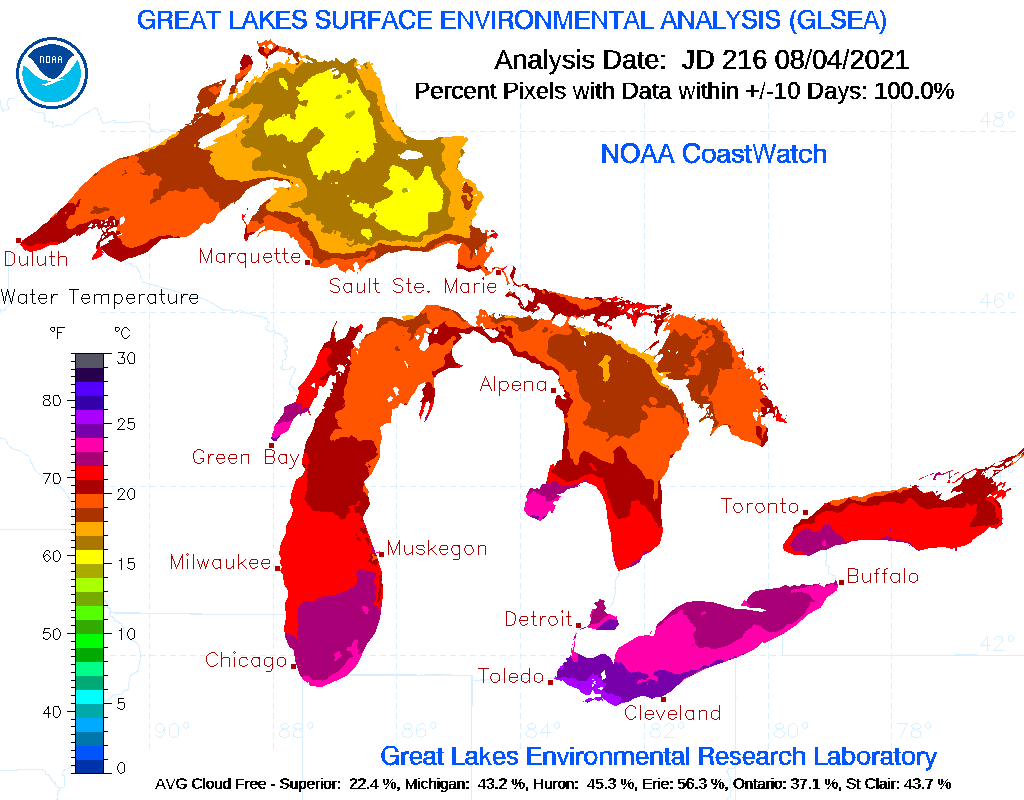
GOES-16 Mid-level Water Vapor (6.9 µm) and “Clean” Infrared Window (10.35 µm) images, with pilot reports of turbulence plotted in cyan/yellow [click to play animation | MP4]
GOES-16 (GOES-East) Mid-level Water Vapor (6.9 µm) and “Clean” Infrared Window (10.35 µm) images (above) revealed the formation of transverse banding along the eastern periphery of a decaying Mesoscale Convective System in the Upper Midwest during the morning hours on 07 August 2021. Transverse banding is a satellite signature that usually indicates an enhanced potential of turbulence (reference)— and there were indeed multiple reports of light-to-moderate turbulence within the 26-50,000 feet altitude range (cyan).
CIMSS Scientists have used machine-learning to create a predictive tool for moderate-or-greater (MOG) turbulence based in part on satellite imagery. The product for 1405 UTC on 7 August is shown below. A maximum is anchored on the MCS. This product is available online here. Training for this product is here.

View only this post Read Less
