This website works best with a newer web browser such as Chrome, Firefox, Safari or Microsoft
Edge. Internet Explorer is not supported by this website.
The animation above shows NUCAPS sounding availability plots from sequential NOAA-20 overpasses on 5 August 2021. Stations that are north of about 39 N will occasionally see profiles from two sequential overpasses, as was the case above at Buffalo NY, and also Pittsburgh PA. A benefit of NUCAPS soundings is... Read More
NUCAPS Sounding Availability points at 0615 and 0755 UTC on 5 August 2021 (Click to enlarge)
The animation above shows NUCAPS sounding availability plots from sequential NOAA-20 overpasses on 5 August 2021. Stations that are north of about 39 N will occasionally see profiles from two sequential overpasses, as was the case above at Buffalo NY, and also Pittsburgh PA. A benefit of NUCAPS soundings is that they show up halfway between 0000 and 1200 UTC upper-air soundings. The animations below show 0000 UTC and 1200 UTC soundings from Buffalo (top) and Pittsburgh (bottom) with two soundings from NUCAPS from the closest point to the upper air launch.
Upper-air Soundings from Buffalo at 0000 and 1200 UTC as well as nearby NUCAPS Profiles from 0600 and 0800 UTC, all on 5 August 2021 (Click to enlarge)Upper-air Soundings from Buffalo at 0000 and 1200 UTC as well as nearby NUCAPS Profiles from 0600 and 0800 UTC, all on 5 August 2021 (Click to enlarge)
When sequential overpasses happen, a forecaster can use information to tell how things are changing on 90-minute timescales. Even with only one profile, however, one can view changes between the synoptic upper-air soundings. It is worth mentioning a couple obvious differences between the two data sources: Radiosondes are sampling a line that moves up in the atmosphere over a period of time (up to two hours!); that line can extend over a significant horizontal distance; in contrast, NUCAPS observations are volumetric and instantaneous. NUCAPS profiles are very smooth compared to radiosondes, and extreme values, or very thin layers are unusual in NUCAPS profiles.
NUCAPS profiles are available at this OSPO site. Gridded NUCAPS fields are here.
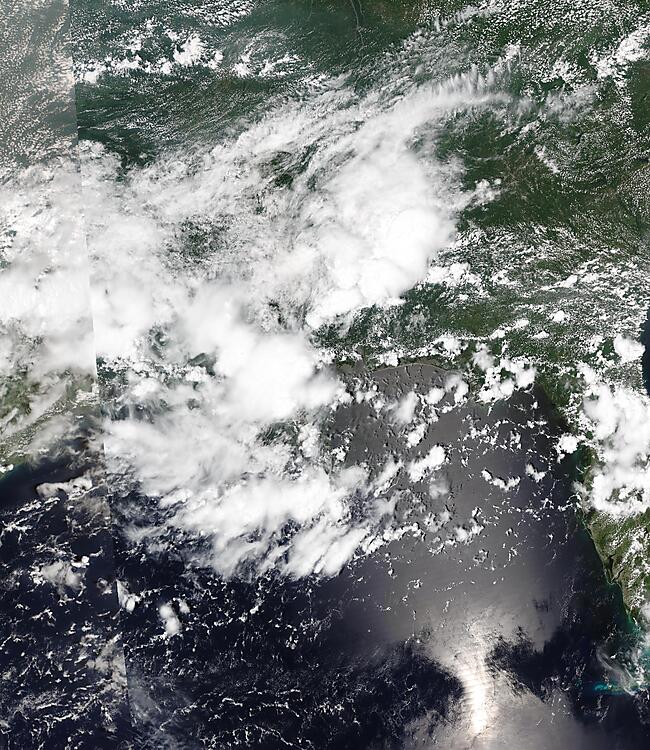
True-color imagery from the VIIRS Today website, below (click here for a direct link to the image below at the VIIRS Today site), shows an unusual sunglint pattern over the eastern Gulf of Mexico, to the southwest of the Florida peninsula. Typically, sunglint features are fairly wide... Read More
True-color imagery from the VIIRS Today website, below (click here for a direct link to the image below at the VIIRS Today site), shows an unusual sunglint pattern over the eastern Gulf of Mexico, to the southwest of the Florida peninsula. Typically, sunglint features are fairly wide in VIIRS imagery, as evidenced from this Suomi-NPP image, also from 2 August, but to the east of Florida. However, the winds over the eastern Gulf were very light on 2 August, so surface wave action was reduced. When the ocean approaches glassy calm, solar reflection becomes more unidirectional, and a brighter spot becomes visible in True-Color imagery. When seas are choppier (as was the case to the east of Florida), solar reflection off the ocean is diffuse, and a less concentrated region of brightness results. An good analogy might be reflection off flat aluminum foil (representing a flat sea state) or very crinkled aluminum foil (representing an agitated sea state).
NOAA-20 True Color Imagery over the eastern Gulf of Mexico from 2 August 2021 (Click to enlarge)
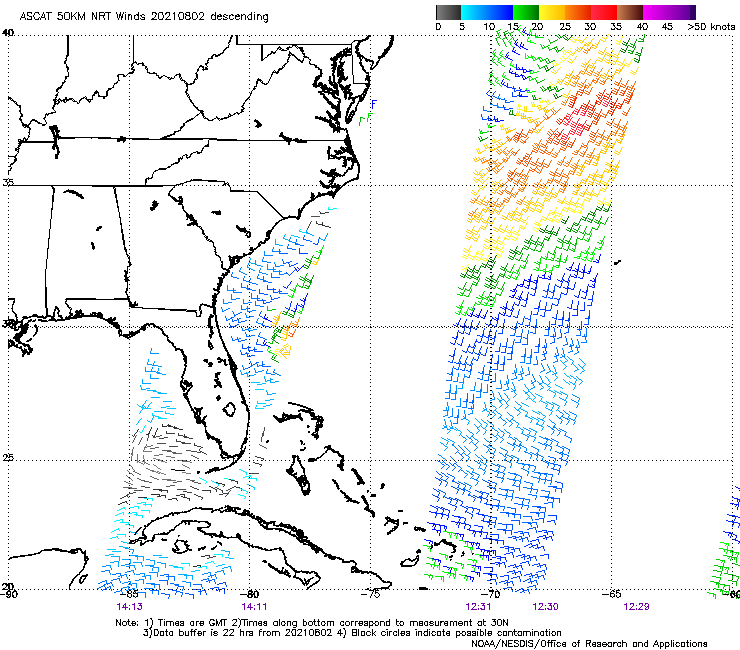
What evidence is present of light winds? Consider the Metop-A Scatterometry image, below, from this site. Both the ascending pass (about 0145 UTC) and descending pass, below (about 1410 UTC; orbit imagery available here, from this site) show very weak winds over the Gulf to the southwest of Florida.
Metop-A Scatterometer winds from the ca. 1410 UTC descending pass, 2 August 2021 (Click to enlarge)
NOAA-20 VIIRS I-Bands 01-05 over the southeastern Gulf of Mexico, 1842 UTC on 2 August 2021 (Click to animate)
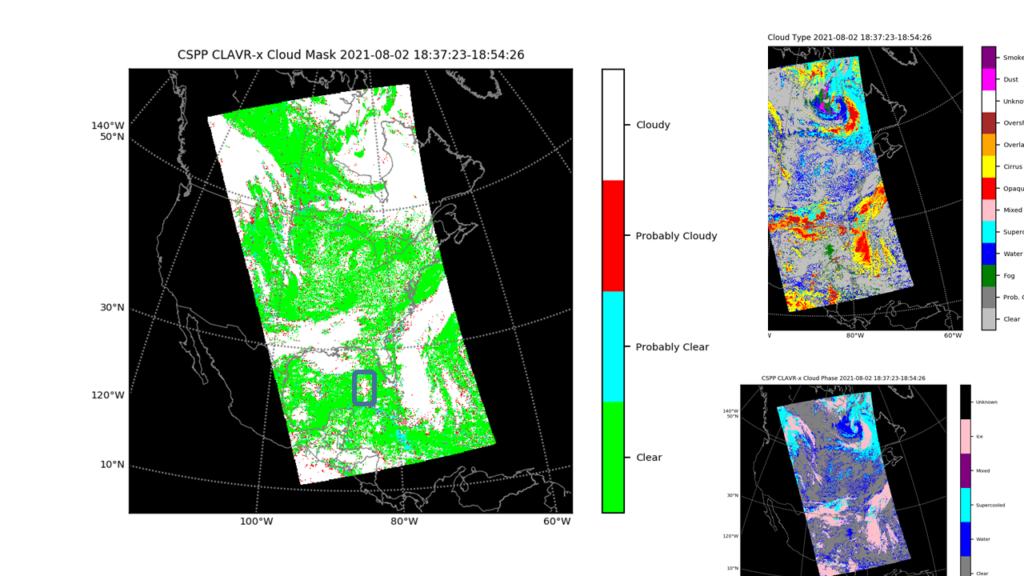
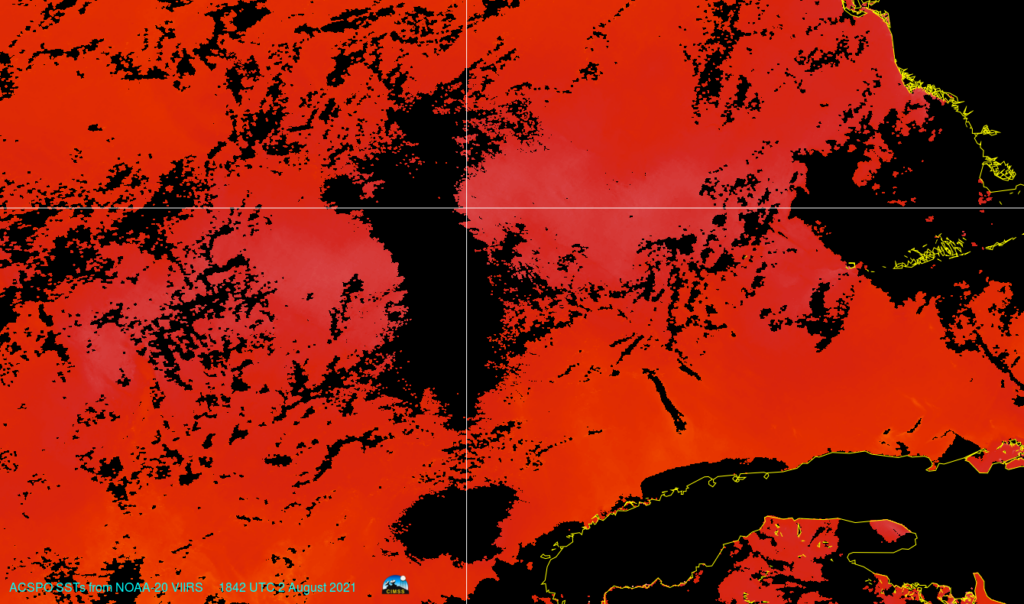
Does the sunglint affect products? The Cloud Mask product is tricked by the large reflectance into believing a cloud is present, as highlighted by the box below. The image also includes Cloud Type and Cloud Phase. Because liquid water clouds are believed present, the ACSPO Sea-surface temperature algorithm (at bottom) produces no values in that region. Careful inspection of the image, however, shows marginally warmer waters (a lighter pink color is apparent) adjacent to the sunglint where the lack of wind means surface mixing of waters is suppressed and a thin layer of very warm water can develop on the top of the ocean.
CLAVR-X Cloud Mask product, 1842 UTC on 2 August 2021, along with Cloud Type (upper right) and Cloud Phase (lower right).ACSPO SSTs at 1842 UTC on 4 August 2021
This animation steps through all the VIIRS M-bands. The sunglint is apparent in nearly all of them, except for wavelengths longer than 4 µm. The sunglint is also missing from the 1.38 µm (M09) imagery because of strong absorption of energy at that wavelength by water vapor.
Other examples of diagnosing areas of light winds over water (via a lack of sunglint or moonglint) can be found here, here, here and here.
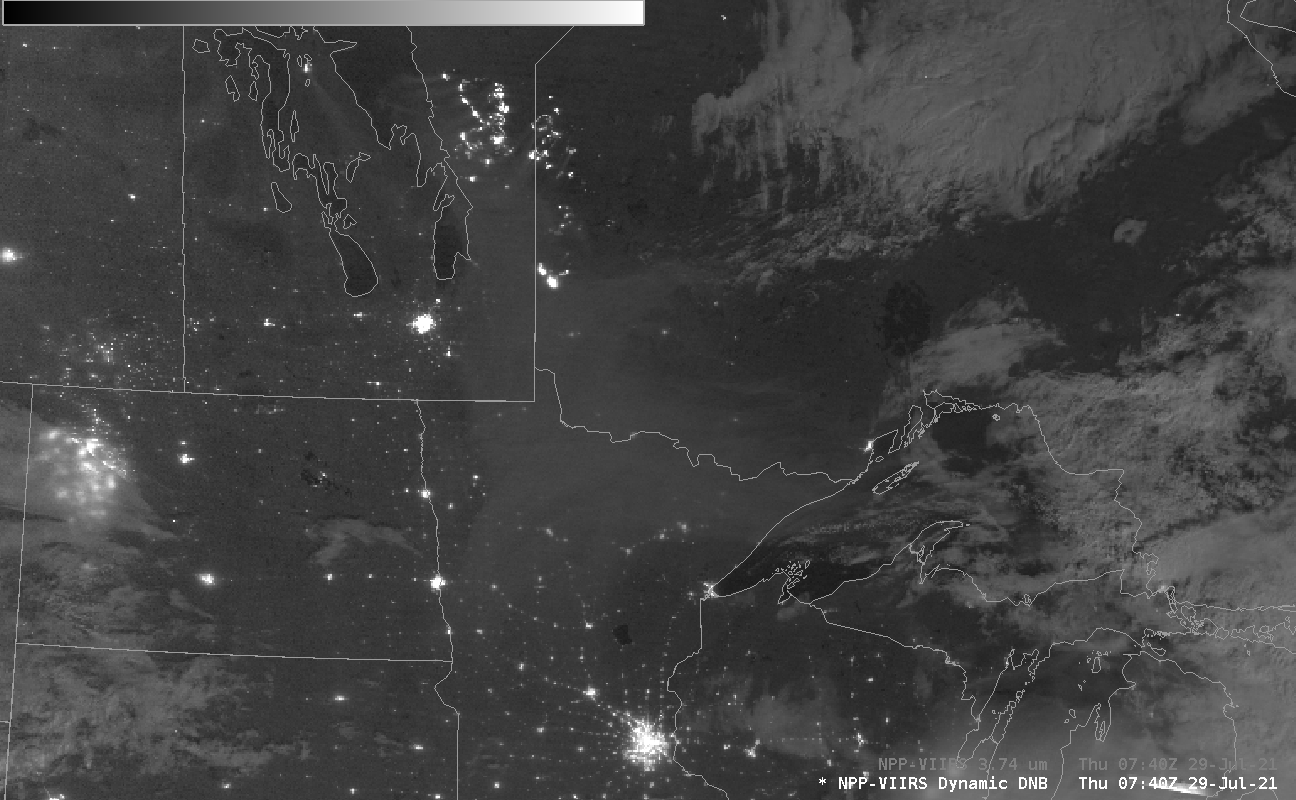
Smoke from fires (unless it is extraordinarily thick) is very challenging to detect at night in infrared imagery. When there is sufficent lunar illumination, however, as occurred on 29 July 2021 over Canada (the image above shows northwestern Ontario and southern Manitoba — Lakes Winnepeg, Winnepegosis and Manitoba are apparent,... Read More
Suomi NPP VIIRS Day Night Band Visible (0.70 µm) image, 0740 UTC on 29 July 2021 (Click to enlarge)
Smoke from fires (unless it is extraordinarily thick) is very challenging to detect at night in infrared imagery. When there is sufficent lunar illumination, however, as occurred on 29 July 2021 over Canada (the image above shows northwestern Ontario and southern Manitoba — Lakes Winnepeg, Winnepegosis and Manitoba are apparent, and the city of Winnipeg’s lights are apparent along the southern border of the image), the pall of smoke can be detected just as during the daytime using Day Night band visible imagery. In the image above, bright signals are showing light emitted by active fires, and streams of smoked from the fires are apparent. The toggle below of the Day Night band image and the VIIRS I04 3.74 µm imagery underscores that the bright spots are also very warm spots; that is: fires. Note that a smoke signal is not present at all in the infrared.
VIIRS Visible (0.7 µm) Day Night Band imagery and I04 Infrared (3.74 µm) imagery, 0740 UTC on 29 July 2021 (Click to enlarge)Suomi NPP VIIRS Day Night Band Visible (0.70 µm) image, 0740 UTC on 29 July 2021 (Click to enlarge)
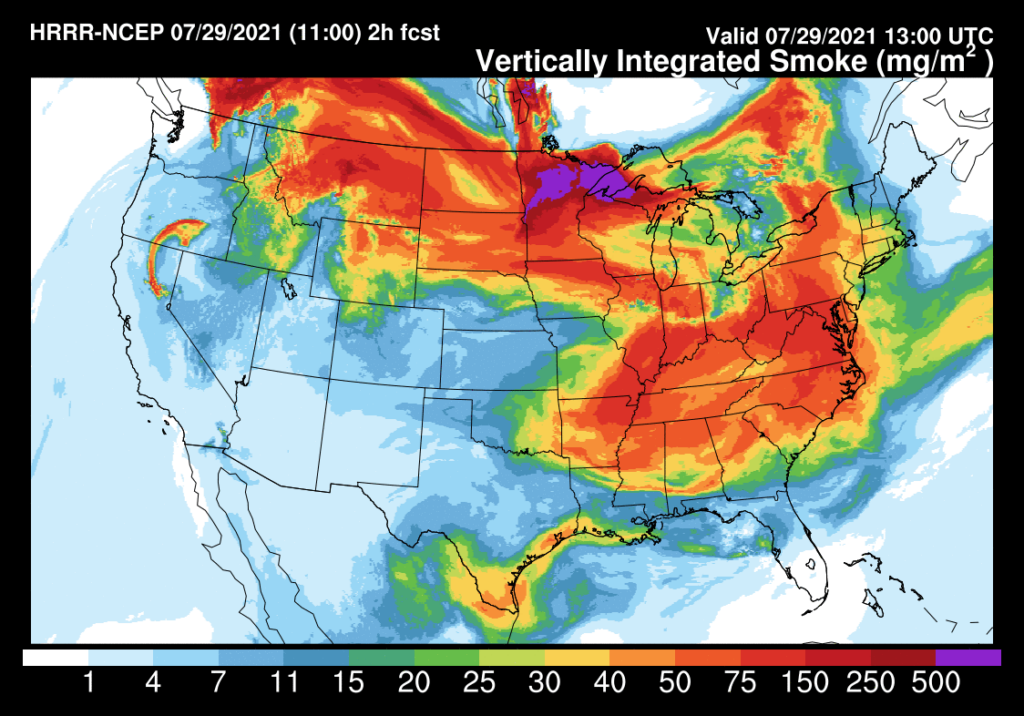
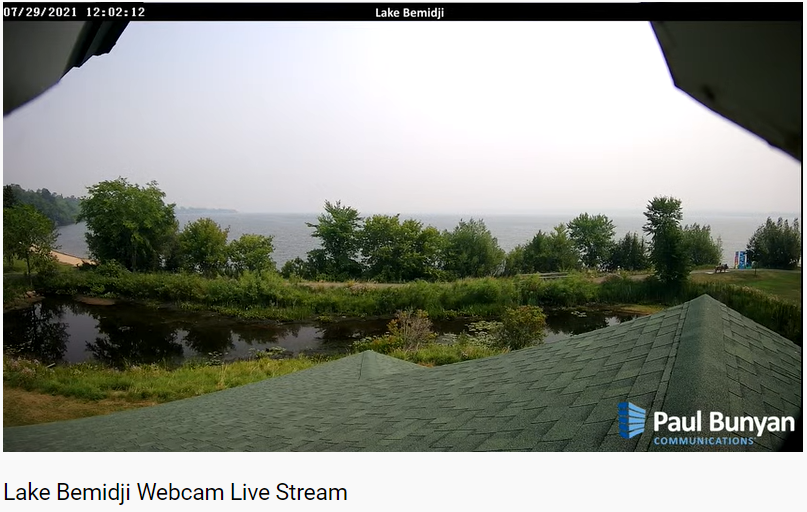
A zoomed-out Day Night band image shows the horizontal extent of the smoke pall that extends southward into Minnesota. This kind of night-time imagery can be useful to compare observations to model estimates of smoke coverage as created by the HRRR Smoke model. Compare the image above, for example, to the two-hour forecast of vertically integrated smoke valid at 1300 UTC on 29 July, shown below. There is good agreement in the coverage over northern Minnesota. What does that kind of smoke look like from the ground? Here’s a image from a webcam at Lake Bemidji (from this source). GOES Imagery, at bottom, from just before Noon Central time (and from the CSPP Geosphere site) also shows the very thick smoke over Minnesota.
HRRR Smoke forecast valid at 1300 UTC, a 2-hour forecast from an 1100 UTC/29 July 2021 initialization (Click to enlarge)CSPP Geosphere True Color imagery, 1650 UTC on 29 July 2021 (Click to enlarge)
Use the Day Night band image (as available here, for example) to identify smoke plumes when lunar illumination is present.
Severe thunderstorms developed (in a moderate risk region from the Storm Prediction Center; here are the Storm Reports) over northern Wisconsin late in the day on 28 July 2021 and moved to the southeast (here is an mp4 animation of GOES-16 imagery courtesy of Tim Schmit, NOAA). The Day Night Band imagery, above, from... Read More
VIIRS NPP Day Night Band visible (0.70 µm) imagery from Suomi-NPP (0740 UTC) and NOAA-20 (0831 UTC) on 29 July 2021 (Click to enlarge)
Severe thunderstorms developed (in a moderate risk region from the Storm Prediction Center; here are the Storm Reports) over northern Wisconsin late in the day on 28 July 2021 and moved to the southeast (here is an mp4 animation of GOES-16 imagery courtesy of Tim Schmit, NOAA). The Day Night Band imagery, above, from Suomi NPP (0740 UTC) and NOAA-20 (0831 UTC), shows snapshots of the storms as they moved southward into Illinois. The 0740 UTC image include more evidence of lightning — especially in southwestern Wisconsin (the horizontal streaks of light) and just southwest of Dubuque. At 0831 UTC, lightning is not detected in the Day Night Band image.
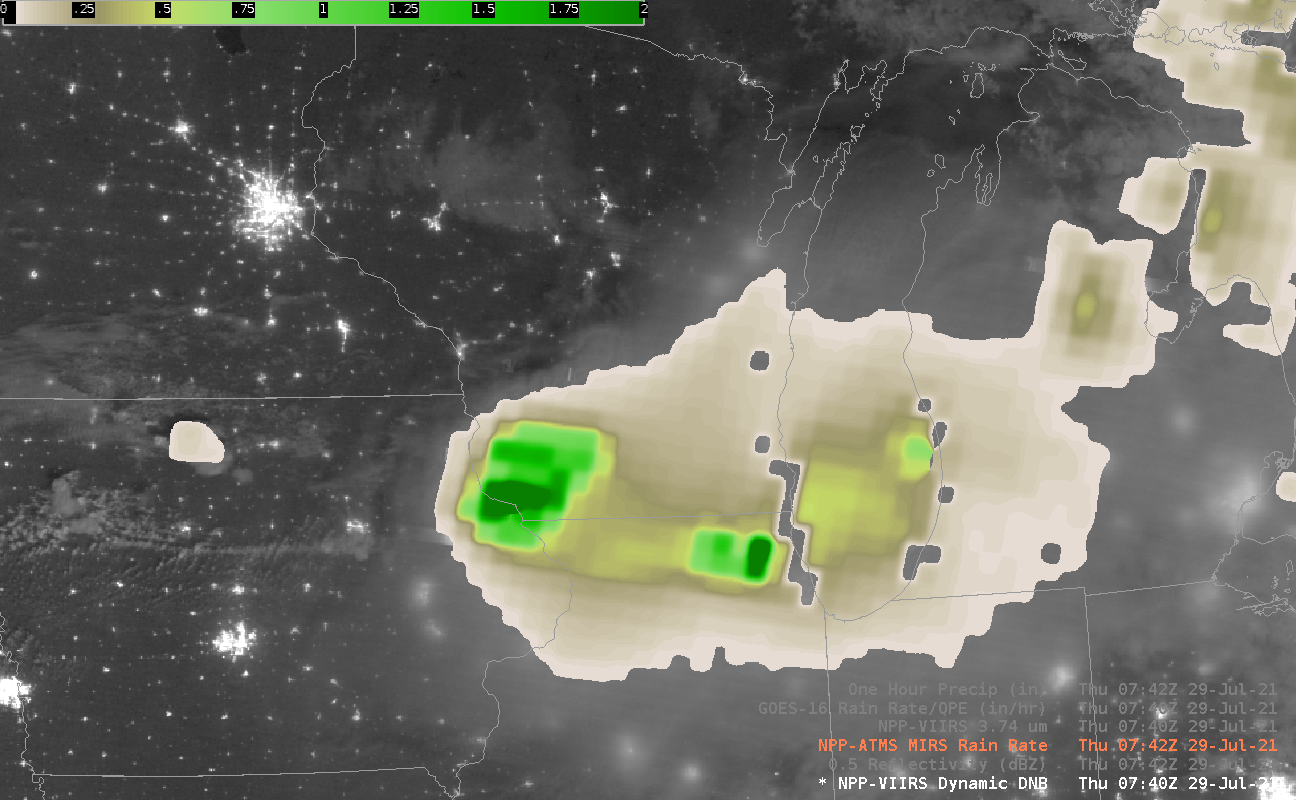
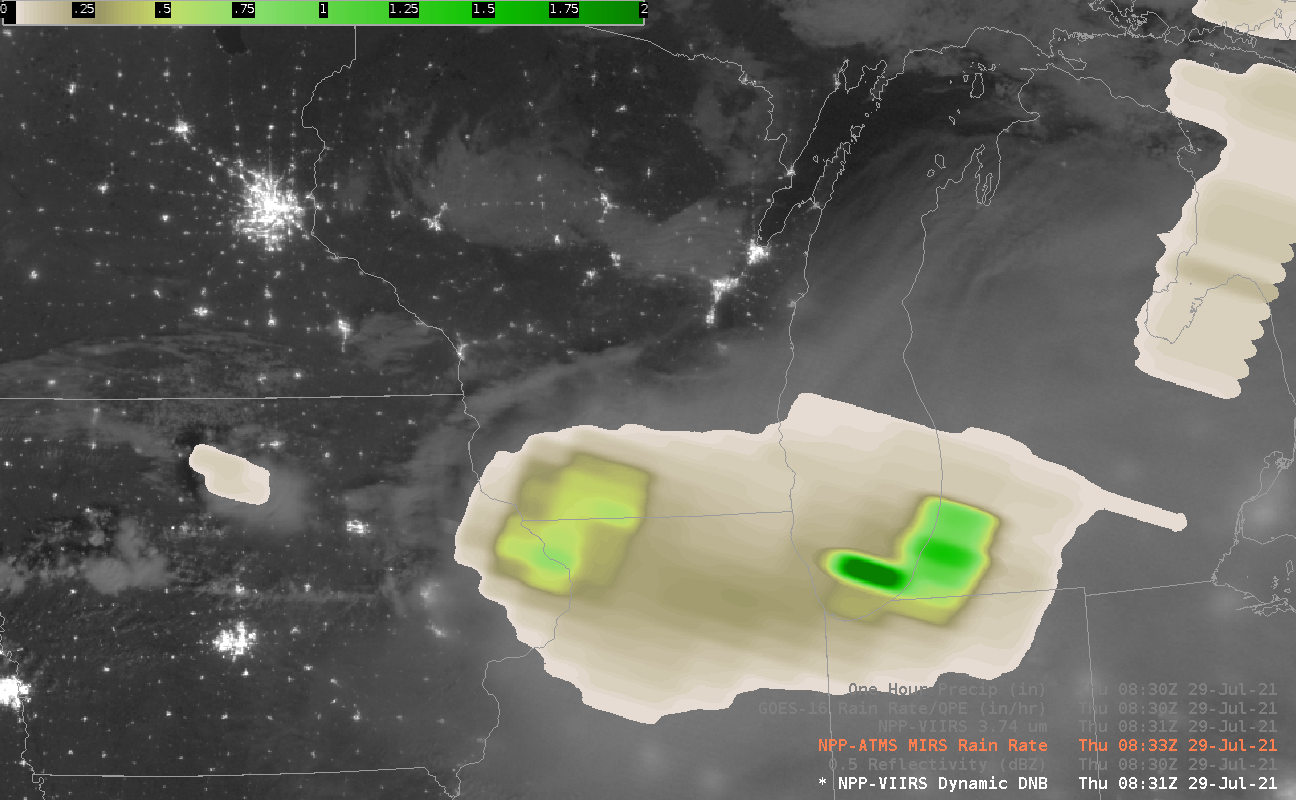
In addition to carrying the VIIRS (Visible-Infrared Imaging Radiometer Suite) instrument, Suomi-NPP and NOAA-20 also carry the Advanced Technology Microwave Sounder (ATMS), and microwave data from that instrument can be used to infer rain rates (using MIRS — Microwave Integrated Retrieval System — algorithms, that are part of Community Satellite Processing Package — CSPP — software available to use at Direct Broadcast sites). The toggles show the Day Night Band image, the ATMS-derived Rain Rate (the green region at 0742 UTC is >3″/hour!), and the base reflectivity at 0740 UTC (below) and at 0831 UTC (bottom). The MIRS Rain Rate (0742 UTC; 0833 UTC) product does outline regions where rain is likely falling, and gives credible values where the heaviest rains are falling. Note the diminishing rain rate over southwestern WI, for example, between 0740 and 0830 UTC — indicative of weaker convection — an observation echoed in the changes in lightning detection with the Day Night band. Changes in radar to reflect that difference in microwave-estimated rain rate are a little more subtle.
Because microwave estimates of rain rate are affected by background emissivity, and because water has a much lower microwave emissivity than land, you can sometimes view land/water boundaries (as in the 0742 UTC Rain Rate, below).
MIRS Rain Rate gives useful information about rains when radar observations cannot be accessed.
Suomi NPP Day Night Band visible (0.70 µm) image, ATMS estimates of Rain Rate, and 0.5-degree Reflectivity from a radar composite, all at 0740 UTC on 29 July 2021 (Click to enlarge)NOAA-20 Day Night Band visible (0.70 µm) image, ATMS estimates of Rain Rate, and 0.5-degree Reflectivity from a radar composite, all at 0830 UTC on 29 July 2021 (Click to enlarge)
MIRS Rain Rate products are available via an LDM feed from CIMSS; they are produced using the Direct Broadcast antenna at CIMSS and are thus very timely.


