This website works best with a newer web browser such as Chrome, Firefox, Safari or Microsoft Edge. Internet Explorer is not supported by this website.

Rope cloud feeding into Tropical Invest 98L

GOES-16 (GOES-East) True Color RGB images created using Geo2Grid (above) showed a long rope cloud feeding into the western portion of Tropical Invest 98L in the eastern Atlantic Ocean on 22 September 2021. The rope cloud was located near the African Monsoon Trough (12 UTC surface analysis), and north of the rope cloud the hazy appearance of... Read More

GOES-16 True Color RGB images [click to play animation | MP4]

GOES-16 (GOES-East) True Color RGB images created using Geo2Grid (above) showed a long rope cloud feeding into the western portion of Tropical Invest 98L in the eastern Atlantic Ocean on 22 September 2021. The rope cloud was located near the African Monsoon Trough (12 UTC surface analysis), and north of the rope cloud the hazy appearance of a dust-laden Saharan Air Layer was apparent — so this rope cloud feature likely marked the boundary between dry SAL air to the north and moist tropical air to the south (as seen in the MIMIC Total Precipitable Water product). In addition, Metop-A ASCAT surface scatterometer winds at 0956 UTC and 2104 UTC showed speed and/or directional convergence in the vicinity of the rope cloud (between 10-15 N latitude). Also of interest was the effect of the Cabo Verde islands on marine boundary layer clouds beneath the SAL. On the following day, Invest 98L intensified to become Tropical Storm Sam, as discussed in this blog post.

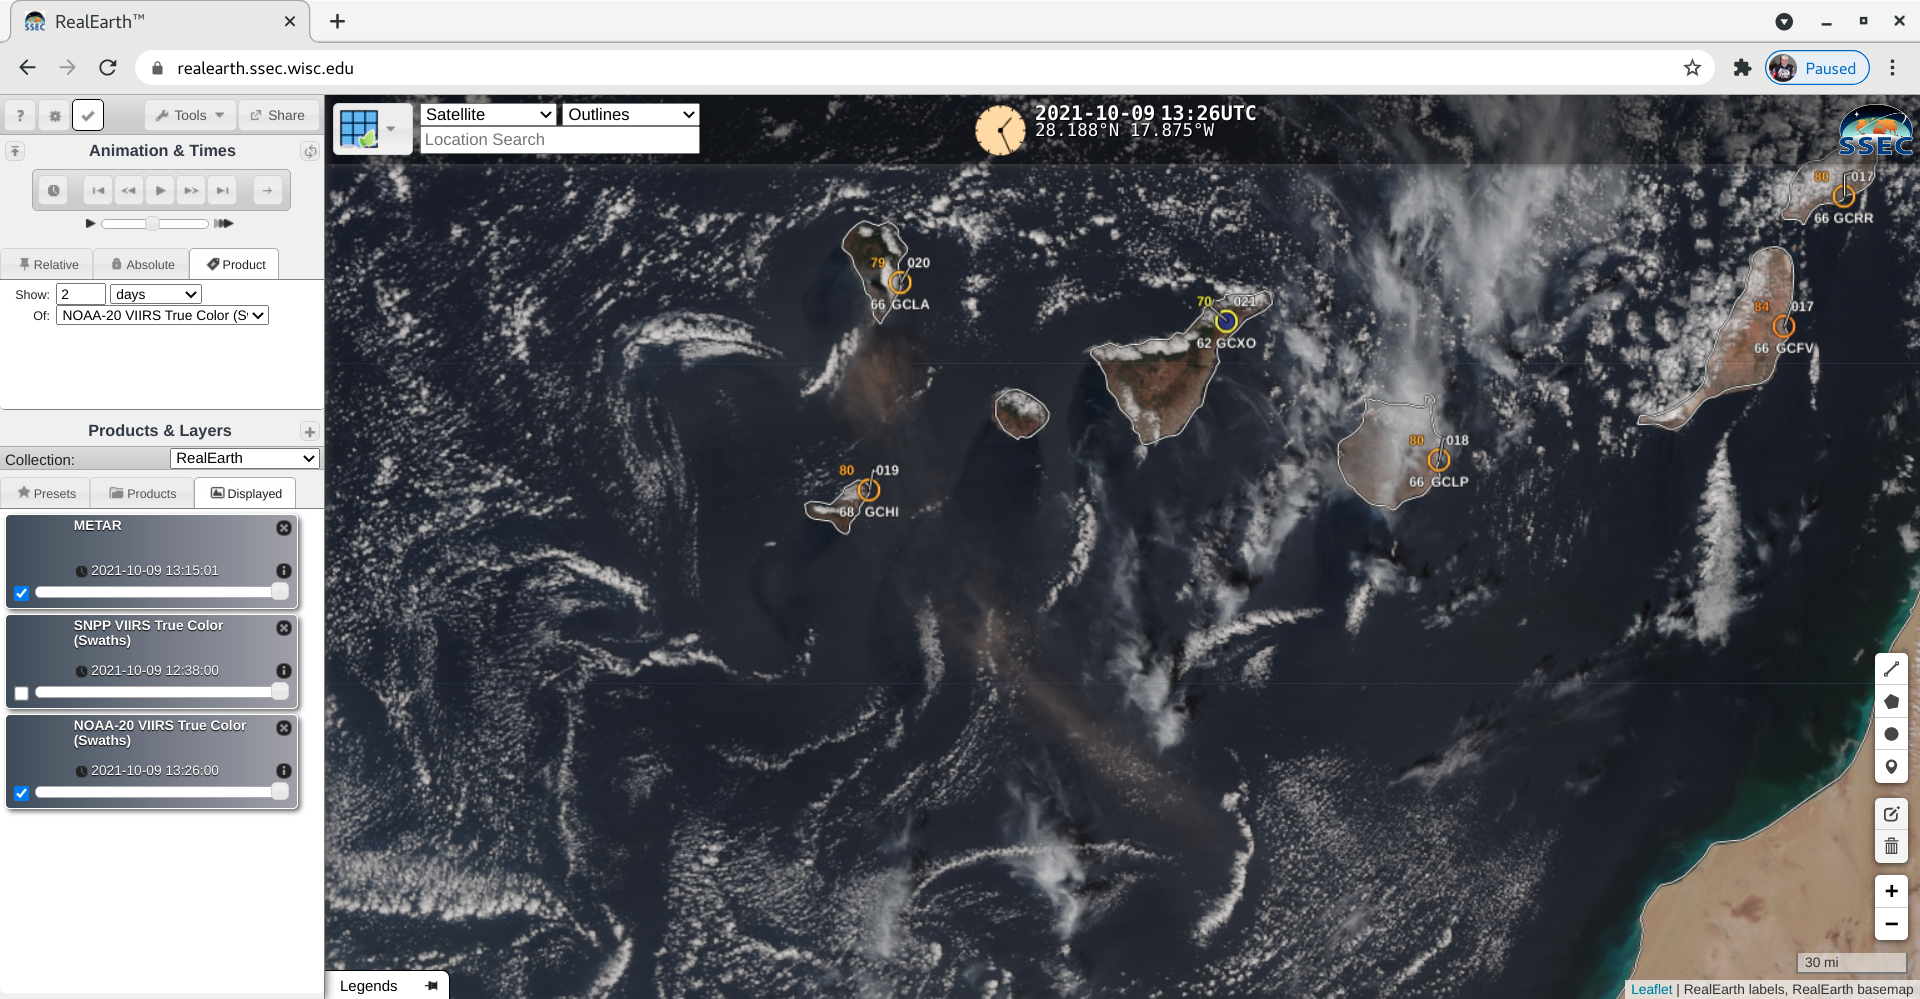
The hazy Saharan Air Layer was also seen in a Suomi NPP VIIRS True Color image at 1439 UTC, as visualized using RealEarth (below). The west-to-east oriented rope cloud was located around 11-12 N latitude.

VIIRS True Color RGB image from Suomi NPP [click to enlarge]

The “Saharan Air Layer” (SAL) Split Window Difference product from the CIMSS Tropical Cyclones site (below) depicted the westward advance of the dusty SAL air off northwestern Africa.

GOES-16 “Saharan Air Layer” Split Window Difference product [click to play animation]

View only this post Read Less

Sheared Tropical Storm Peter

Suomi NPP Day Night imagery, in a toggle above with infrared imagery from GOES-16, (both displayed in RealEarth) depicts a classic sheared Tropical Cyclone structure to the east-northeast of the Caribbean Sea. The low-level circulation (very apparent in the nighttime visible imagery under the illumination of a near-full moon) is... Read More

Suomi NPP Day Night Band visible (0.7 µm) imagery and GOES-16 infrared (10.3 µm) imagery, 0620 UTC on 20 September 2021 (Click to enlarge)

Suomi NPP Day Night imagery, in a toggle above with infrared imagery from GOES-16, (both displayed in RealEarth) depicts a classic sheared Tropical Cyclone structure to the east-northeast of the Caribbean Sea. The low-level circulation (very apparent in the nighttime visible imagery under the illumination of a near-full moon) is displaced to the west of the deep convection near the edge of this Suomi NPP scan. Indeed, the low-level circulation is difficult to discern in the single enhanced infrared image (animation better reveals its structure however). An earlier (0527 UTC) overpass from NOAA-20, below (VIIRS imagery courtesy William Straka, CIMSS), also shows the circulation to the west of the main convection. It would be a challenge to locate correctly the storm center based solely on the VIIRS infrared imagery!

NOAA-20 VIIRS I05 (11.5 µm) and Day Night Band Visible (0.7 µm) imagery at 0527 UTC on 20 September 2021 (Click to enlarge)

The shear that is disrupting TS Peter’s structure is shown below (imagery from the SSEC Tropical website), overlain on top of 1-km visible imagery at 1300 UTC.

GOES-16 Visible (0.64 µm) Imagery, 1300 UTC, along with an analysis of 200-850 mb wind shear (Click to enlarge)

For more information on struggling Tropical Storm Peter, visit the website of the National Hurricane Center.

View only this post Read Less
Local Noon imagery near the Equinox

SSEC/CIMSS scientists (notably Rick Kohrs) create daily imagery that blends vertical strips of true-color imagery at local Noon, starting near the dateline and proceeding westward. A year-long animation of this product is available here, and was discussed on this blog previously here (and here). Recent images are available at this website... Read More

Multi-satellite True-Color imagery at local noon, 19 September 2021 (Click to enlarge)

SSEC/CIMSS scientists (notably Rick Kohrs) create daily imagery that blends vertical strips of true-color imagery at local Noon, starting near the dateline and proceeding westward. A year-long animation of this product is available here, and was discussed on this blog previously here (and here). Recent images are available at this website — the imagery there, like that above, has a size of 1440×720 pixels. Full-size imagery (9200×4600 pixels) are available for purchase at the website.

The image above, from shortly before the (Northern Hemisphere) Autumnal Equinox shows illumination at both Poles. Careful inspection of the imagery does reveal difference between imagery created from Himawari-8 Imagery over eastern Asia and imagery created from Meteosat imagery over central Asia. There is a more subtle difference between Meteosat imagery and GOES-16 imagery, chiefly because that seam is over the eastern Atlantic Ocean. Such differences arise from spectral differences between the satellites.


This web page with web apps allows anyone to investigate how solar energy varies with the season.

View only this post Read Less

Eruption of the Cumbre Vieja volcano on La Palma in the Canary Islands

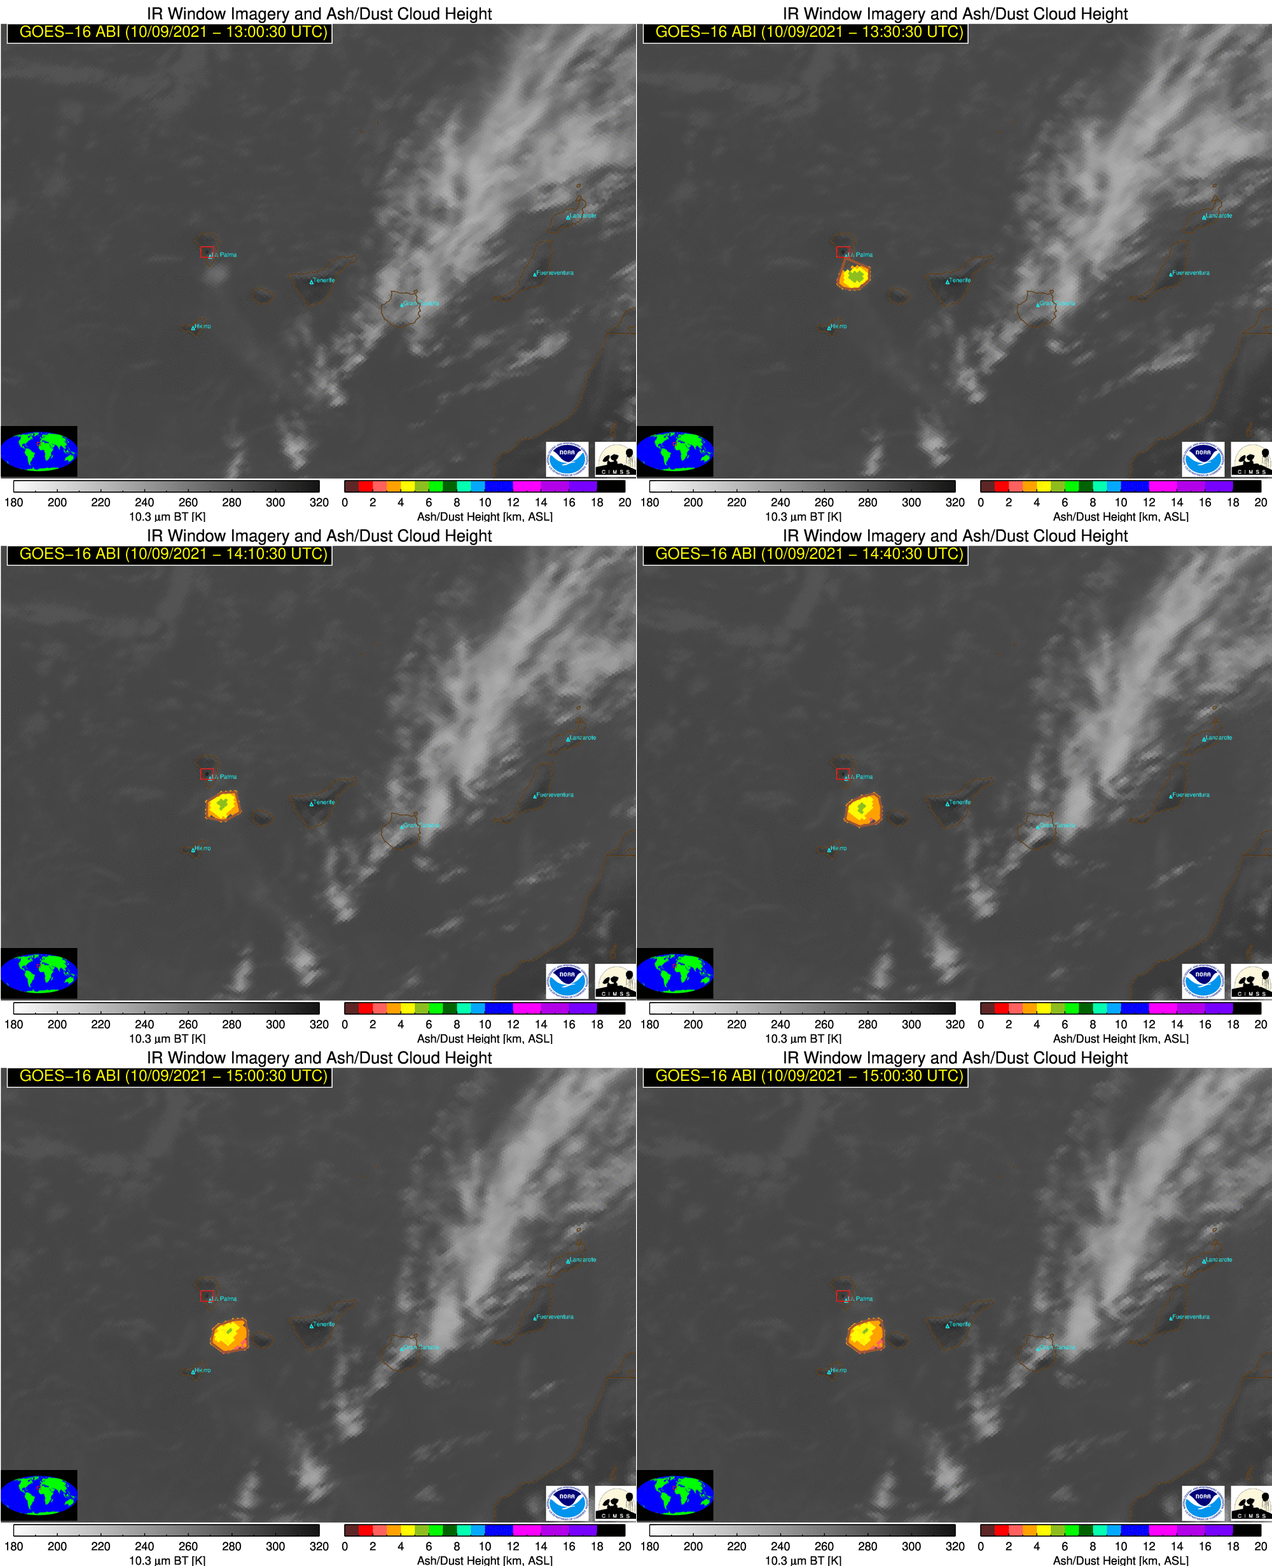
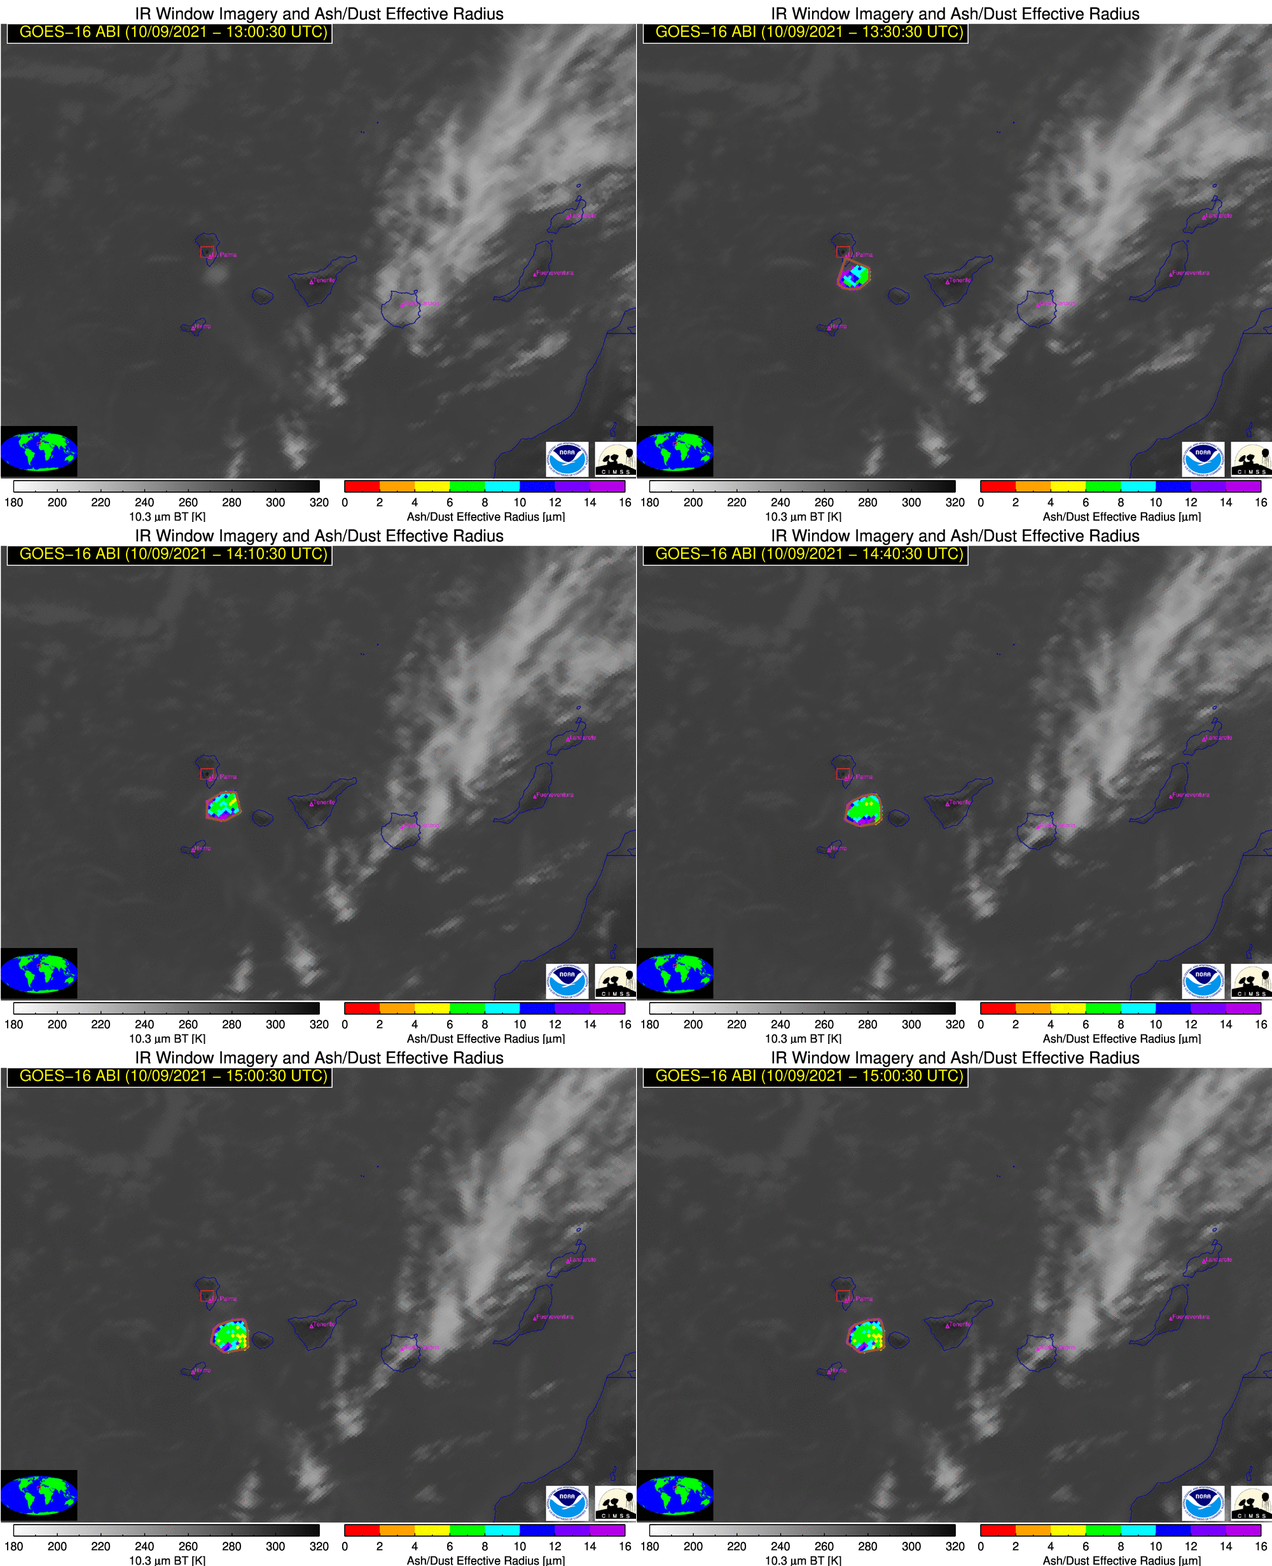
GOES-16 (GOES-East) True Color RGB images created using Geo2Grid (above) showed the southward expansion of a volcanic cloud following an eruption of Cumbre Vieja in the Canary Islands at 1410 UTC (advisories) on 19 September 2021. The eruption caused some evacuations on the island of La Palma. The ash loading was relatively light, as... Read More

GOES-16 True Color RGB images [click to play animation | MP4]

GOES-16 (GOES-East) True Color RGB images created using Geo2Grid (above) showed the southward expansion of a volcanic cloud following an eruption of Cumbre Vieja in the Canary Islands at 1410 UTC (advisories) on 19 September 2021. The eruption caused some evacuations on the island of La Palma. The ash loading was relatively light, as no distinct ash signature (shades of pink to magenta) was seen the corresponding GOES-16 Ash RGB  images (animated GIF | MP4) — however, pale shades of green in those RGB images did suggest the presence of SO2 within the volcanic cloud (below). Lower-altitude winds transported some of the volcanic cloud material southwestward, while higher-altitude winds carried SO2-rich parts of the volcanic cloud toward the southeast (Tenerife, Canary Islands sounding).

GOES-16 True Color RGB and Ash RGB images at 1700 UTC [click to enlarge]

A distinct thermal anomaly (cluster of hot pixels, yellow to red enhancement) was seen at the eruption site on GOES-16 Shortwave Infrared (3.9 µm) images (below) — this thermal signature briefly subsided about 2 hours after the eruption, but then resumed for several additional hours. The bulk of any significant volcanic ash remained aloft, with no restrictions to surface visibility reported at La Palma or Tenerife.

GOES-16 Shortwave Infrared (3.9 µm) images [click to play animation | MP4]

View only this post Read Less