An EF-3 tornado moved through the southwest Wisconsin town of Boscobel, in Grant County, late in the afternoon of 7 August 2021 (Preliminary Storm Summary from WFO ARX). The tornado was on the ground from 4:29 to 4:56 PM CDT, or 2129 – 2156 UTC. How did the ABI imagery and GLM data change over this time? The Satellite Information Familiarization Tool (SIFT) can be used to investigate this. Gridded GLM data that can be imported into SIFT (a two-week rolling archive is available) is available at this website. ABI Radiance data can be acquired from NOAA CLASS or from the Amazon Cloud.
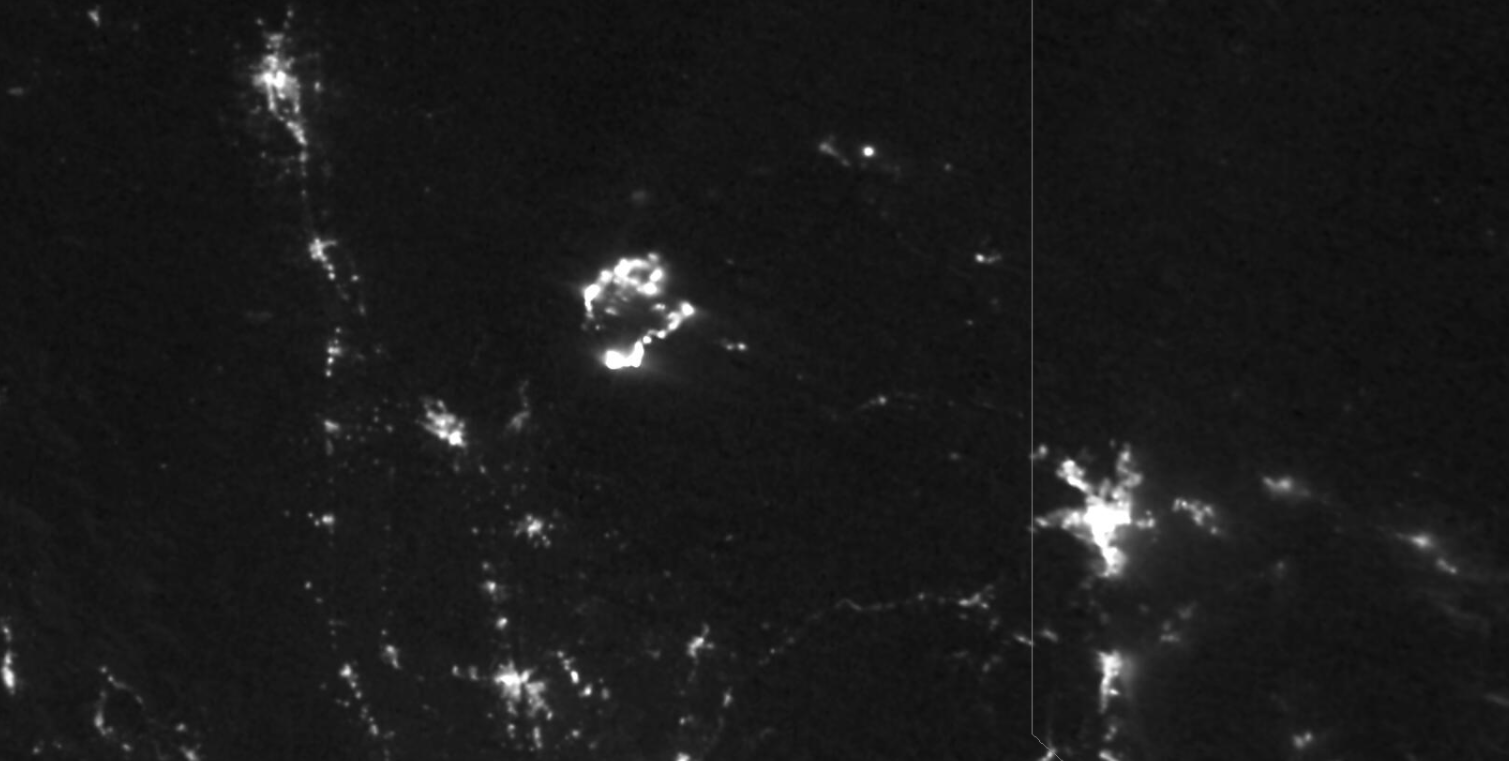
The GOES-16 ABI Clean Window animation from 2100 to 2159 UTC, bracketing the times that the tornado, linked to the image above, shows very strong upper-level difluence (consider how the cirrus shield spreads south in the hour of the animation!); one might infer cyclonic motion in the fields as well.
SIFT allows for the identification of regions that can then be investigated. The toggle below shows a polygon that has been defined. Subsequent plots will focus on this region surrounding the storm tops associated with the tornadic storm.
How do the cloud-top brightness temperatures evolve in that region? One way to describe that is a simple bar-graph showing the distribution of temperatures, shown below. There are three distinct cold temperature events: around 2130 UTC, around 2138 UTC, around 2148 UTC. (Recall the tornado is on the ground fron 2129-2156) The time-scale of the changes is such that only 1-minute imagery will be able to capture it accurately.
How do the lightning observations evolve in the storm? SIFT will display many different GLM parameters: Average and Minimum Flash Areas, Total Energy, Group (and Flash) Extent and Centroid Densities, Group and Flash Areas. Some are displayed below, again within the confines of the polygon defined above. The first plot compares Average Flash Area (along a constant x axis) and Total Optical Energy (along a varying y axis). The distribution in the plot seems to change during the time when the tornado is on the ground.
SIFT also allows direct comparisons between ABI and GLM data, as shown below: Flash Extent Density is compared to Band 13 (10.3 µm) brightness temperatures at discrete times within the tornado’s lifecycle.
For more information on SIFT, including download instructions for linux, MacOS and Windows, refer to the SIFT website.
View only this post Read Less

