Heavy rainfall and flooding associated with Tropical Cyclone Seroja
![MIMIC Total Precipitable Water product [click to play animation | MP4]](https://cimss.ssec.wisc.edu/satellite-blog/images/2021/04/210403_210404_mimicTPW_anim.gif)
MIMIC Total Precipitable Water product [click to play animation | MP4]
At Kupang’s El Tari Airport, precipitation amounts included 547 mm (21.5 inches) during the 48 hours ending at 00 UTC on 05 April — with the heaviest amounts of 106 mm (4.2 inches) in 6 hours and 80 mm (3.1 inches) in 3 hours occurring during the 00-06 UTC period on 04 April when the pressure was falling as Cyclone Seroja began to slowly organize and intensify (below). Flash flooding affected much of the island, with multiple deaths being reported.
![Time series plot of surface observations at El Tari Airport, Kupang [click to enlarge]](https://cimss.ssec.wisc.edu/satellite-blog/images/2021/04/210404_WATT_SFCMG.GIF)
Time series plot of surface observations at El Tari Airport, Kupang, Indonesia [click to enlarge]
![JMA Himawari-8 “Clean” Infrared Window (10.4 µm) images [click to play animation | MP4]](https://cimss.ssec.wisc.edu/satellite-blog/images/2021/04/210404_himawari8_infrared_TS_Seroja_anim.gif)
JMA Himawari-8 “Clean” Infrared Window (10.4 µm) images [click to play animation | MP4]
![NOAA-20 VIIRS Infrared Window (11.45 µm) image at 0550 UTC on 04 April [click to enlarge]](https://cimss.ssec.wisc.edu/satellite-blog/images/2021/04/210404_05utc_n20_ir_zoom.png)
NOAA-20 VIIRS Infrared Window (11.45 µm) image at 0550 UTC on 04 April [click to enlarge]
CMORPH estimates of 7-day precipitation (available in RealEarth) over the region show 300-400 mm over West Timor, and values exceeding 700 mm (!!) over the adjacent ocean.
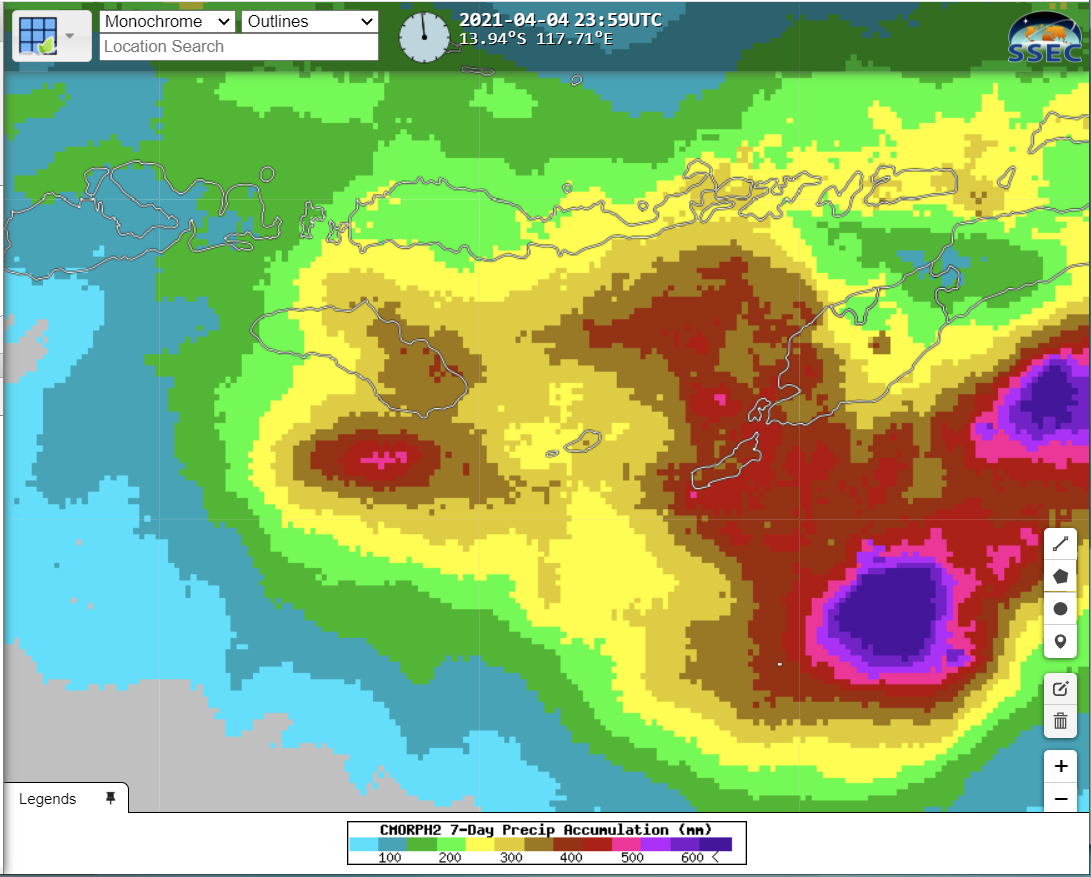
7-day CMORPH accumulation of precipitation ending 0000 UTC 5 April 2021 (Click to enlarge)