
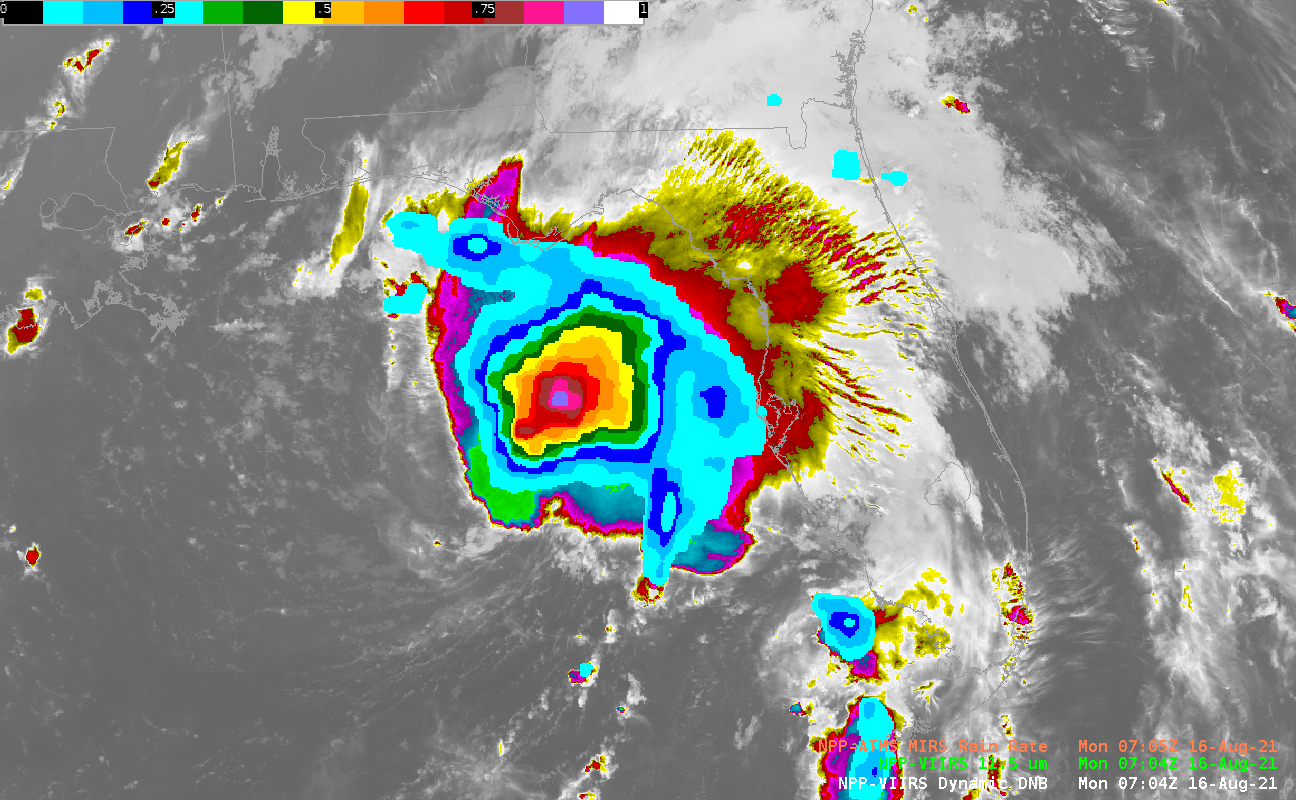
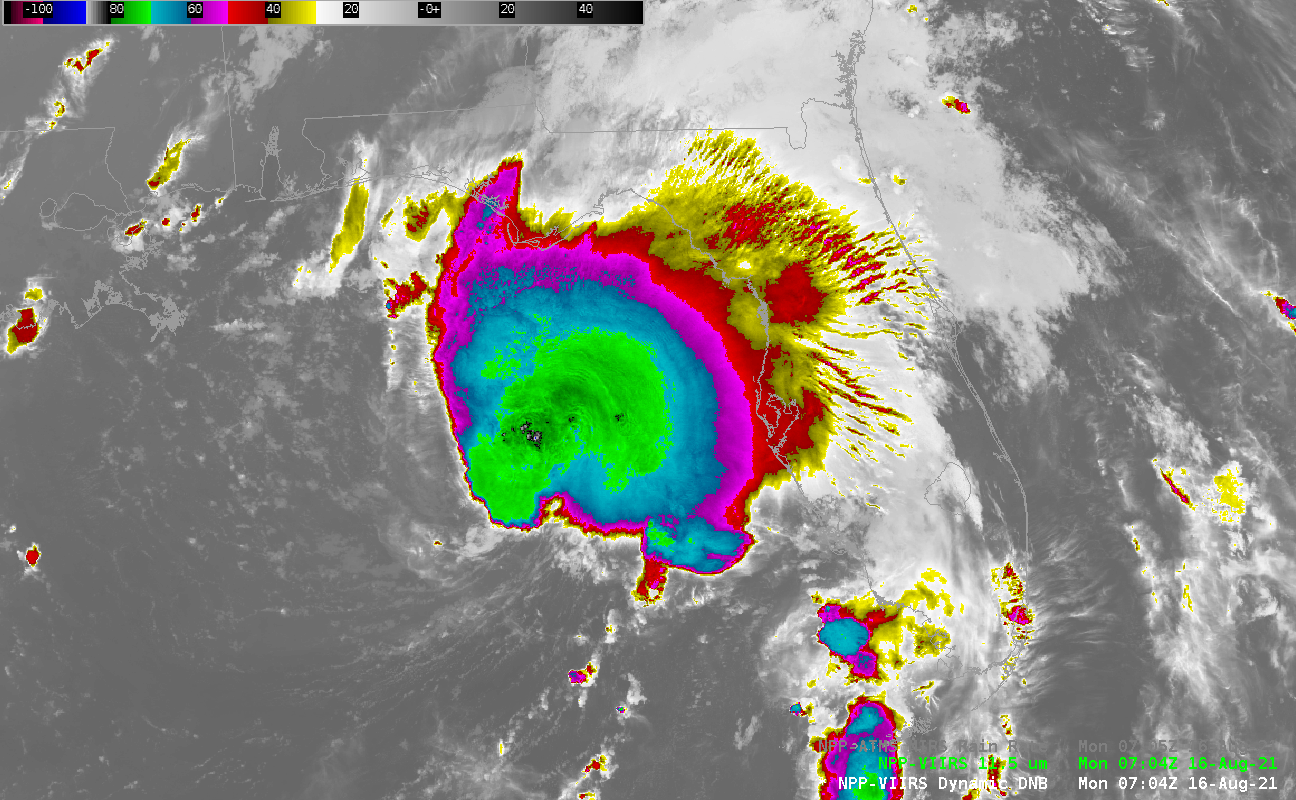
GOES-16 “Cirrus” channel (1.38 µm) imagery, above, and visible (0.64 µm ), below, shows Tropical Storm Henri to the southeast of the island of Bermuda (at 32.3º N, 64.7º W) shortly after sunrise on 17 August 2021. The cirrus channel shows a compact region of convection and an expanding cirrus shield. Visible imagery, below (click here for the animation in CSPP Geosphere), at a higher resolution (and zoomed in) also shows persistent convection near the center of the storm (according to NHC at 1500 UTC: 30.4º N, 64.3º W). The curvature of the low-level clouds in the visible imagery, below, give some hint to where the surface center is, near the western edge of the convection. (Those low-level clouds are not visible in the ‘Cirrus’ channel animation above because water vapor is absorbing reflected solar radiation at 1.38 µm and the signal from the low clouds is lost).
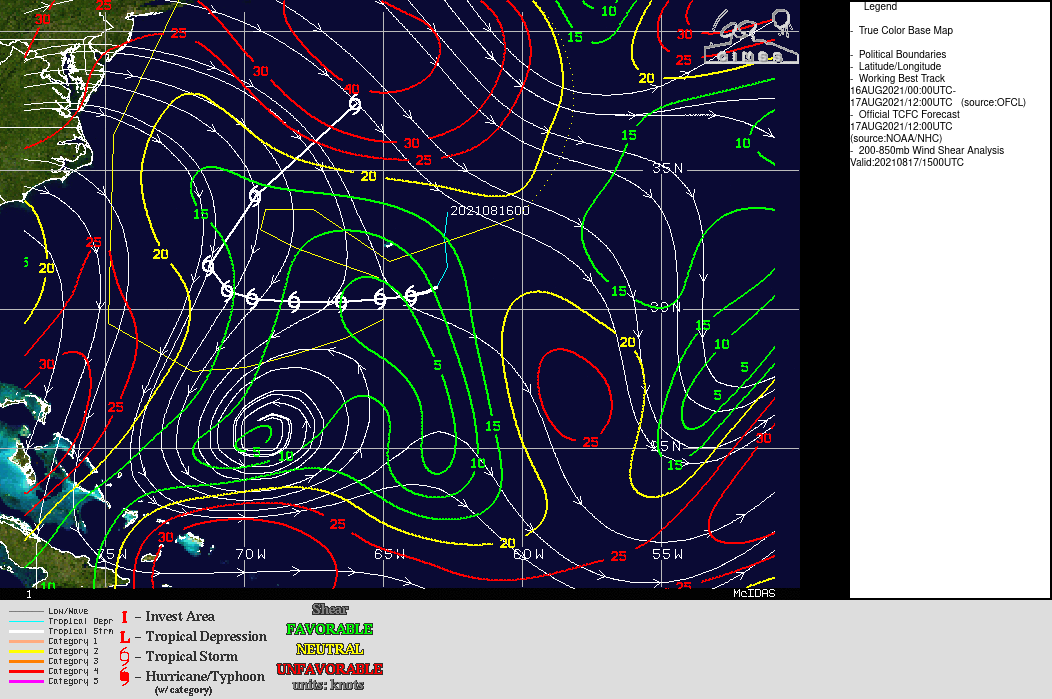
An analysis of shear at 1500 UTC on 17 August (here, from the CIMSS Tropical site) shows modest northerly shear over the storm.
For more information on Henri, refer to the National Hurricane Center. Current forecasts keep the storm offshore, although swells from the storm could affect beaches along the eastern seaboard of the USA.
View only this post Read Less


