This website works best with a newer web browser such as Chrome, Firefox, Safari or Microsoft
Edge. Internet Explorer is not supported by this website.
A large amount of Saharan Dust has been blowing off of the African continent for the past several days. The dust is moving to higher latitudes reaching as far north as southern Ireland. These strong dust events heavily affect air quality in the Canary Islands and a yellow alert is... Read More
A large amount of Saharan Dust has been blowing off of the African continent for the past several days. The dust is moving to higher latitudes reaching as far north as southern Ireland. These strong dust events heavily affect air quality in the Canary Islands and a yellow alert is still in effect in the archipelago. The event is known locally in the Canaries as “La Calima.” The dust is predicted to continue moving toward northwest Europe.
Daytime true color images of the dust transport are shown for 1/16, 1/17, and 1/18 from 0900 UTC to 1800 UTC. These true-color images were taken from RealEarth, a free data visualization web tool.
GOES-16 data on 1/16/22 from 0900 to 1800 UTC showing daytime true color imagery.GOES-16 data on 1/17/22 from 0900 to 1800 UTC showing daytime true color imagery.GOES-16 data on 1/18/22 from 0900 to 1800 UTC showing daytime true color imagery.
The GOES-16 Dust RGB product shows plumes of dust (magenta) still coming off the coast of west Africa and thick clouds (orange) associated with plumes farther north.
GOES-16 Dust RGB product on 1/18/22 from 1920 to 2110 UTC.
JMA Himawari-8 True Color RGB images created using Geo2Grid (above) showed the rapid expansion of a volcanic cloud following an explosive eruption of Hunga Tonga–Hunga Ha`apai on 15 January 2022. An abrupt shock wave was also evident, which propagated radially outward in all directions.The volcanic cloud also exhibited a striking appearance in... Read More
JMA Himawari-8 True Color RGB images [click to play animated GIF | MP4]
JMA Himawari-8 True Color RGB images created using Geo2Grid(above) showed the rapid expansion of a volcanic cloud following an explosive eruption of Hunga Tonga–Hunga Ha`apai on 15 January 2022. An abrupt shock wave was also evident, which propagated radially outward in all directions.
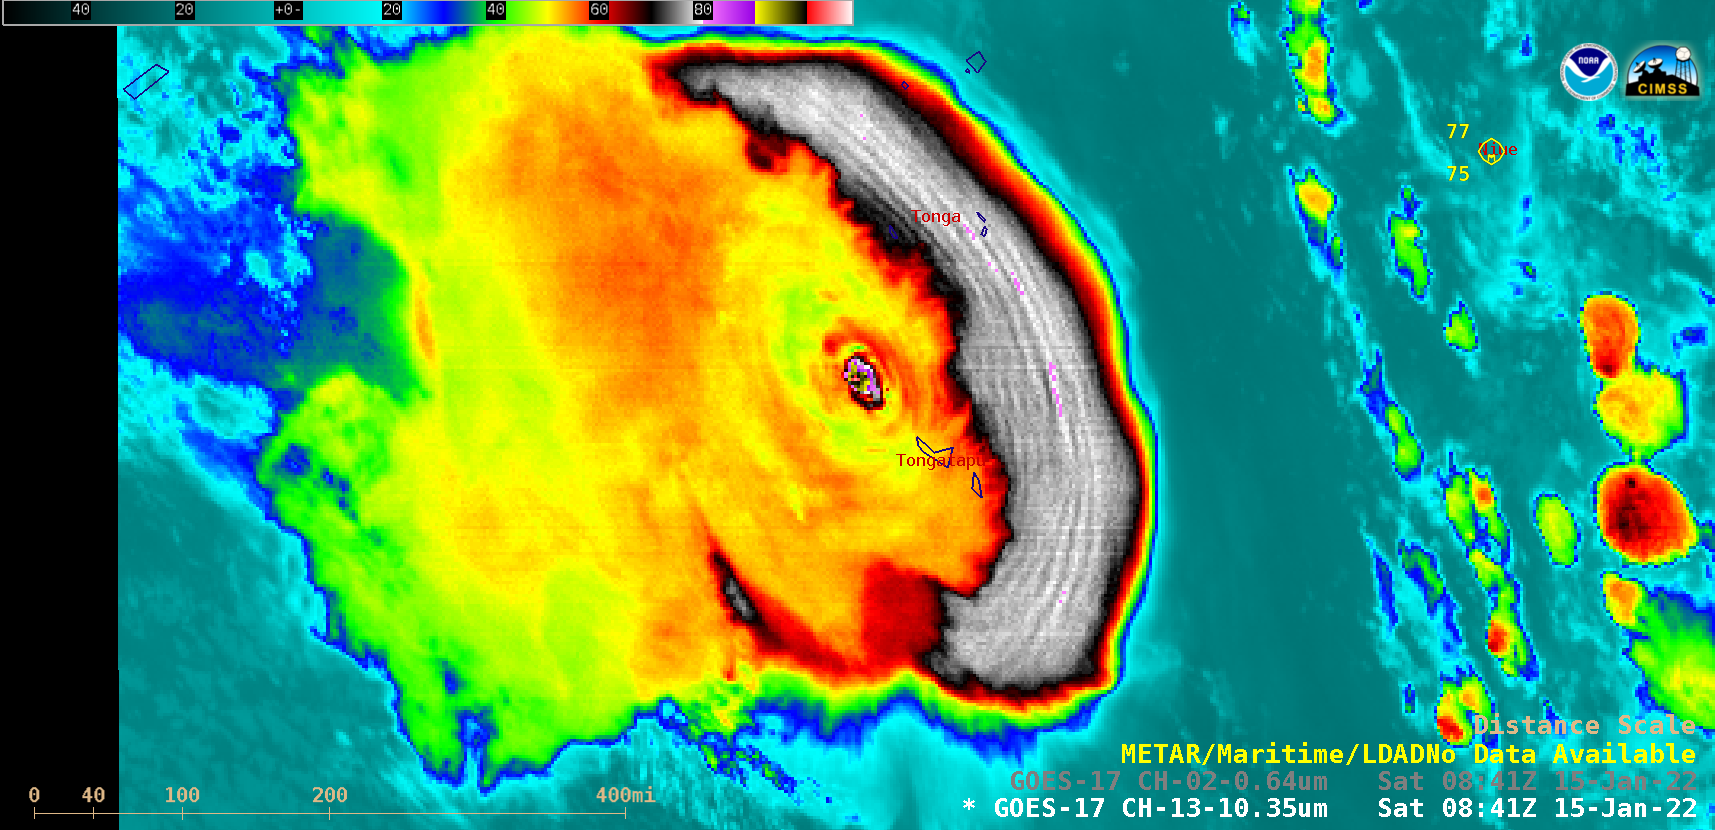
The volcanic cloud also exhibited a striking appearance in GOES-17 (GOES-West) “Clean” Infrared Window (10.35 µm) images (below), with a pronounced arc of cloud-top gravity waves along its eastern edge as the bulk of the cloud material drifted westward. Pulsing concentric shock waves were also seen in the infrared imagery.
GOES-17 “Clean” Infrared Window (10.35 µm) images (credit: Tim Schmit, NOAA/NESDIS/ASPB) [click to play animated GIF | MP4]
The explosive nature of the eruption could be seen by examining 10-minute GOES-17 Visible and Infrared images during the first 30 minutes (below) — only 20 minutes after the 0400 UTC eruption onset, the infrared cloud-top brightness temperature had already cooled to -100ºC (placing it in the lower stratosphere).
GOES-17 “Red” Visible (0.64 µm, left) and “Clean” Infrared Window (10.35 µm, right) images [click to play animated GIF | MP4]
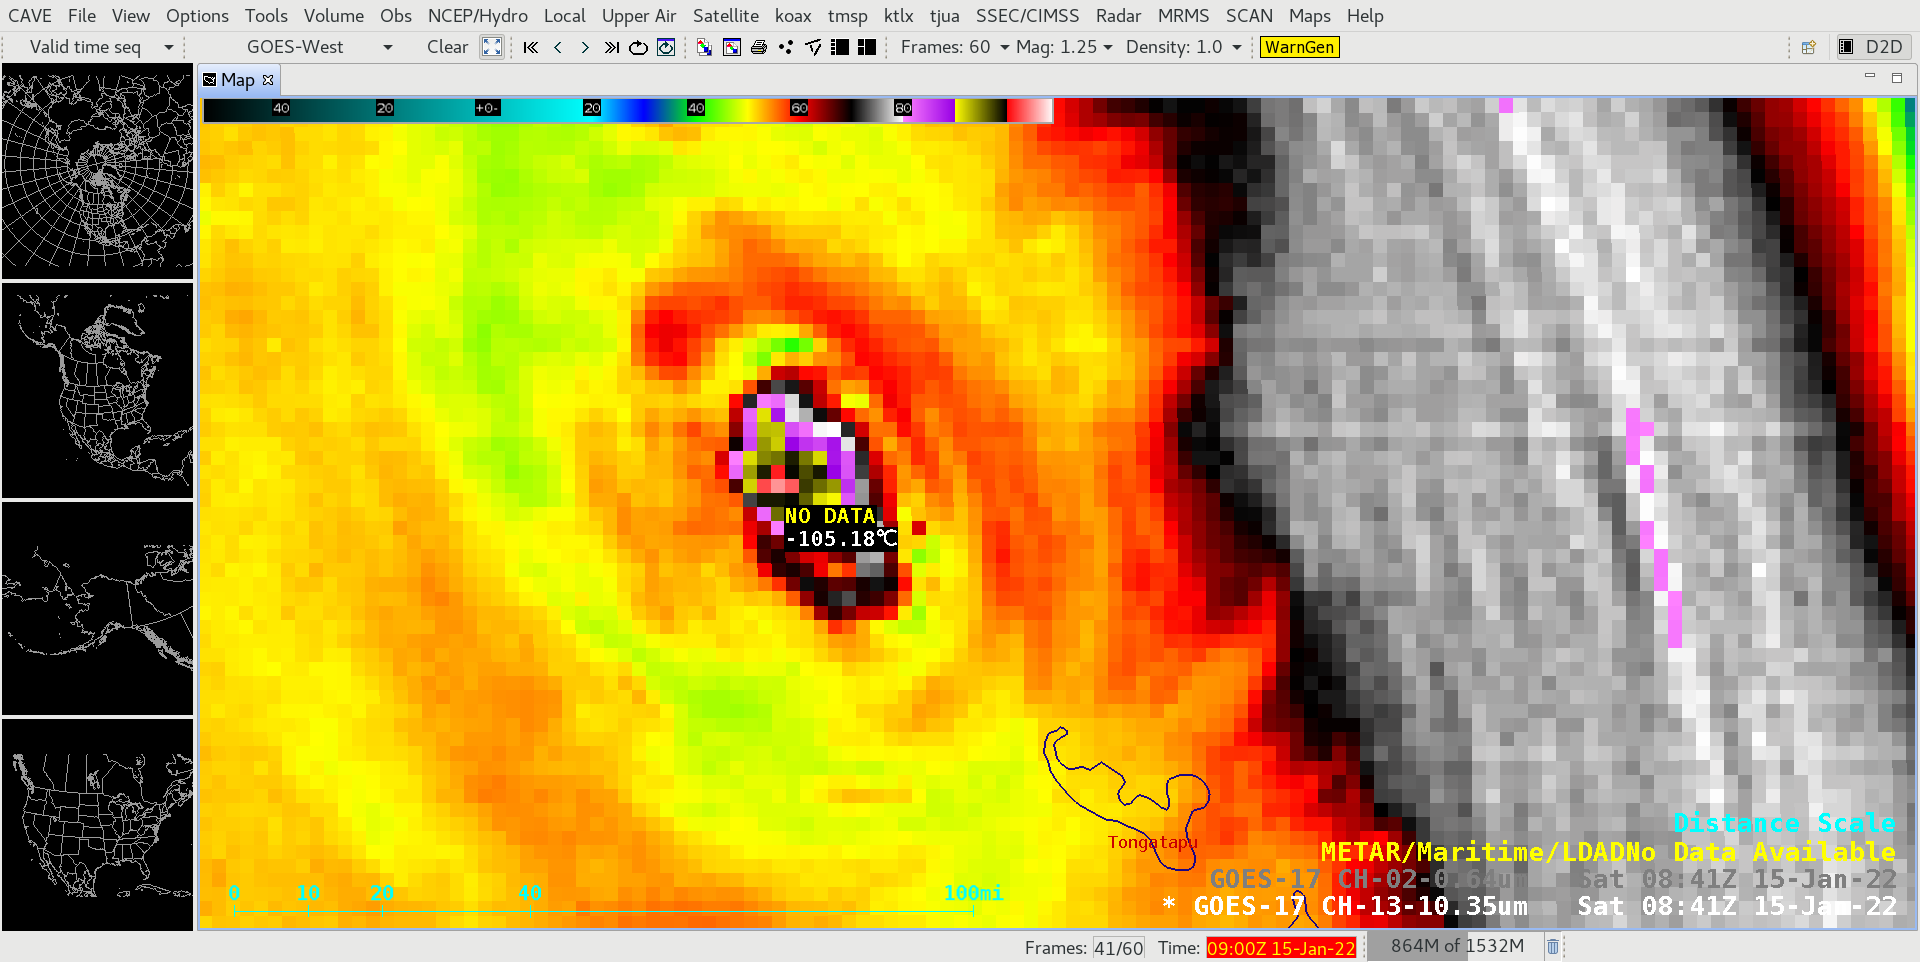
Beginning at 0705 UTC, a GOES-17 Mesoscale Domain Sector was positioned over the region, providing imagery at 1-minute intervals — Infrared images during the period 0705-1200 UTC are shown below. The crescent-shaped area of “bow shock wave” ripples persisted, due to the robust and dense volcanic cloud acting as an obstacle to the easterly winds within the stratosphere. The 1-minute imaging was also able to capture the brief pulse of an overshooting top which exhibited an infrared brightness temperature of -105.18ºC at 0841 UTC (zoomed-in animation: GIF | MP4) — which could be a record cold cloud-top temperature, as sensed from a geostationary satellite (see this blog post).
GOES-17 “Clean” Infrared Window (10.35 µm) images [click to play animated GIF | MP4]
A plot of 1-minute GOES-17 overshooting top infrared brightness temperatures (IRBTs) along with 10-minute Full Disk GOES-17 and Himawari-8 IRBTs (below) showed that the brief cold 0841 UTC overshooting top (and its rapid collapse) occurred between the times of routine 10-minute Full Disk scans — highlighting the value of rapid scan 1-minute imagery.
Plot of 1-minute GOES-17 overshooting top infrared brightness temperatures (IRBTs), along with 10-minute Full Disk GOES-17 and Himawari-8 IRBTs [click to enlarge]
VIIRS Infrared Window (11.45 µm) images from NOAA-20 and Suomi-NPP, viewed using RealEarth(below), also showed the region of cloud-top gravity waves (with minimal parallax compared to GOES-17) .
VIIRS Infrared Window (11.45 µm) images from NOAA-20 and Suomi-NPP [click to enlarge]
Plot of 00 UTC rawinsonde data from Nandi, Fuji [click to enlarge]
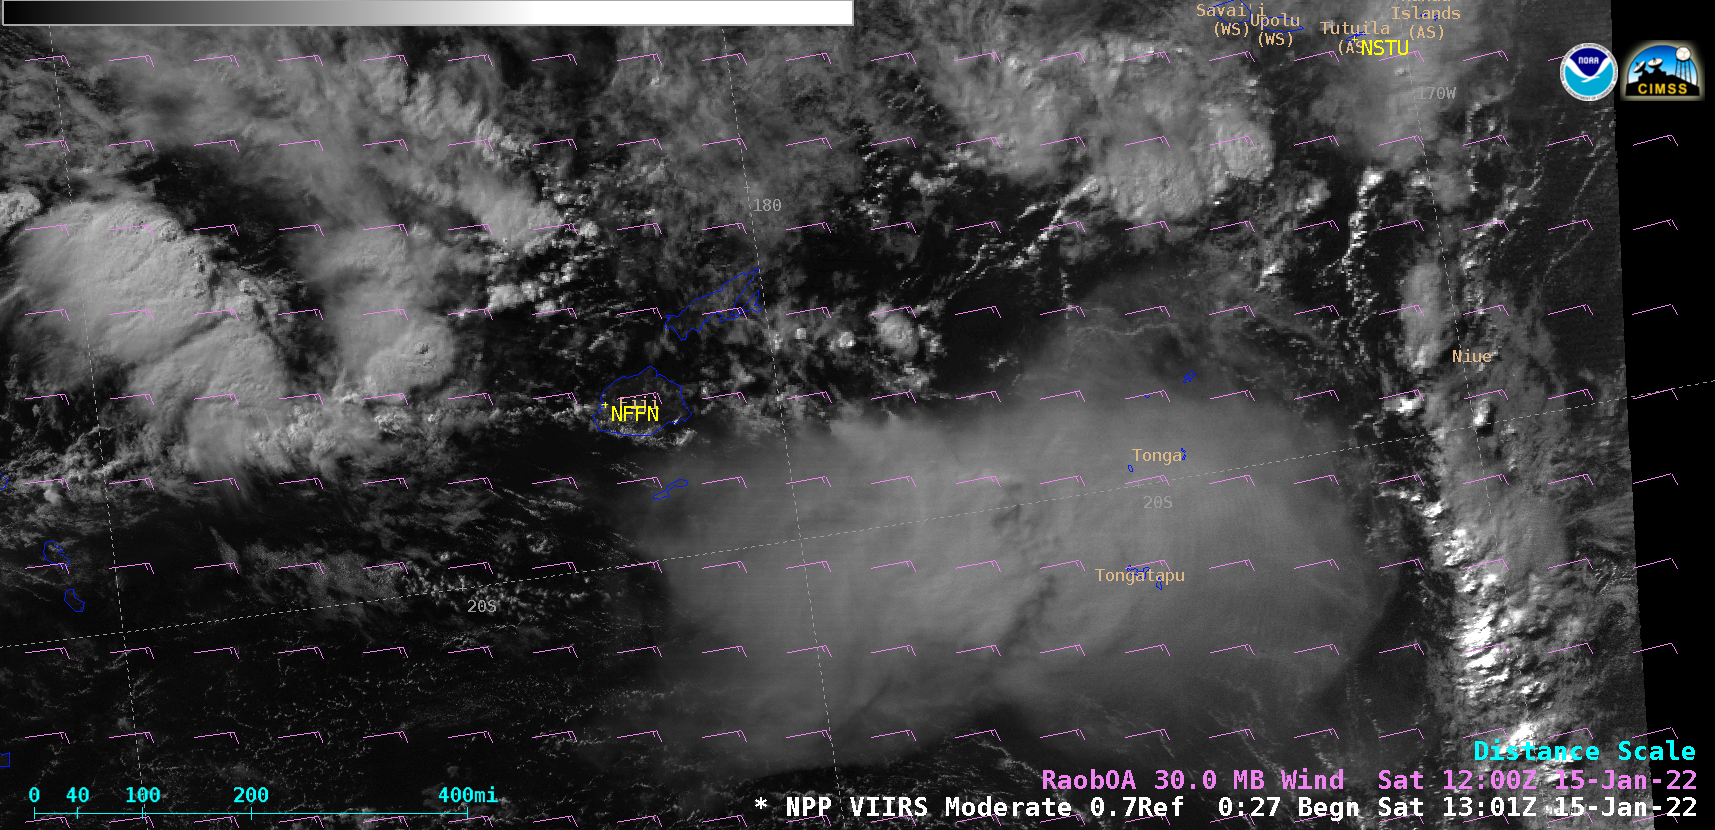
Satellite-based lidar and limb sounder data indicated that the volcanic cloud reached maximum altitudes around 30-32 km — well into the lower stratosphere, where easterly winds existed according to 00 UTC rawinsonde data from Nandi, Fiji (above). The westward drift of most of the volcanic cloud as seen in a Suomi-NPP VIIRS Day/Night Band (0.7 µm) image (below) lined up well with wind barbs at 30 hPa (an altitude of 23.78 km on the Nandi NFFN sounding).
Suomi-NPP VIIRS Day/Night Band (0.7 µm) image, with 30 hPa wind barbs plotted in violet and rawinsonde sites plotted in yellow [click to enlarge]
GOES-17 Mid-level Water Vapor (6.9 µm) Time Difference images (credit: Tim Schmit, NOAA/NESDIS/ASPB) [click to play animated GIF | MP4]
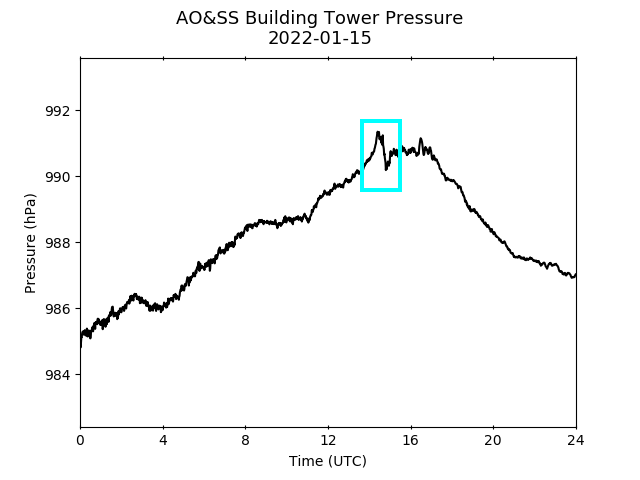
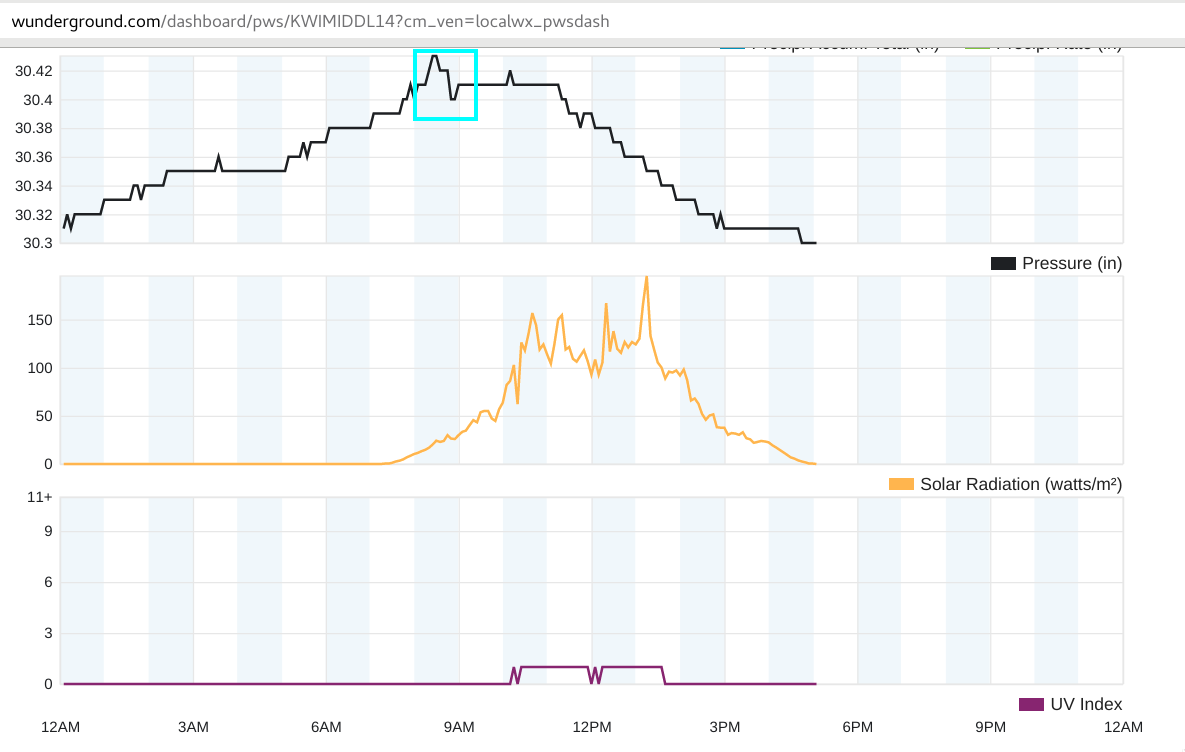
Propagation of the volcanic shock wave across the Pacific Ocean could be followed in GOES-17 (GOES-West) Mid-level Water Vapor (6.9 µm) Time Difference images (above). As the shock wave continued to propagate farther eastward across North/South America and then the Atlantic Ocean, the wave front could be seen in GOES-16 (GOES-East) Water Vapor Time Difference images (below). As the shock wave moved across southern Wisconsin, a brief rise/fall couplet in surface air pressure just prior to 1500 UTC (9:00 am CDT) was evident in plots from the University of Wisconsin – Madison’s Atmospheric, Oceanic and Space Sciences building rooftop tower (as well as the personal weather station of the author of this blog post).
GOES-16 Mid-level Water Vapor (6.9 µm) Time Difference images (credit: Tim Schmit, NOAA/NESDIS/ASPB) [click to play animated GIF | MP4]
Pseudo-color visible view of the wave front from the #TongaVolcano
We've been looking into the Tonga eruption in more detail. Our latest data says that the main volcanic 'umbrella' reached 35km altitude – but some points (such as the image below) may have reached 55km altitude! Shocking altitudes that show just how violent this eruption was. https://t.co/AaL4td8MIbpic.twitter.com/55Im0Yvcub
CALIPSO observations from 16 Jan reveal stratospheric aerosols up to ~32 km, produced by the second eruption (on 04:10 UTC on 15 Jan). pic.twitter.com/U7njBp9UZu
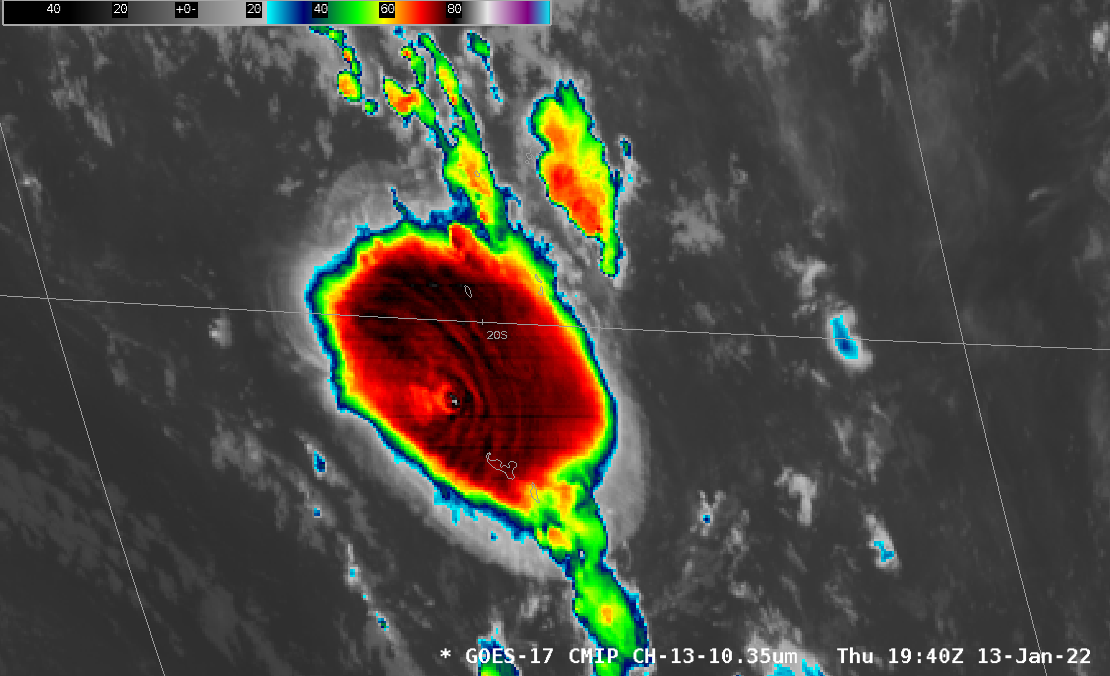
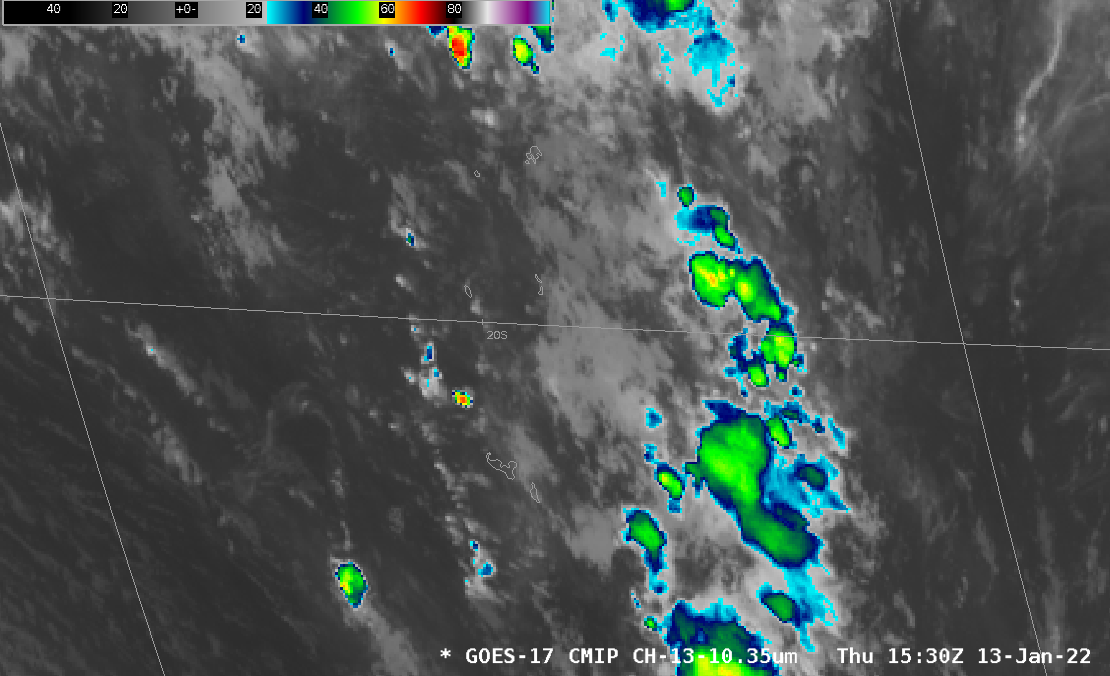
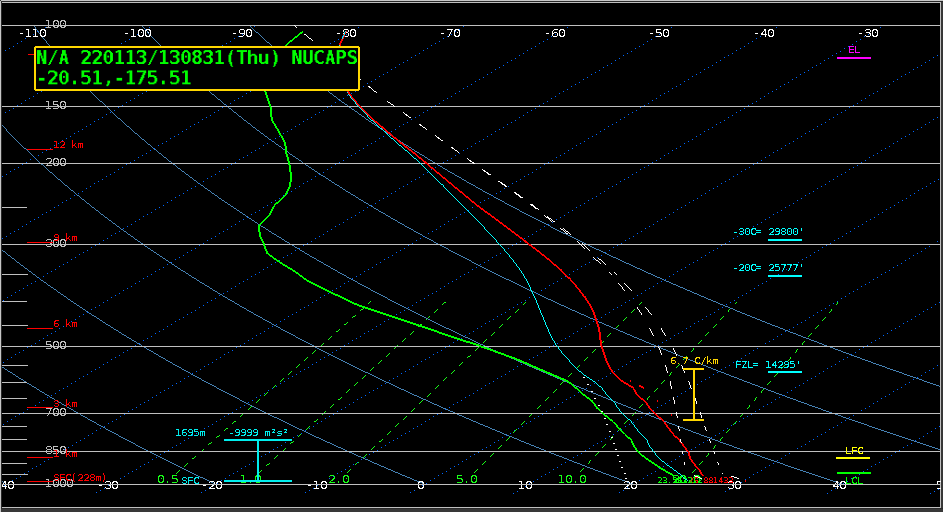
GOES-17 imagery revealed another explosive eruption of Hunga Tonga-Hunga Ha?apai in the south Pacific Ocean between 1500 and 1530 UTC on 13 January 2022; an eruption in December 2021 is discussed here. The brightness temperatures in this volcanic plume cooled from -9.4o to -66.7o between 1520 and 1530 UTC. This 1308 UTC NUCAPS profile from... Read More
GOES-17 imagery revealed another explosive eruption of Hunga Tonga-Hunga Ha?apai in the south Pacific Ocean between 1500 and 1530 UTC on 13 January 2022; an eruption in December 2021 is discussed here. The brightness temperatures in this volcanic plume cooled from -9.4o to -66.7o between 1520 and 1530 UTC. This 1308 UTC NUCAPS profile from 20.5oS / 175.5o W (the profile location is shown here) suggests the plume rose from 445 mb to 188 mb in those 10 minutes (or from 20 thousand to 39 thousand feet).
GOES-17 Clean Window*(see below) (Band 13, 10.3 µm) Infrared Imagery, 1500-1940 UTC on 13 January 2022 (Click to enlarge)
Imagery at 2100 UTC, below, shows the extent of the plume in the visible.
GOES-17 Visible (Band 2, 0.64 µm) Imagery, 2100 UTC on 13 January 2022 (Click to enlarge)
Computed Ash/Dust Cloud Heights, below, from 1510-1600 UTC on 13 January, available at the CIMSS Volcanic Cloud Monitoring Web Portal (link, search under the Wellington VAAC for Hunga Tonga), shows the rapid increase in height, to above 16 km, as well.
Retrieved Cloud Heights, 1510 – 1600 UTC on 13 January 2022 (Click to enlarge)
An animation of GOES-17 visible imagery, below, (courtesy Scott Bachmeier, CIMSS) shows the evolution of the pulsing eruption throughout the day on 13 January.
GOES-17 Visible (0.64 µm) imagery, 1700 UTC 13 January – 0010 UTC 14 January 2022 (Click to enlarge)
* You might notice that this AWIPS Full Disk imagery is at full resolution! In NWS Forecast Offices, full-disk imagery in AWIPS is degraded to 6-km resolution, meaning that interesting events outside of GOES-16 CONUS (or GOES-17 PACUS) that do not fall within a mesoscale sector can only be shown such that they’re zoomed out (as in this tweet from WFO Seattle about this event). The full-res imagery herein was created by inputting the full-resolution full-disk imagery (obtained at CIMSS from the GRB datastream) into AWIPS, replacing the subsected data.
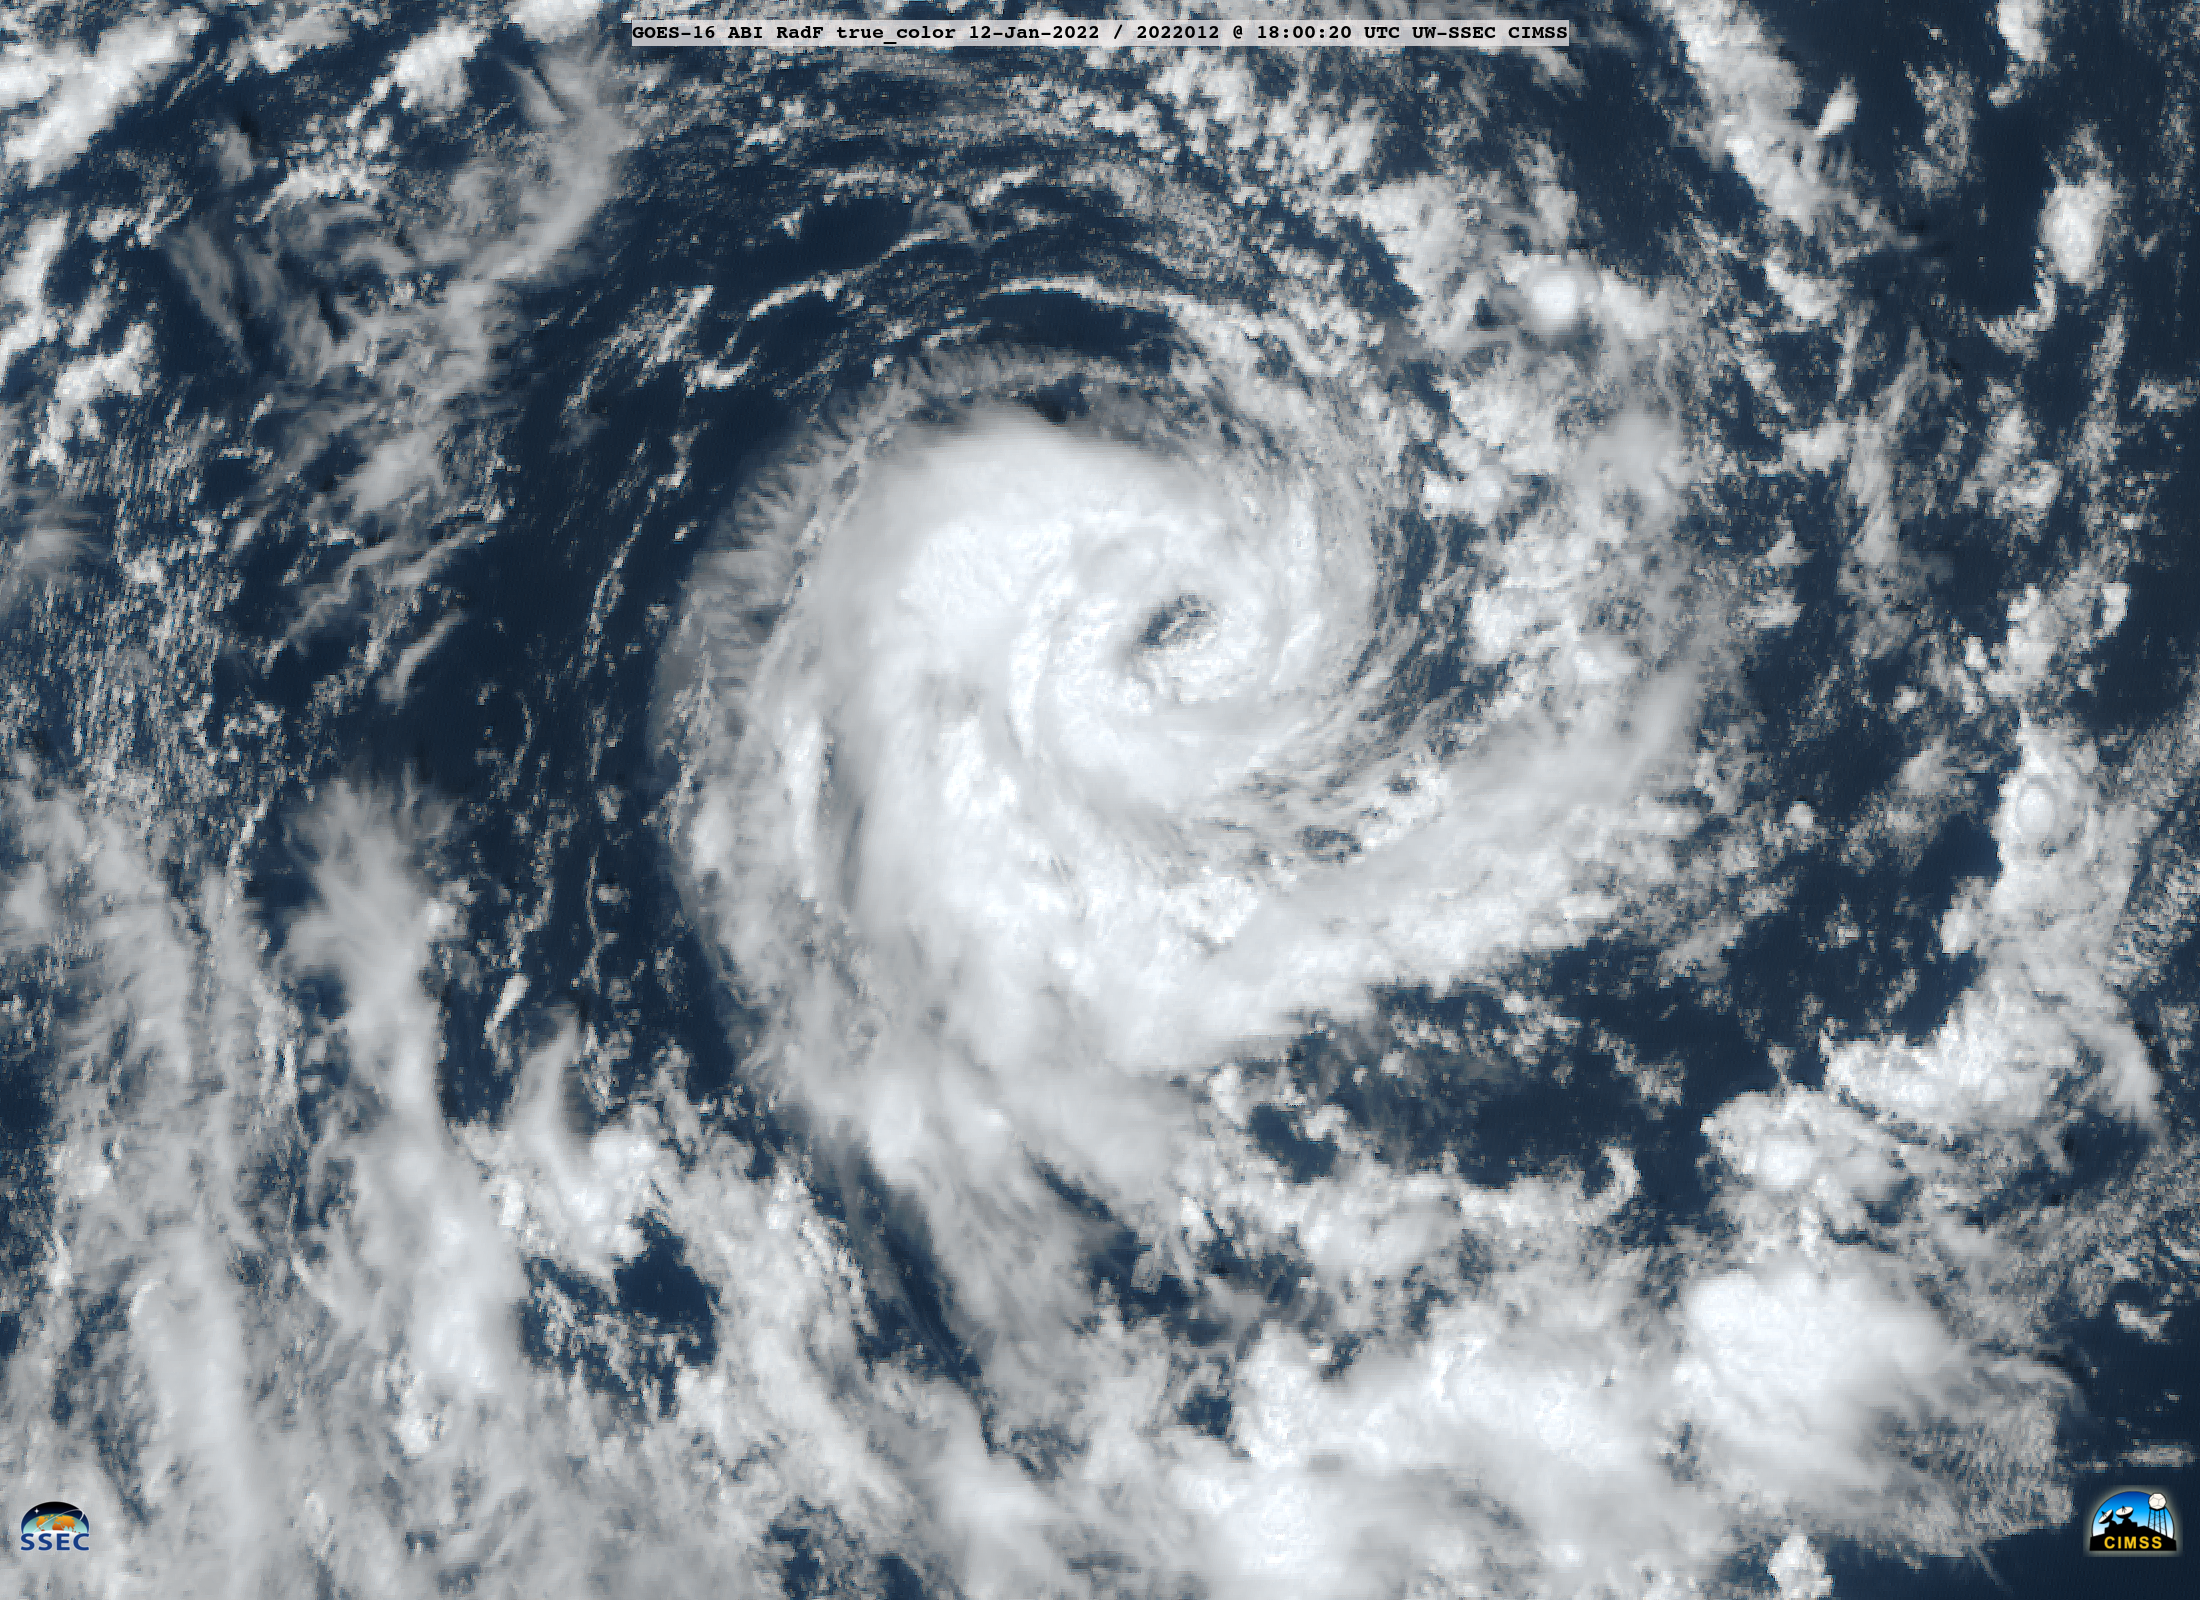
GOES-16 (GOES-East) True Color RGB images created using Geo2Grid (above) displayed the eye-like signature of a potential subtropical cyclone or “neutercane” over the Southeast Pacific Ocean on 12 January 2022. This type of mesoscale “hybrid” system has been observed near decaying cold fronts, or (as in this case) near the... Read More
GOES-16 True Color RGB images [click to play animated GIF | MP4]
GOES-16 (GOES-East) True Color RGB images created using Geo2Grid(above) displayed the eye-like signature of a potential subtropical cyclone or “neutercane” over the Southeast Pacific Ocean on 12 January 2022. This type of mesoscale “hybrid” system has been observed near decaying cold fronts, or (as in this case) near the centers of aged occluded extratropical cyclones.
VIIRS Infrared Window (11.45 µm) images from NOAA-20 and Suomi-NPP as viewed using RealEarth(below) showed that deep convection — exhibiting cloud-top brightness temperatures of -40°C and colder, shades of green) — existed around the immediate edge of of the small eye.
VIIRS Infrared Window (11.45 µm) images from NOAA-20 and Suomi-NPP [click to enlarge]
Surface analyses from the Chile Navy Weather Service(below) depicted the small occluded cyclone as it was moving southeastward off the coast of Chile.
Surface analysis at 12 UTC and 18 UTC [click to enlarge]


