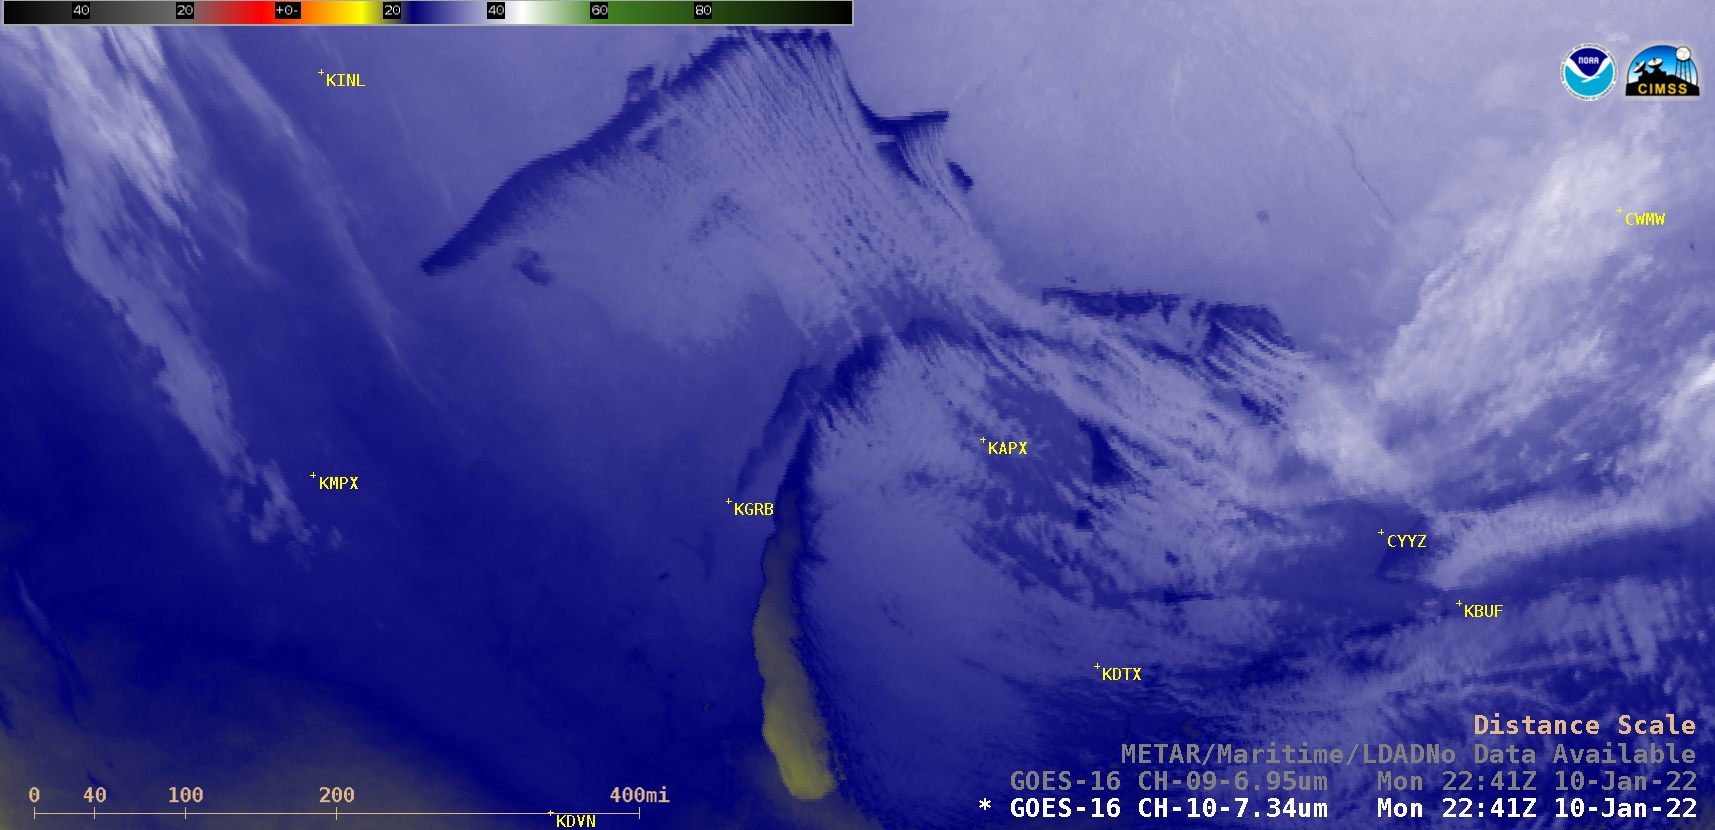

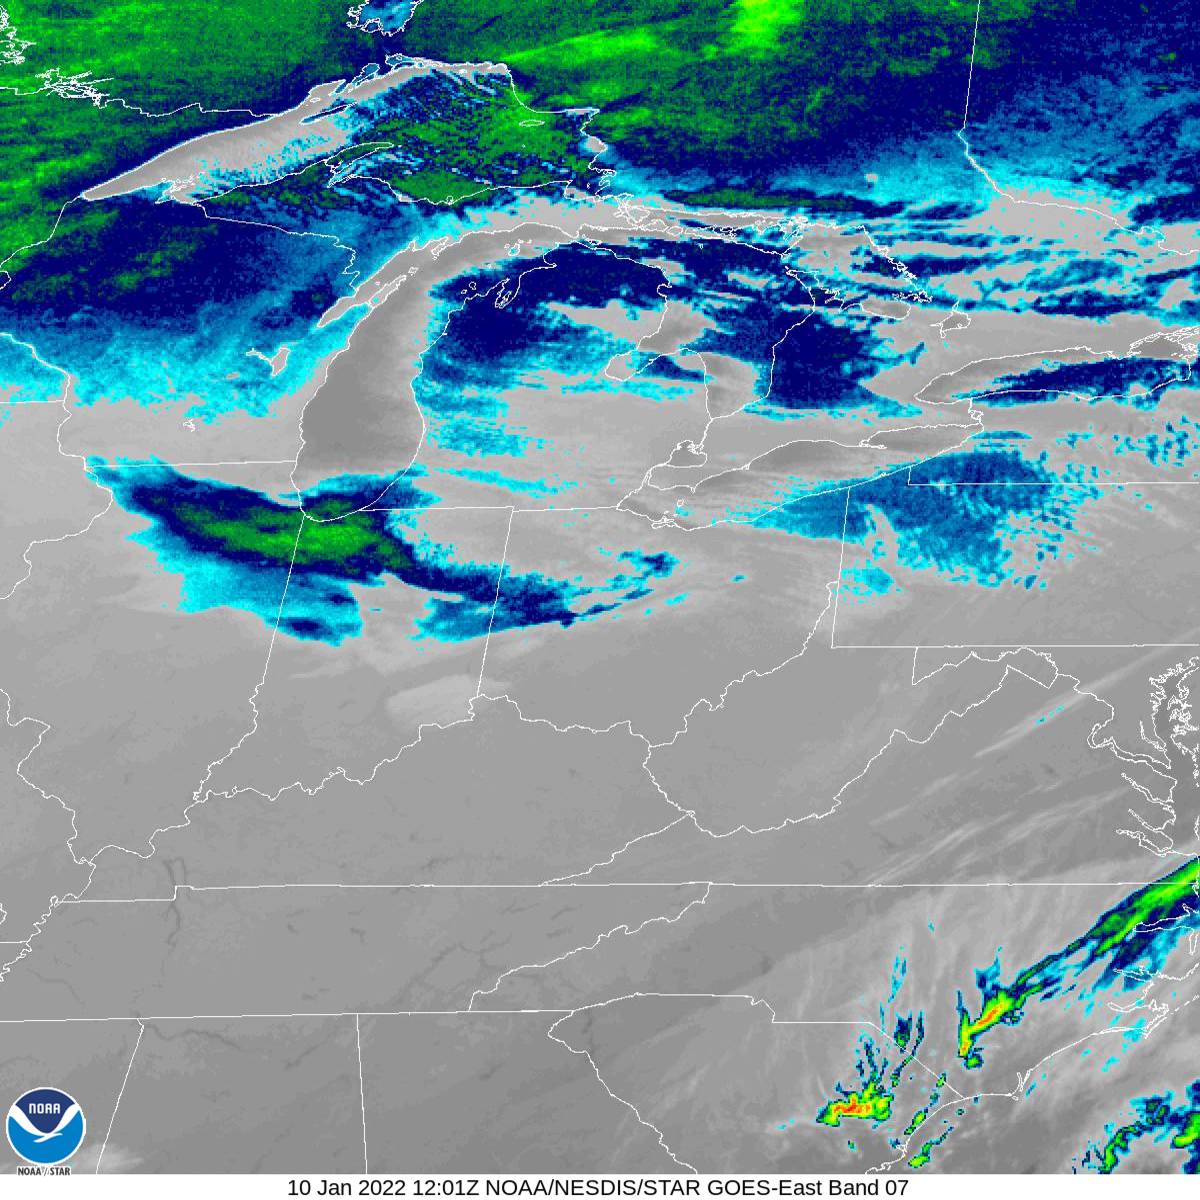
GOES-16 Low-level (7.3 µm) and Mid-level (6.9 µm) Water Vapor images, with and without map overlays [click to play animated GIF | MP4]
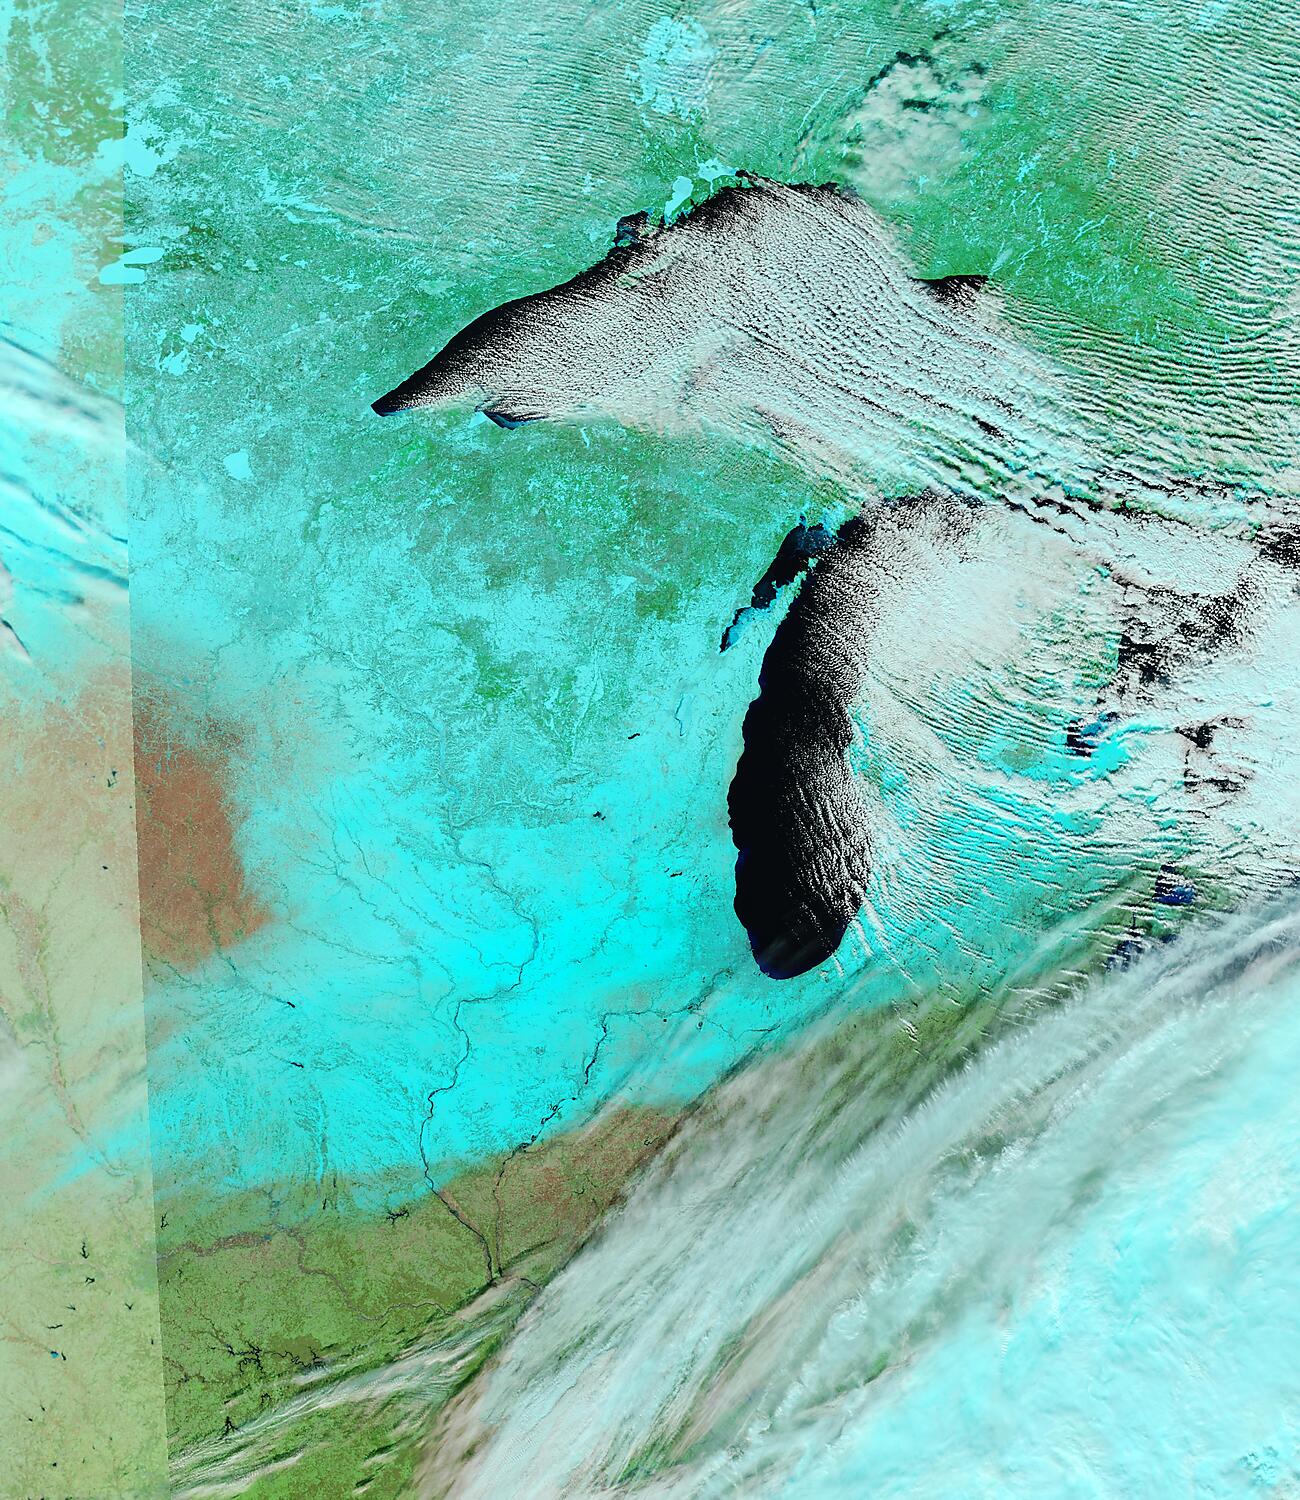
GOES-16 (GOES-East) Low-level (7.3 µm) and Mid-level (6.9 µm) Water Vapor images (above) showed that portions of the coastline of Lake Superior, Lake Michigan and Lake Huron were apparent during the day on 10 January 2022. When a very cold/dry arctic air mass is present over a particular area, the water vapor “weighting functions” are shifted to lower altitudes — which in this case allowed the strong thermal contrast between (1) the cold, snow-covered land surface across Minnesota, Wisconsin, Michigan and Ontario and (2) the warmer ice-free nearshore waters of the Great Lakes to be sensed by GOES Water Vapor spectral bands. The coldest surface air temperatures that morning across the region included -34ºF at Badoura MN, -27ºF at Grantsburg WI and -15ºF at Ironwood MI.
Plots of GOES-16 Low-level (7.3 µm) and Mid-level (6.9 µm) Water Vapor weighting functions (below) — calculated using 12 UTC rawinsonde data from Green Bay, Wisconsin (KGRB) — showed peak radiation contributions for the 7.3 µm and 6.9 µm spectral bands were at the 853 hPa and 730 hPa pressure levels, respectively, with some contribution coming directly from the surface. This example underscores the fact that “water vapor” spectral bands are essentially infrared bands — and with very little water vapor within the atmospheric column to absorb then re-radiate any upwelling energy (at its colder ambient temperature aloft), the signature of this land vs. water thermal contrast was able to reach the satellite sensors with minimal attenuation.

Plots of GOES-16 Low-level (7.3 µm) and Mid-level (6.9 µm) Water Vapor weighting functions at Green Bay WI [click to enlarge]
According to the Green Bay WI rawinsonde Total Precipitable Water (TPW) climatology (source), the TPW value of 0.04 inch at 12 UTC on 10 January was very close to the record low value (0.03 inch) for that date/time (below).
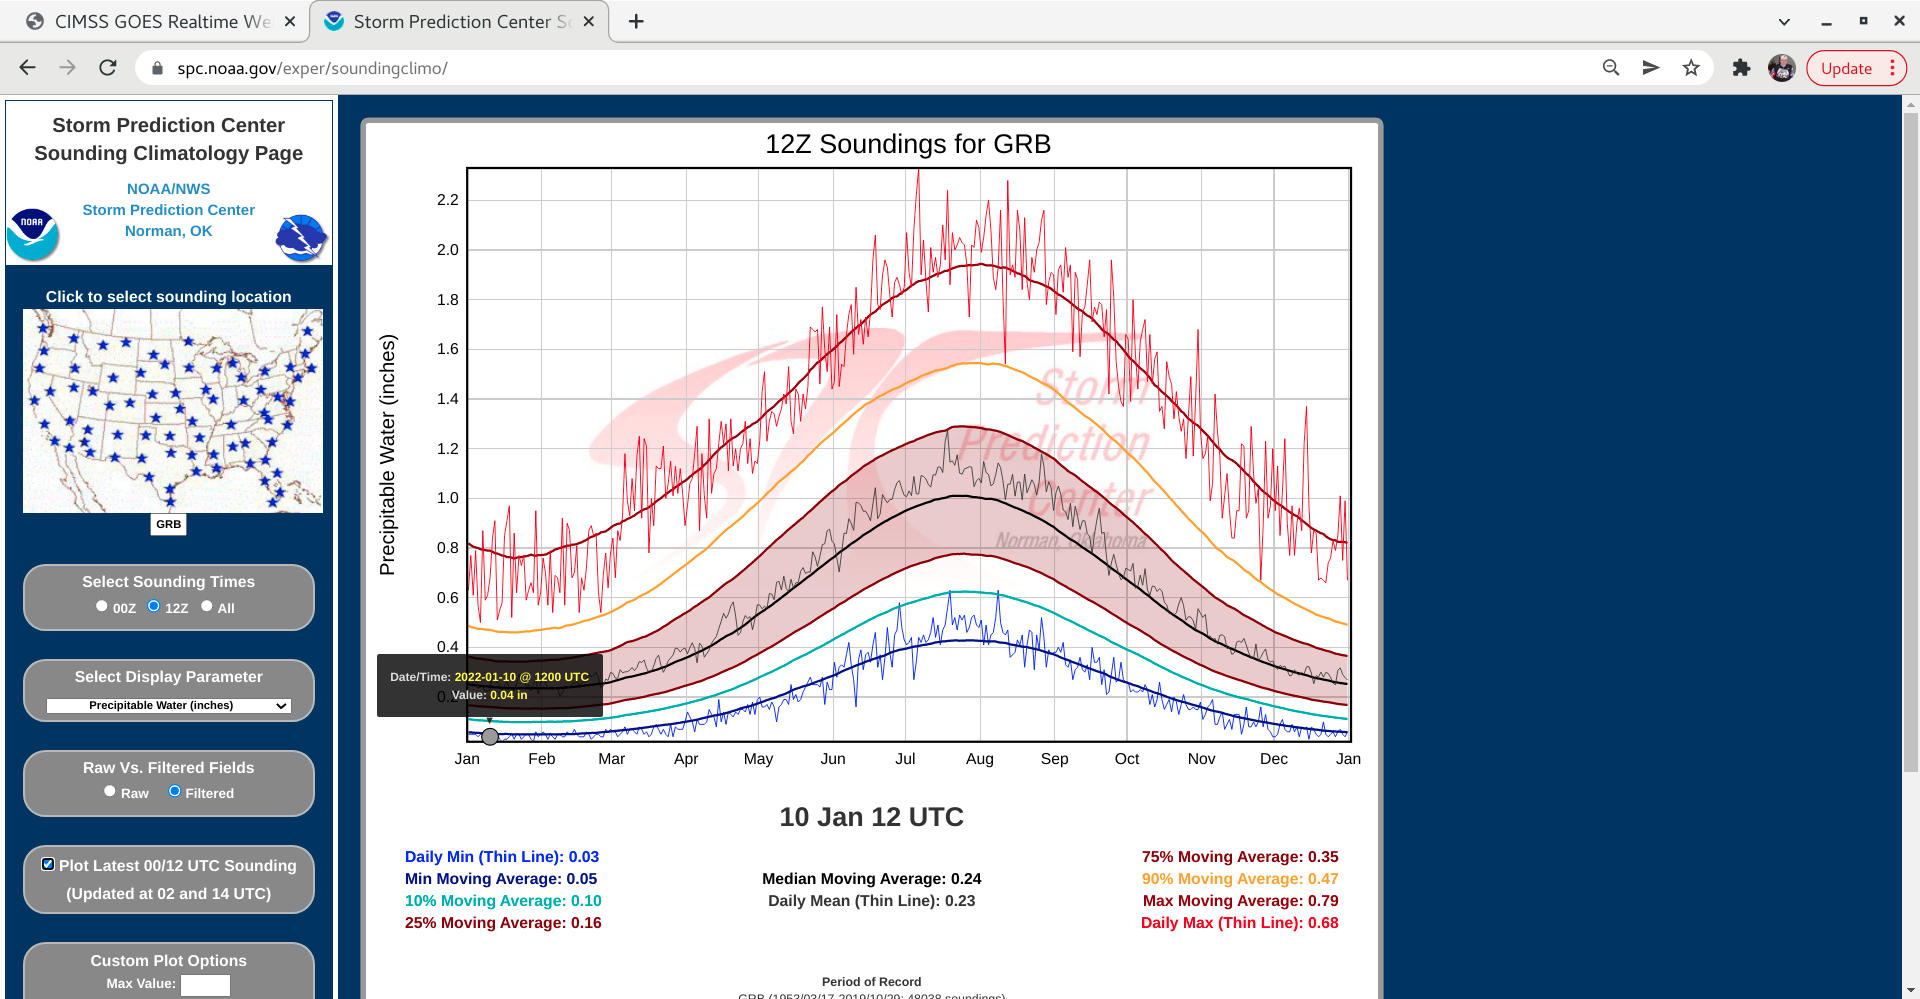
Green Bay WI rawinsonde Total Precipitable Water climatology [click to enlarge]
Other examples of GOES water vapor imagery sensing the surface in a cold/dry air mass: Feb 2020 | Jan 2019 | Dec 2019.
View only this post Read Less


