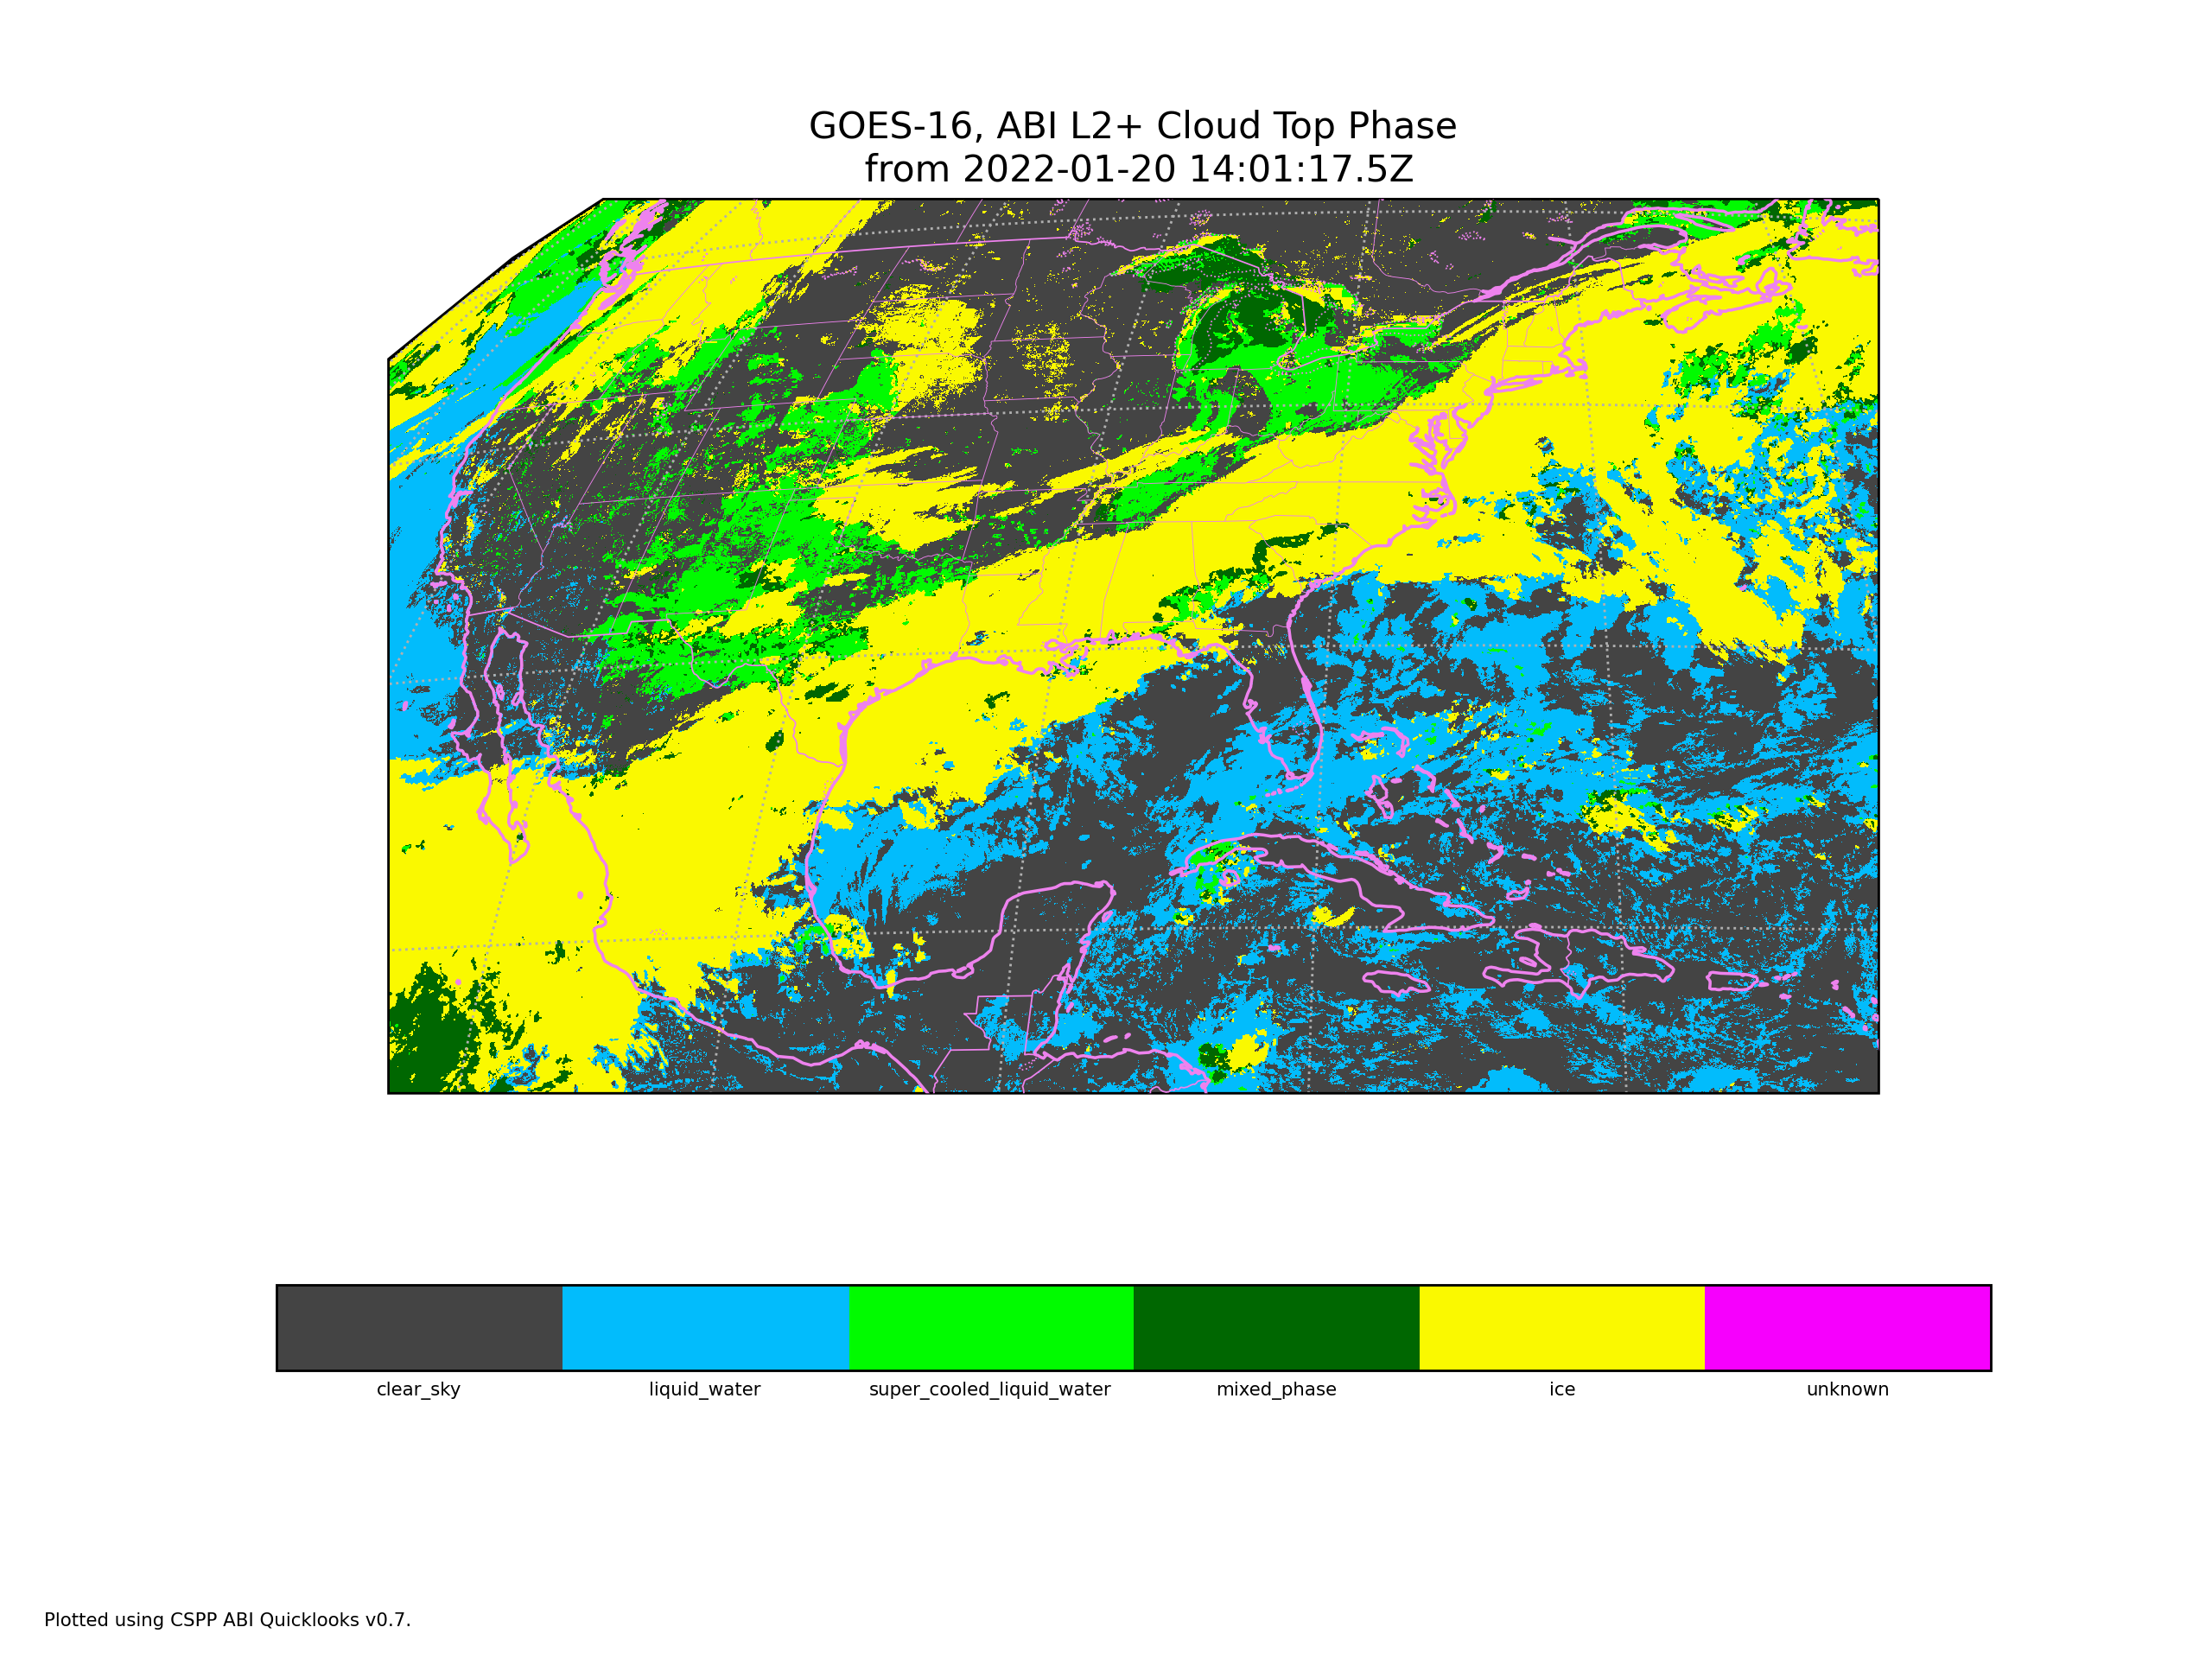
The Community Satellite Processing Package (CSPP) Algorithm Integration Team (AIT) has released a new version of processing software that creates (using updated Enterprise algorithms) Level 2 GOES-R products from radiance products. It also includes processing to provide Quick Look imagery for those products; that is, if you have the processed Level 2 product files, you can display them. One example is shown above, Cloud Top Phase from 1401 UTC on 20 January 2022.
The processing package is available here (a quick easy registration may be required): Look for “AIT Framework V2.0beta4 Software for Linux” and download the gzipped tar file. Note also that documentation is also available (link). Per that documentation, I downloaded the software into a directory that I changed directories to, and I put that directory at the front of my unix PATH, i.e., export PATH=”$PWD:$PATH”. Then I used the aitf-ql (“ql” for quick-look) command:
aitf-ql /path/to/directory/holding/L2products/ACTPC/*s20220201401*.nc --image_size 2560.0 1920. -o /home/scottl/
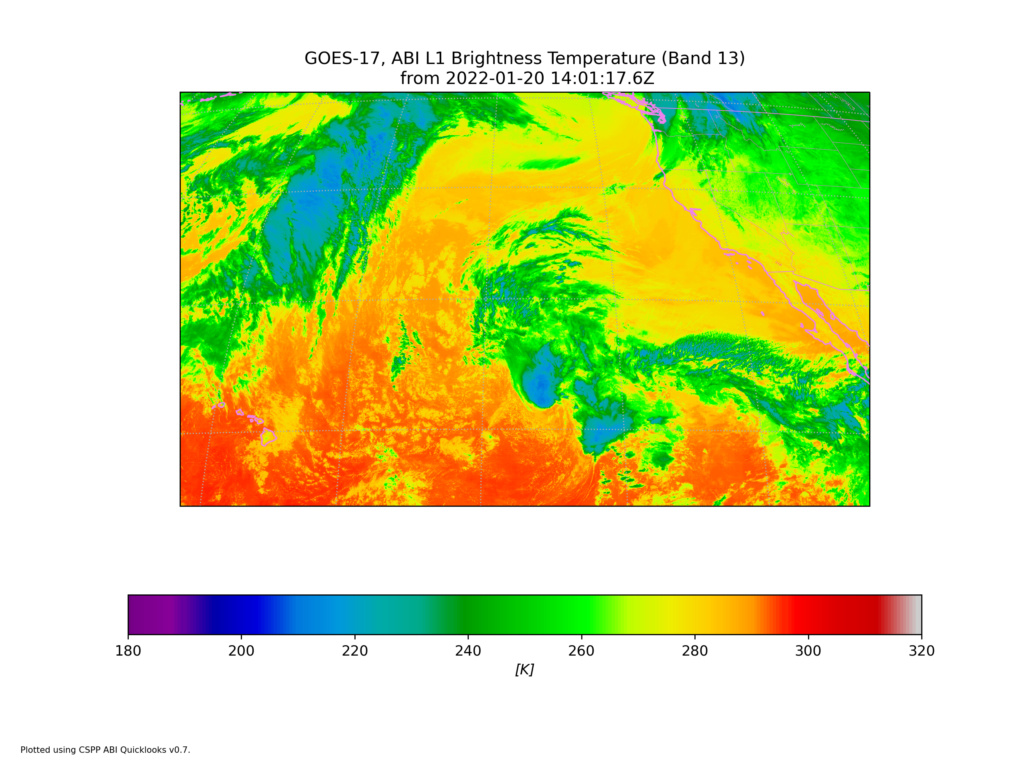
I have specified both the image size, and the output directory. If you have access to L2 imagery (in NOAA CLASS, for example), this is an easy way to view the imagery. Note that this software will also create QuickLooks from ABI radiance files, as the GOES-17 example below shows. You can create imagery for computed brightness temperature (Bands 7-16) or reflectance (Bands 1-6).
View only this post Read Less

