
GOES-16 “Red” Visible (0.64 µm) images [click to play animated GIF | MP4]
1-minute Mesoscale Domain Sector GOES-16 (GOES-East) “Red” Visible (0.64 µm) images (above) displayed mesovortices over southern Lake Michigan on 21 January 2022. The formation of these mesovortex features was aided by a mid-lake convergence of surface winds, which was suggested by RAP40 surface wind fields and shown n more detail by Metop-C ASCAT winds from this site (below).
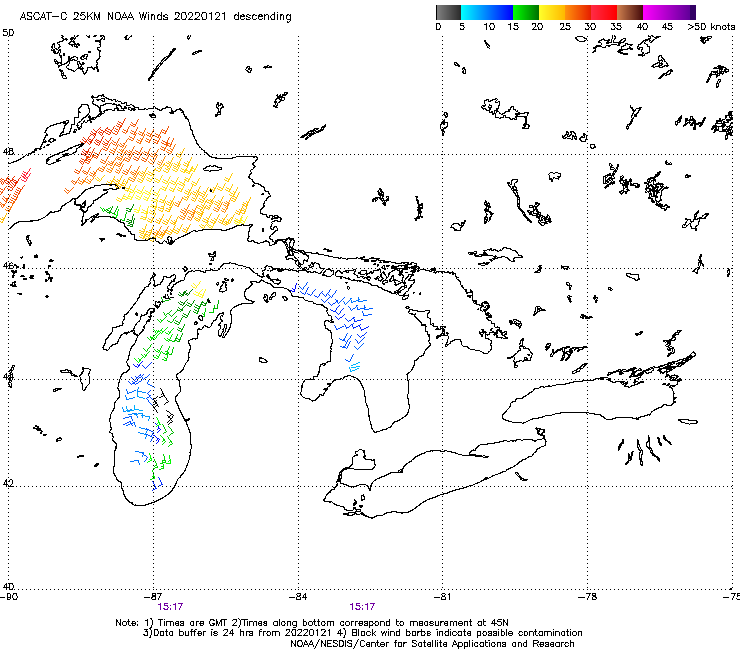
Metop-C ASCAT surface scatterometer winds [click to enlarge]
Farther to the north, in spite of a cold night across northeast Wisconsin and Upper Michigan — with morning low temperatures of -30ºF at Laona, Wisconsin and -39ºF at Amasa, Michigan — GOES-16 Visible images (below) showed that southerly winds helped to open an ice lead near the center of Green Bay, with a slow northward drift of pack ice in the northern half of the bay. A lone ice floe was also seen moving northward near the western edge of the clouds in Lake Michigan.
GOES-16 “Red” Visible (0.64 µm) images [click to play animated GIF |MP4]
A toggle between NOAA-20 VIIRS True Color and False Color RGB images (below) revealed a more detailed view of the ice structure — and also showed the narrow southwest-to-northeast oriented damage path that remained from a June 2007 EF-3 tornado that went through a portion of Menominee, Langlade and Oconto counties. The higher spatial resolution of the VIIRS imagery helped to highlight the aforementioned isolated ice floe in Lake Michigan (which appeared as cyan in the False Color RGB image).
NOAA-20 VIIRS True Color and False Color RGB images [click to enlarge]
To the east, mesovortices were also observed in Lake Huron – long with ice floes drifting away from the coast of Lower Michigan (below).
GOES-16 “Red” Visible (0.64 µm) images [click to play animated GIF | MP4]
A was the case in Lake Michigan, these Lake Huron mesovortices were forming along an axis of surface wind convergence, seen in Metop-B ASCAT data (below).
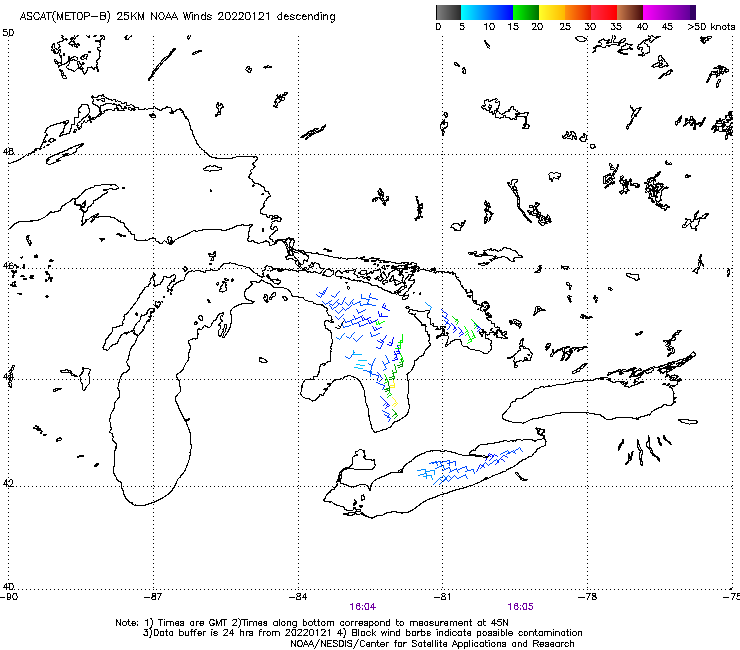
Metop-B ASCAT surface scatterometer winds [click to enlarge]
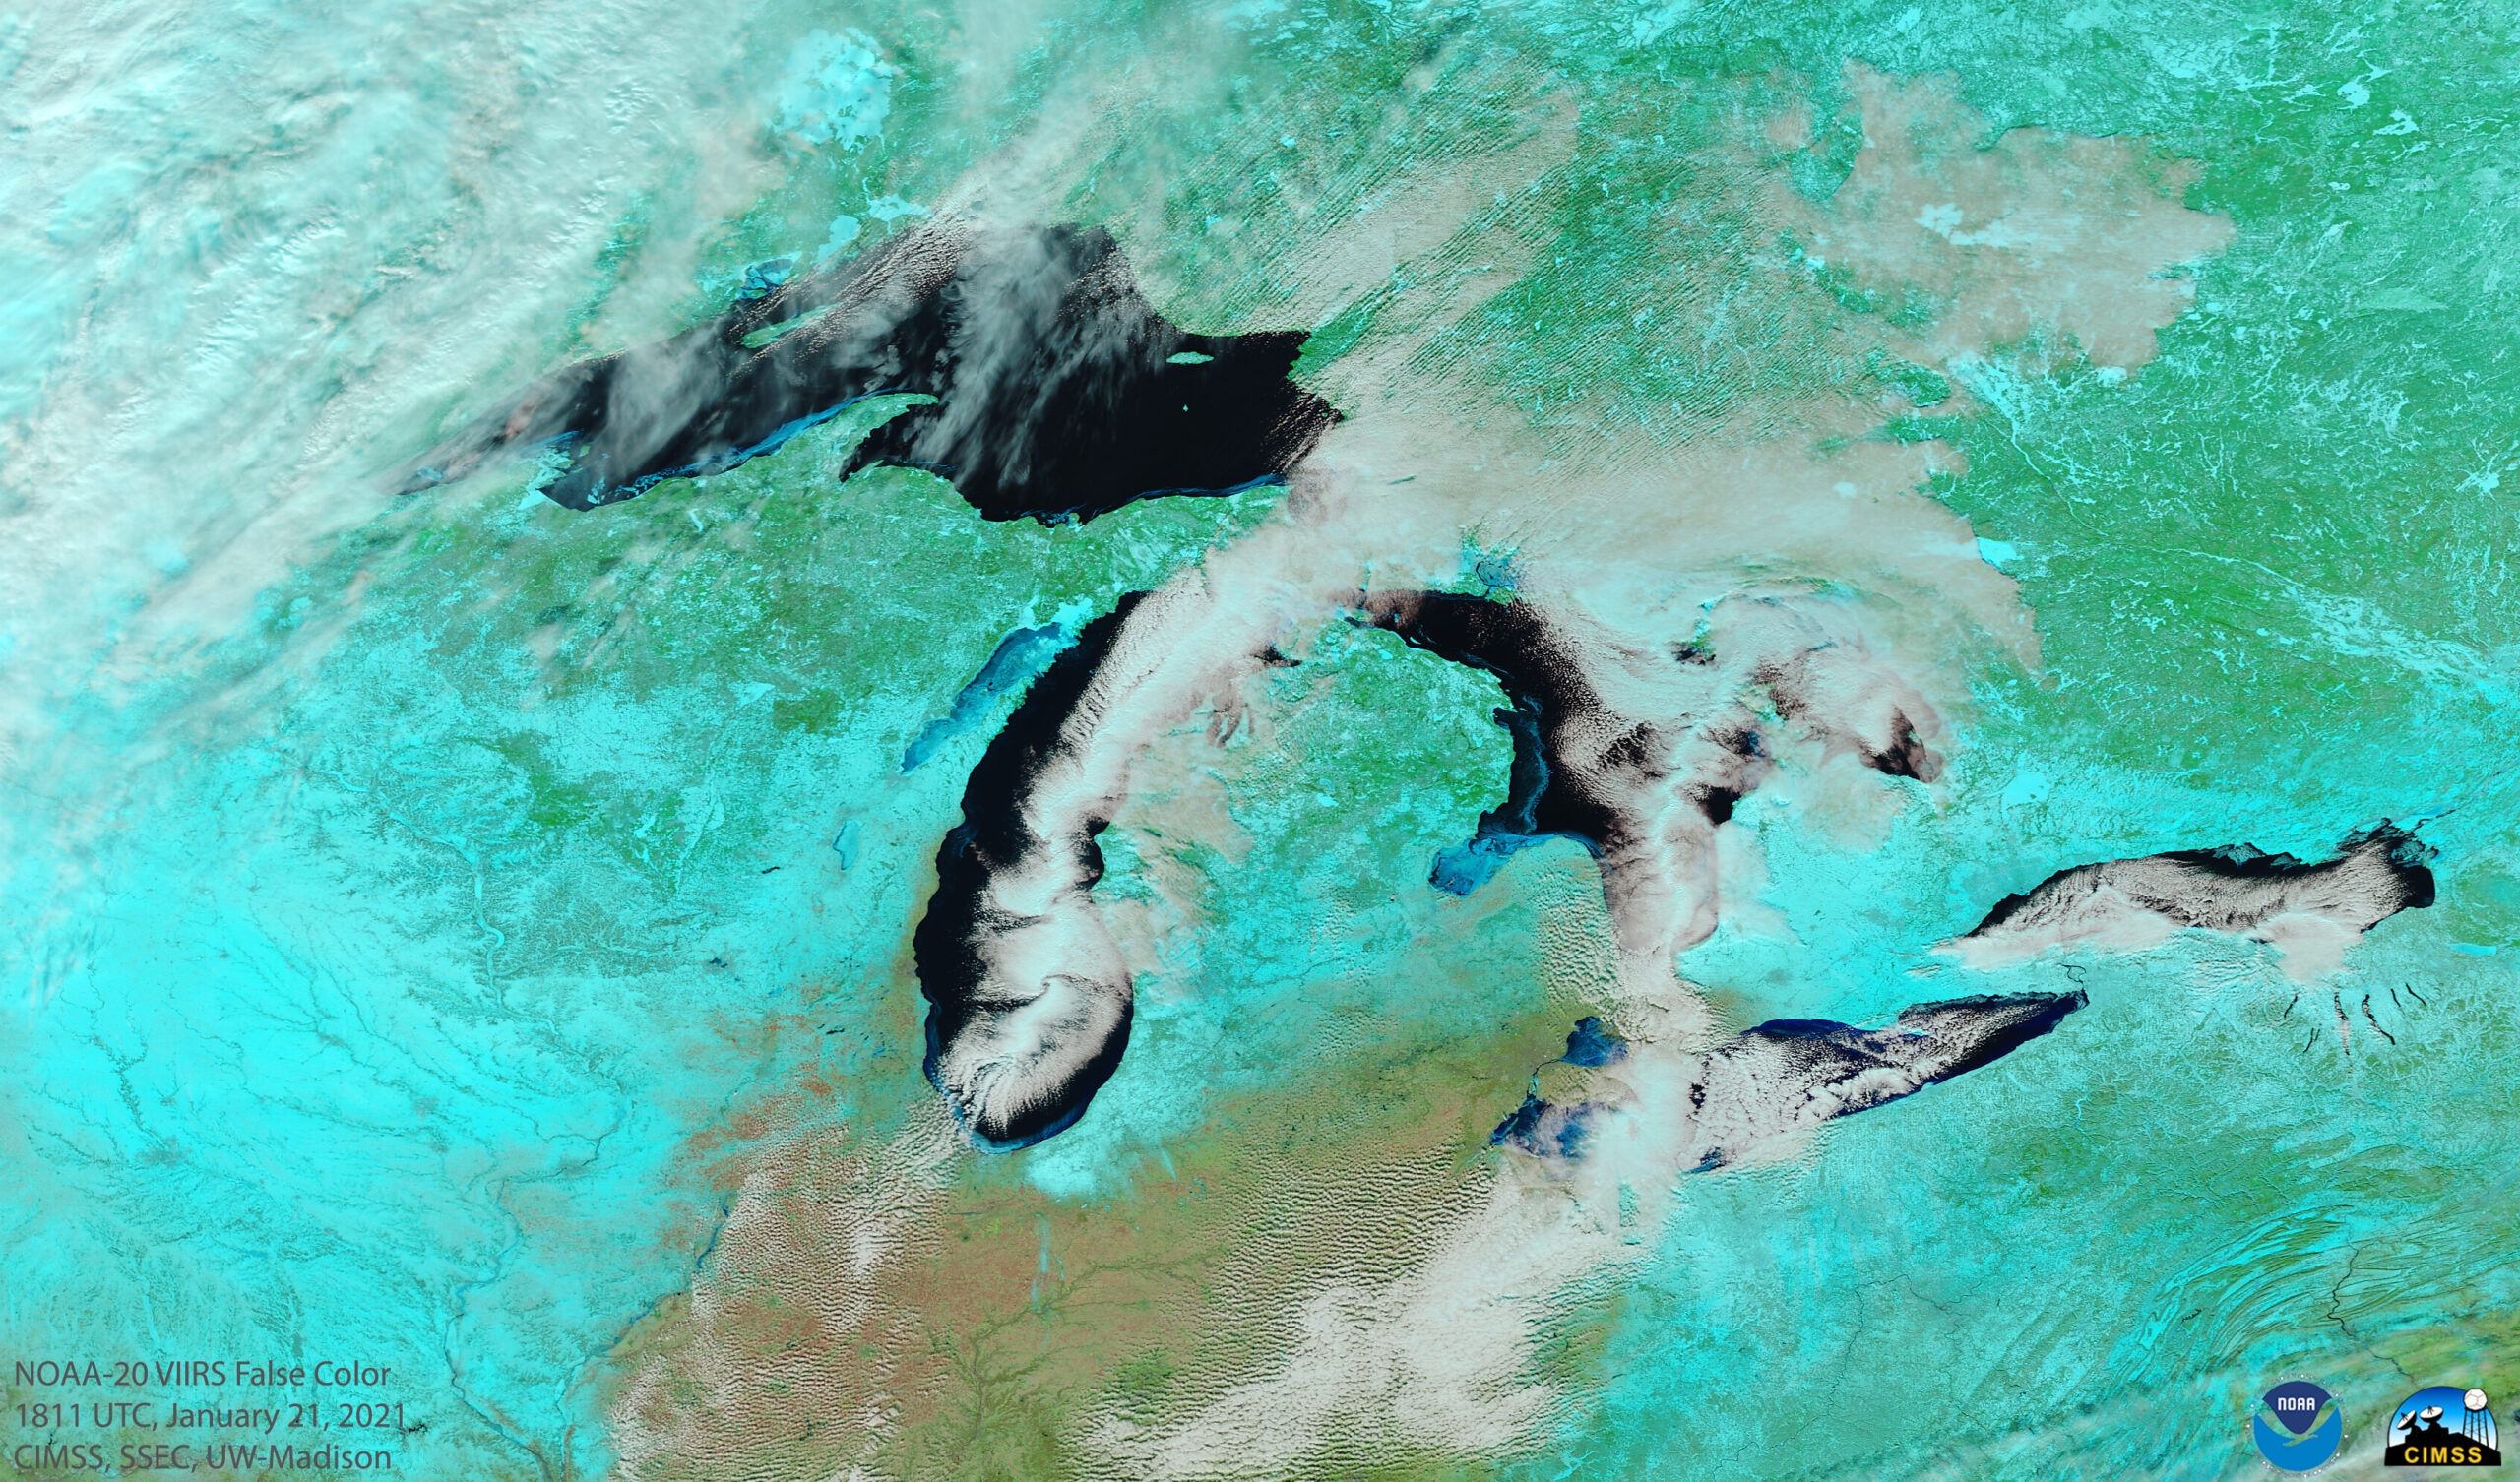
A larger-scale toggle between NOAA-20 VIIRS True Color and False Color RGB images — created using data received from the SSEC/CIMSS Direct Broadcast ground station — provided a view of the entire Great Lakes region (below).
NOAA-20 VIIRS True Color RGB and False Color RGB images (credit: Margaret Mooney, CIMSS) [click to play animation]
===== 23 January Update =====
GOES-16 “Red” Visible (0.64 µm) images [click to play animated GIF | MP4]
On 23 January, GOES-16 Visible images (above) showed that northwesterly winds were causing a few ice floes to drift eastward out of Green Bay and into Lake Michigan.
View only this post Read Less
