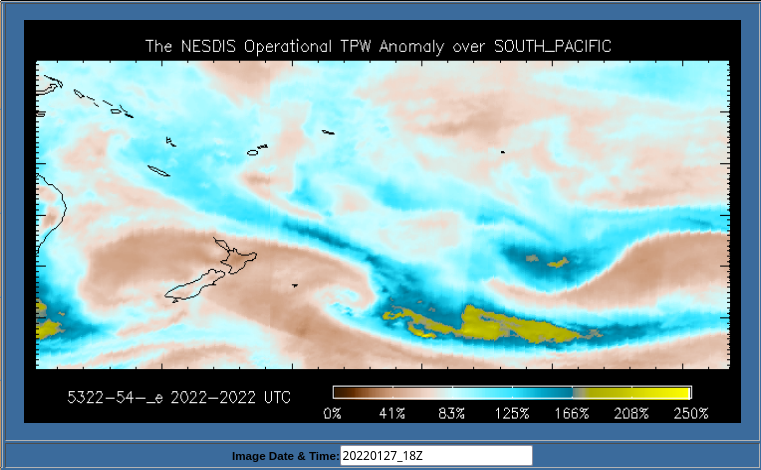
Microwave-derived estimates of Total Precipitable Water (TPW), above, from MIMIC TPW, show an increase in moisture around the Samoan Islands to the west of 170o W. Percent of Normal mappings of blended TPW in this region, as shown below (taken from this site), show values at >150% of normal.
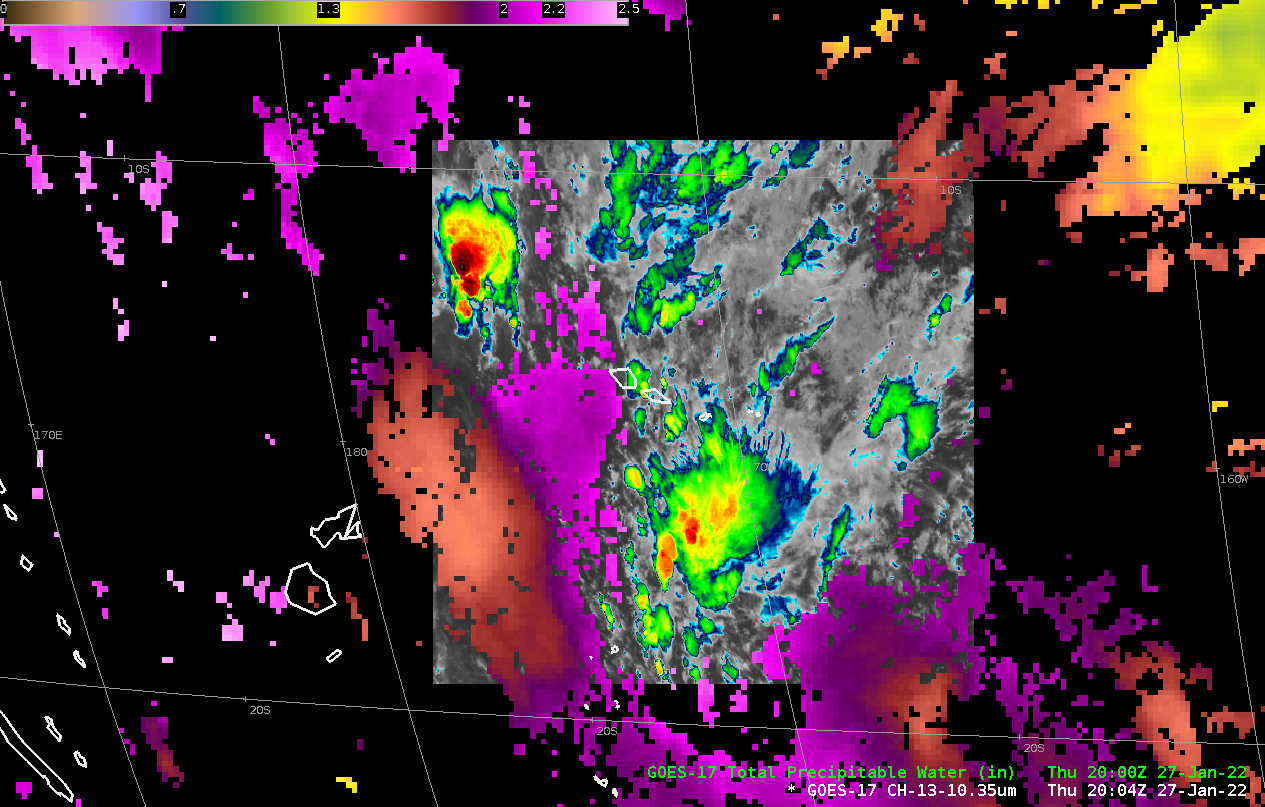
In anticipation of heavy rains, the National Weather Service Pacific Region requested a Mesoscale Domain (a complete list of messages is here) centered on Tutuila, the main island of American Samoa, through 1100 UTC on 28 January. An animation of GOES-17 Band 13, below, (every 5 minutes, rather than the 1-minute cadence of Mesoscale domains) overlain on top of the Level 2 Total Precipitable Water product (a product that is computed hourly for the Full Disk domain), shows a focus of convection moving westward over American Samoa and Samoa. Note the degradation of the Level 2 Product TPW that is associated with the poor functionality of the Loop Heat Pipe on GOES-17 that occurs at night. Magenta values in the TPW enhancement signify values exceeding 2″. Samoa and American Samoa are within a ribbon of exceptional moisture.
GOES-17 Visible Imagery, below, during the daytime, also show widespread convection moving into the Samoan waters. A benefit of the visible imagery is that surface lines of convergence that may initiate convection are apparent with the 5-minute cadence shown below; those lines are even more apparent in 1-minute imagery (shown here from 1825 – 2234 UTC)
Added, 28 January: the two final hours of the mesoscale domain are shown below. The axis of the deepest moisture has shifted westward through the mesoscale domain from the previous day; showers continue to develop.
View only this post Read Less


