MIMIC Total Precipitable Water esimates over the Indian Ocean for the 24 hours ending at 2000 UTC on 1 February 2022, above, show the strong cyclonic circulation associated with Cyclone Basirai. Its forecast motion is westward towards Madagascar, as shown in the toggle below that also includes sea-surface temperatures and Window Channel (showing a well-structured storm; all images are from the SSEC/CIMSS Tropical Website). A wind shear analysis (also from the SSEC Tropical Website and valid at 1800 UTC on 1 February) for the Indian Ocean shows low shear values over the storm, but relatively high shear between the storm and the island of Madagascar.
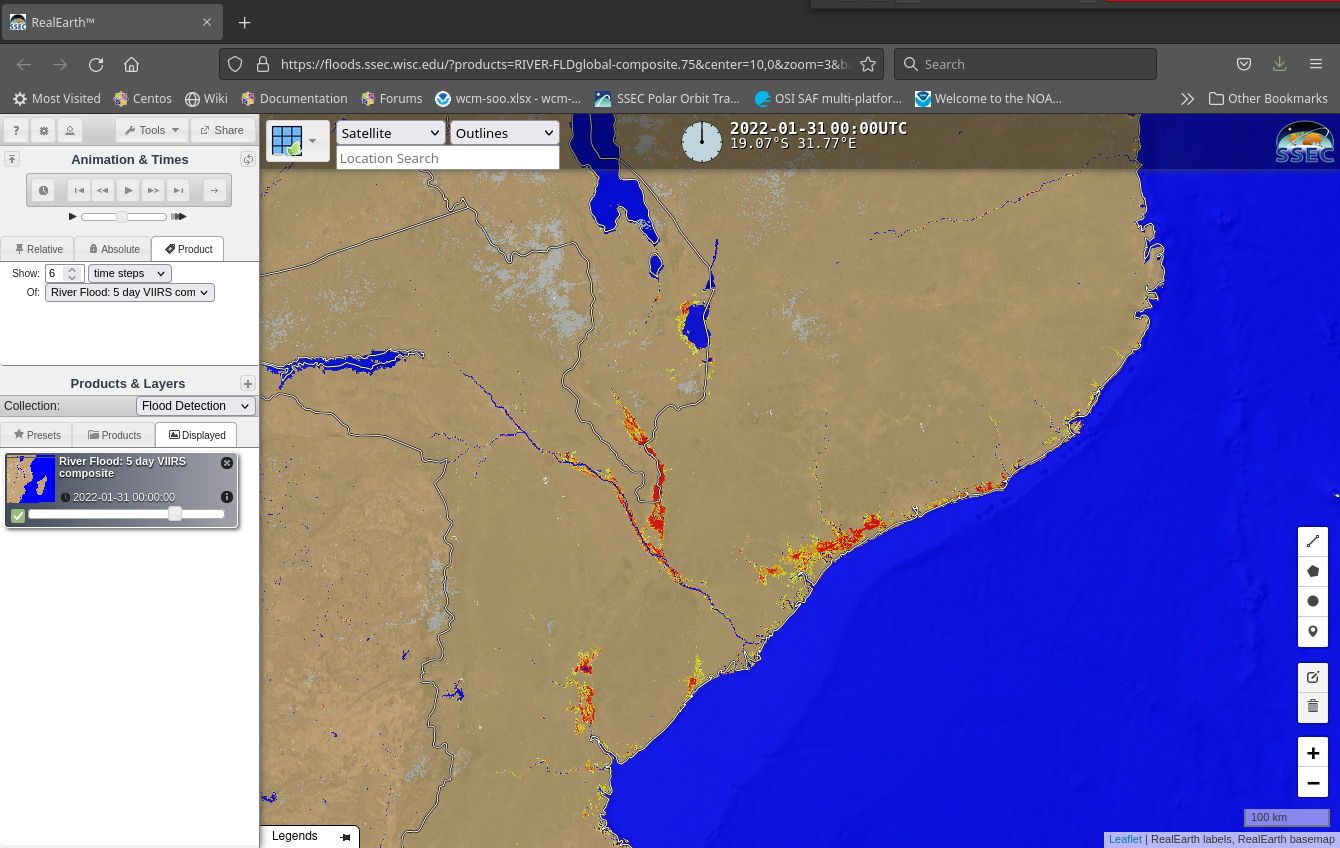
Batsirai’s path moves it close to Mozambique/Malawi, two countries that are still being flooded as a result of rains from Tropical Storm Ana a week ago. A VIIRS flood analysis (from this website), below, diagnoses active flooding occurring along the Shire River (south of Lake Malawi) and along the Zambezi River on 31 January 2022.
For more information on Batsirai, consult the RSMC at La Réunion (click ici) or the SSEC Tropical Website.
View only this post Read Less


