This website works best with a newer web browser such as Chrome, Firefox, Safari or Microsoft Edge. Internet Explorer is not supported by this website.

Strong winds from SAR over the South Pacific

The animation above shows convection over the south Pacific to the east of American Samoa (note the Manu’a Islands just east of 170 W Longitude in the animation). Extensive cloud cover will limit the ability of the GOES-17 instrument to detect low-level cloud motions underneath the deep convection, which motions... Read More

GOES-17 ABI Band 13 infrared (10.3 µm) imagery, 0500-0600 UTC on 28 June 2021 (click to animate)

The animation above shows convection over the south Pacific to the east of American Samoa (note the Manu’a Islands just east of 170 W Longitude in the animation). Extensive cloud cover will limit the ability of the GOES-17 instrument to detect low-level cloud motions underneath the deep convection, which motions can be used to infer wind speeds. Other data sources are needed. In addition to scatterometry from the MetOp series of satellites, synthetic aperture radar (SAR) that flies on the RADARSAT Constellation Mission (RCM) satellites (and on Sentinel) (available at this website) can give high-quality estimates of wind speeds. Given the animation of full-disk imagery above (at ten-minute timesteps), taken from AWIPS and therefore sub-sampled down to 6-km horizontal resolution, how fast would you guess wind speeds might be near the surface under the convection. SAR data below shows winds near 25 m/s, i.e., storm-force winds, under the convection.

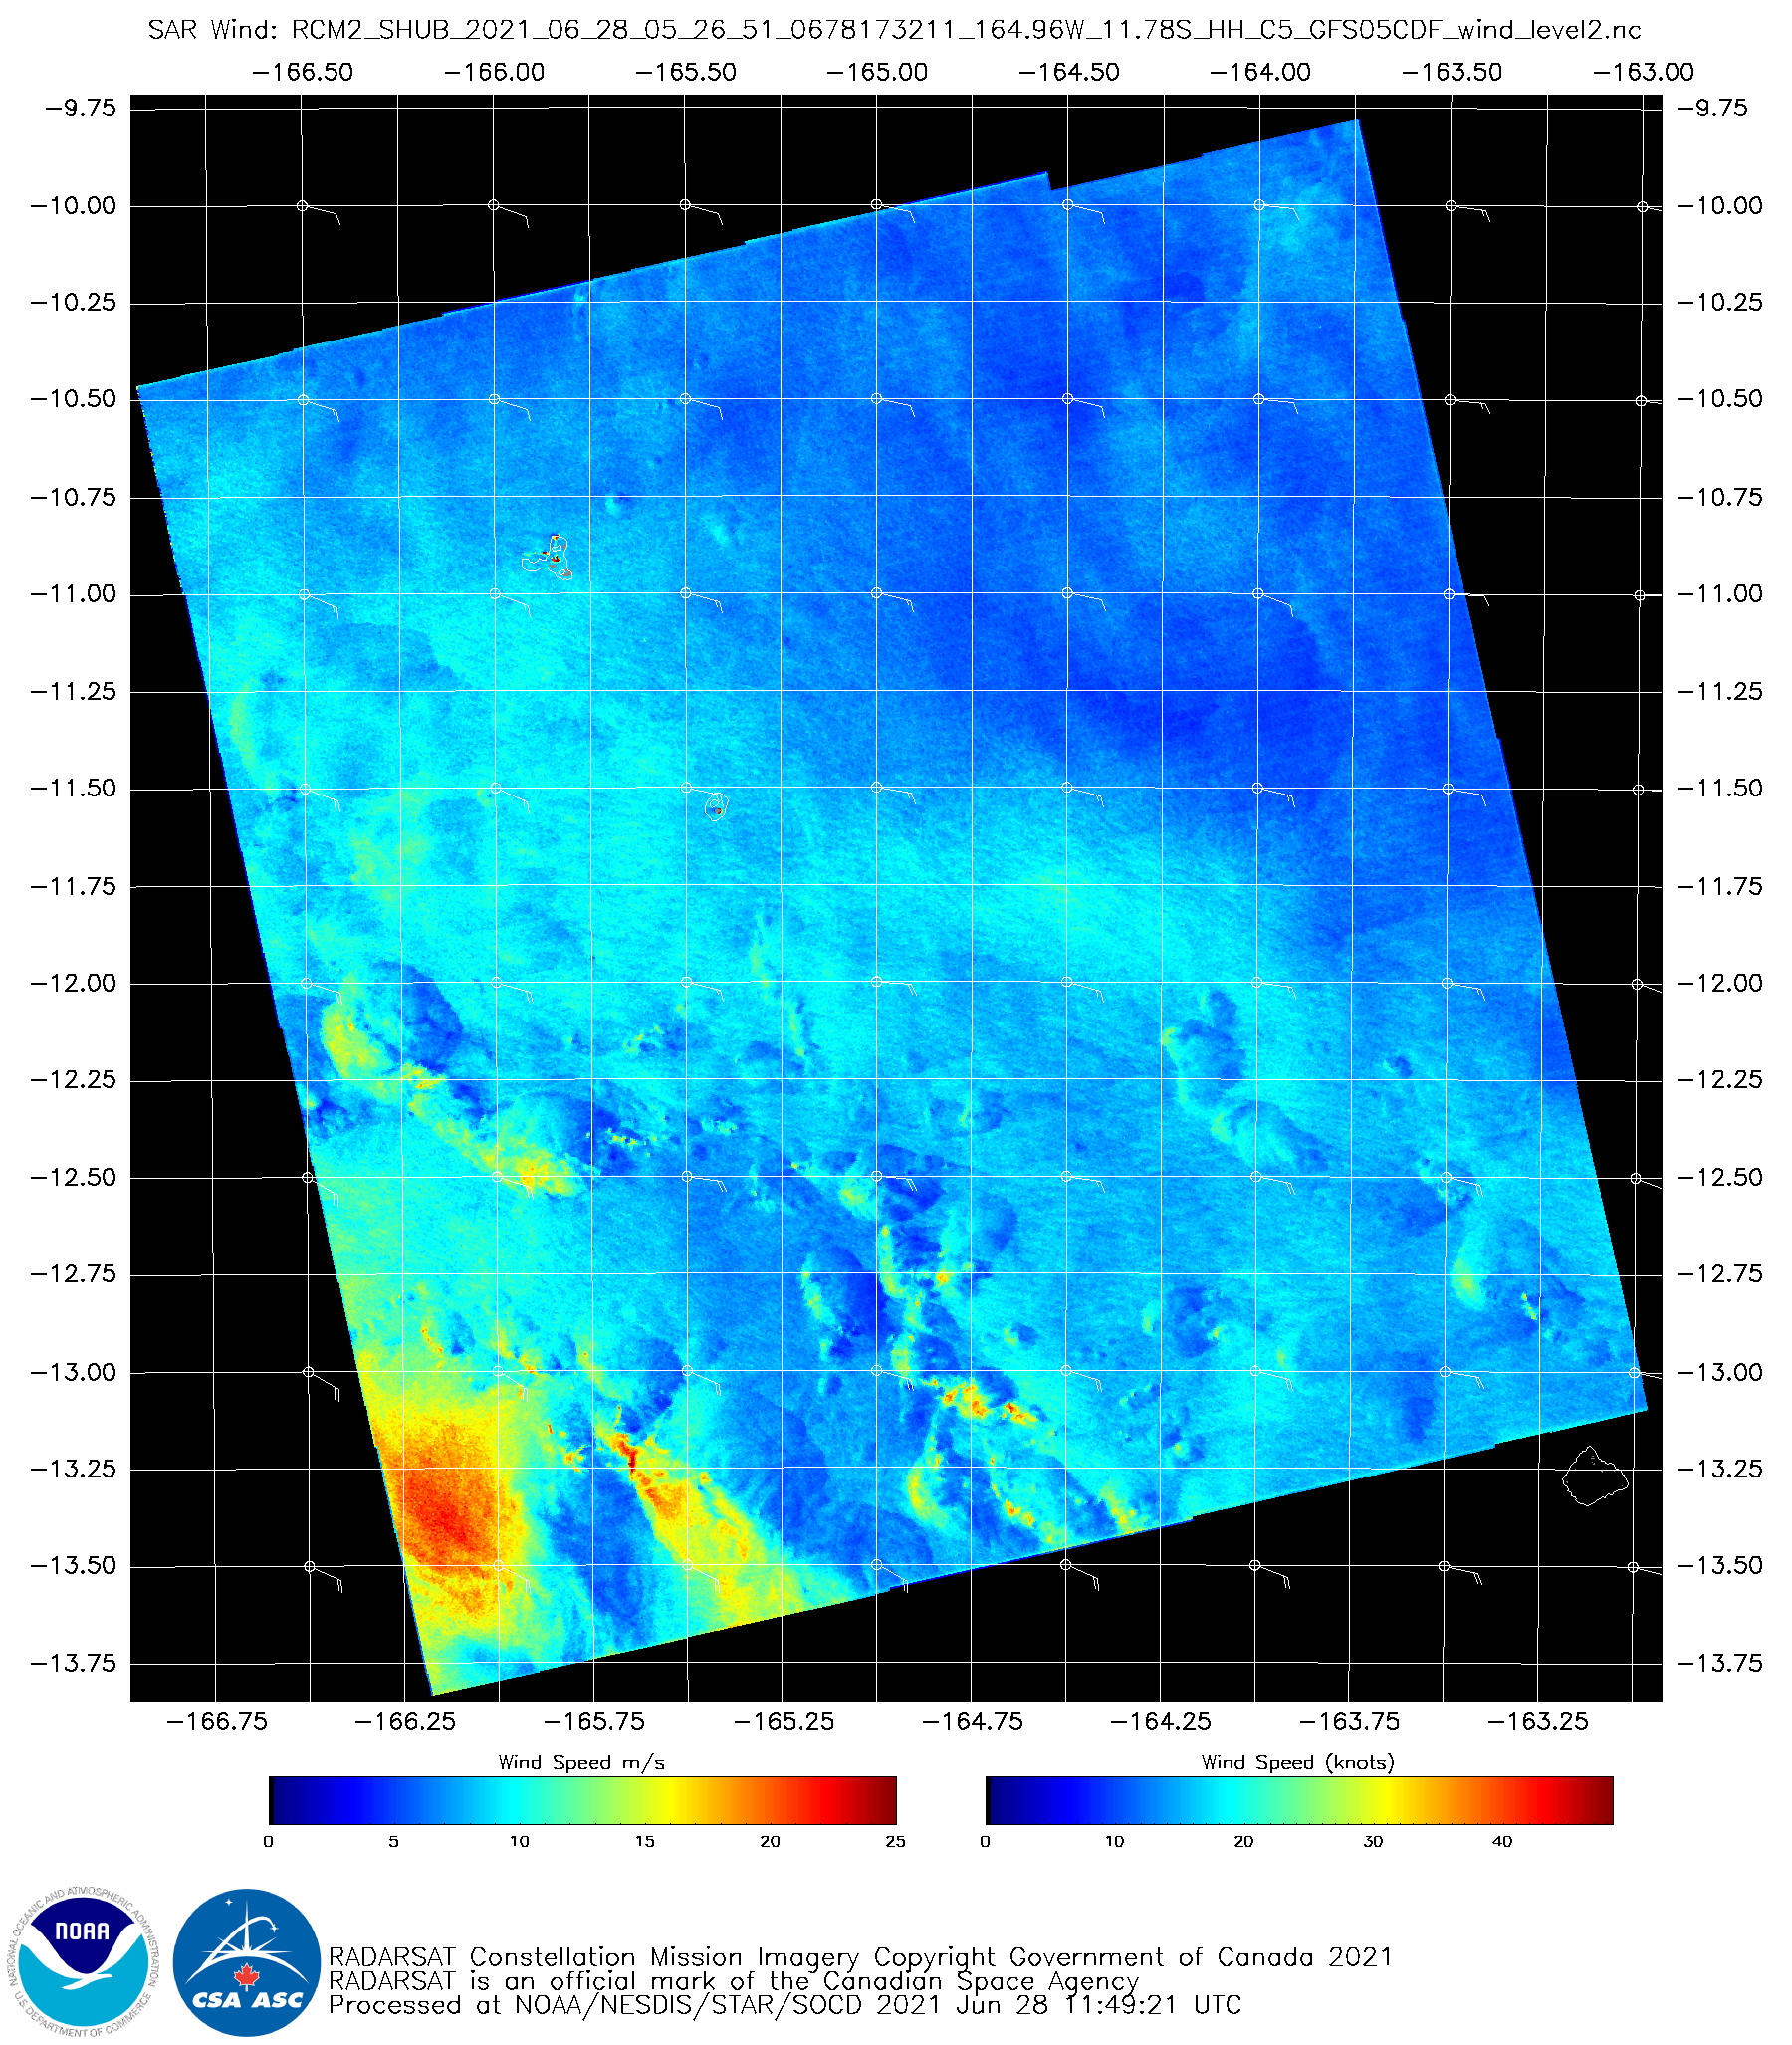
RCM2 SAR surface winds, 0526 UTC on 28 June 2021 (Click to enlarge)

A full-resolution image of GOES-17 clean window infrared data (10.3 µm) (created using Geo2Grid) is shown below, at the closest time to the observed winds shown above. The deepest cloud tops are close to the strongest surface wind speeds.

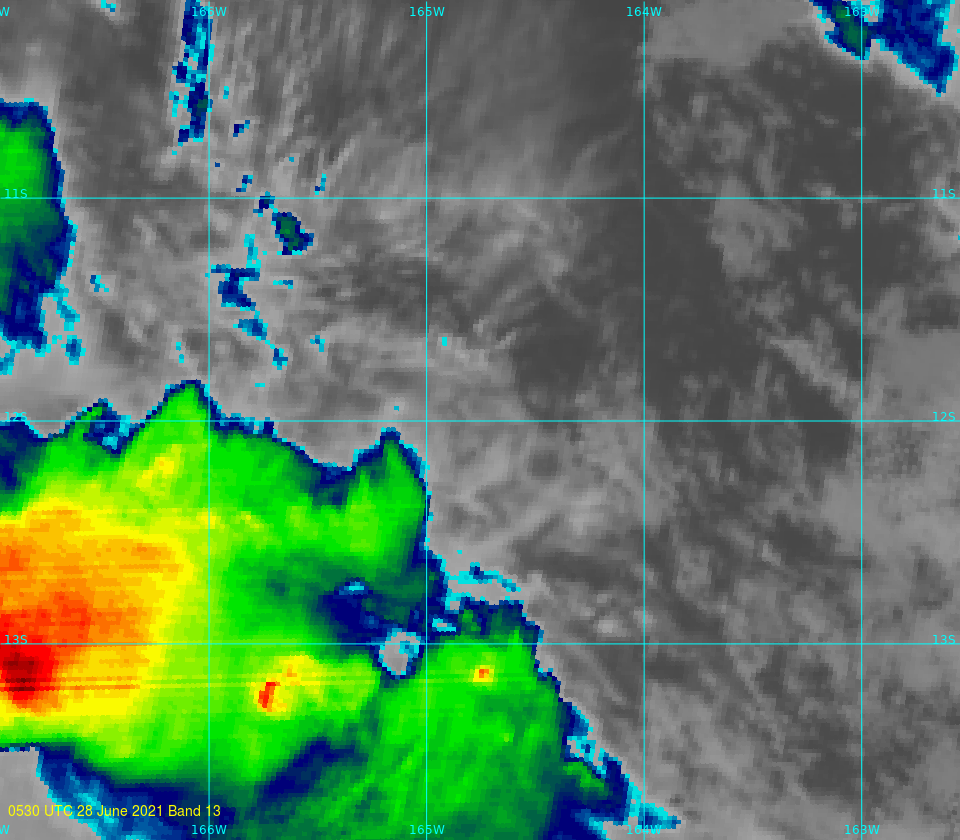
GOES-17 ABI Band 13 infrared (10.3 µm) imagery, 0530 UTC on 28 June 2021 (click to enlarge)

View only this post Read Less

Pacific Northwest heatwave

GOES-17 (GOES-West) Shortwave Infrared (3.9 µm) images (above) included plots of hourly surface temperature during the 26 June27 June 2021 period — the first 2 days of a historic heatwave across the Pacific Northwest (caused by an anomalous 500hPa ridge over the region). Numerous high temperature records were set, including new all-time record highs for... Read More

GOES-17 Shortwave Infrared (3.9 µm) images, with hourly surface temperatures plotted in yellow [click to play animation | MP4]

GOES-17 Shortwave Infrared (3.9 µm) images, with hourly surface temperatures plotted in yellow [click to play animation | MP4]

GOES-17 (GOES-West) Shortwave Infrared (3.9 µm) images (above) included plots of hourly surface temperature during the 26 June27 June 2021 period — the first 2 days of a historic heatwave across the Pacific Northwest (caused by an anomalous 500hPa ridge over the region). Numerous high temperature records were set, including new all-time record highs for Portland OR (116 F), Seattle WA (104 F) and the entire country of Canada (121 F).

GOES-17 True Color RGB images created using Geo2Grid (below) showed that most of Washington and Oregon remained cloud-free during the daytime — and a smoke plume from the Lava Fire in far northern California was seen drifting northwestward (especially on 27 June).

GOES-17 True Color RGB mages [click to play animation | MP4]

GOES-17 True Color RGB mages, 26-27 June [click to play animation | MP4]

View only this post Read Less

Satellite signatures of solar farms across Minnesota

GOES-16 (GOES-East) “Red” Visible (0.64 µm), Near-Infrared “Snow/Ice” (1.61 µm), Near-Infrared “Cloud Particle Size” (2.24 µm), Shortwave Infrared (3.9 µm) and Fire Temperature RGB images along with Fire Temperature, Fire Power and Fire Area derived products (above) showed reflectance and thermal signatures of sunlight reflecting off large arrays of solar panels at solar farms across southern/central Minnesota... Read More

GOES-16

GOES-16 “Red” Visible (0.64 µm), Near-Infrared “Snow/Ice” (1.61 µm), Near-Infrared “Cloud Particle Size” (2.24 µm), Shortwave Infrared (3.9 µm), Fire Temperature RGB, Fire Temperature, Fire Power and Fire Area [click to play animation | MP4]

GOES-16 (GOES-East) “Red” Visible (0.64 µm), Near-Infrared “Snow/Ice” (1.61 µm), Near-Infrared “Cloud Particle Size” (2.24 µm), Shortwave Infrared (3.9 µm) and Fire Temperature RGB images along with Fire Temperature, Fire Power and Fire Area derived products (above) showed reflectance and thermal signatures of sunlight reflecting off large arrays of solar panels at solar farms across southern/central Minnesota on 23 June 2021. These bright/warm signatures were more pronounced from larger solar farms — with the warmest being exhibited by a solar farm southeast of Redwood Falls in southwestern Minnesota (Shortwave Infrared: 50.6ºC / Fire Temperature: 853.9 K / Fire Power: 126.8 MW).

The Fire Temperature / Fire Power / Fire Area derived products are components of the GOES Fire Detection and Characterization Algorithm (FDCA).

Previous blog posts discussing solar farm signatures can be found here, here and here.

View only this post Read Less

Severe weather in the central Plains

1-minute Mesoscale Domain Sector GOES-16 (GOES-East) “Red” Visible (0.64 µm) images (above) include time-matched plots of SPC Storm Reports — and showed severe thunderstorms across eastern Colorado, western Kansas and far southwestern Nebraska late in the day on 19 June 2021. Numerous pulsing overshooting tops were evident with many of these storms. Wind gusts to 88 mph were reported in KansasThe corresponding 1-minute GOES-16... Read More

GOES-16 “Red” Visible (0.64 µm) images, with SPC Storm Reports plotted in red [click to play animation | MP4]

GOES-16 “Red” Visible (0.64 µm) images, with SPC Storm Reports plotted in red [click to play animation | MP4]

1-minute Mesoscale Domain Sector GOES-16 (GOES-East) “Red” Visible (0.64 µm) images (above) include time-matched plots of SPC Storm Reports — and showed severe thunderstorms across eastern Colorado, western Kansas and far southwestern Nebraska late in the day on 19 June 2021. Numerous pulsing overshooting tops were evident with many of these storms. Wind gusts to 88 mph were reported in Kansas

The corresponding 1-minute GOES-16 “Clean” Infrared Window (10.35 µm) images (below) displayed cloud-top infrared brightness temperatures as cold as -75 to -79ºC (brighter white pixels within dark black clusters) with some of the more robust overshooting tops.

GOES-16 “Clean” Infrared Window (10.35 µm) images, with SPC Storm Reports plotted in cyan [click to play animation | MP4]

GOES-16 “Clean” Infrared Window (10.35 µm) images, with SPC Storm Reports plotted in cyan [click to play animation | MP4]

View only this post Read Less