This website works best with a newer web browser such as Chrome, Firefox, Safari or Microsoft Edge. Internet Explorer is not supported by this website.

Tropical Storm Claudette makes landfall along the central Gulf Coast

The Potential Tropical Cyclone that has been moving northward through the Gulf of Mexico made landfall southwest of New Orleans, LA on Saturday 19 June as a minimal Tropical Cyclone. The animation of total precipitable water, above, from the MIMIC TPW website, shows that most of the storm’s moisture is east of... Read More

MIMIC Total Precipitable Water (TPW) estimates, 1900 UTC 18 June 2021 – 1800 UTC 19 June 2021 (Click to enlarge)

The Potential Tropical Cyclone that has been moving northward through the Gulf of Mexico made landfall southwest of New Orleans, LA on Saturday 19 June as a minimal Tropical Cyclone. The animation of total precipitable water, above, from the MIMIC TPW website, shows that most of the storm’s moisture is east of the center. (The circulation of Pacific Tropical Storm Dolores is also apparent, making landfall near Punta San Telmo in Mexico) A percent-of-Normal plots from NOAA/NESDIS/OSPO, below, shows values about 150% of normal over much of the southeast USA. Consequently, Flash Flood Watches are in effect over much of southern Alabama northeastward into western North Carolina, as shown below.

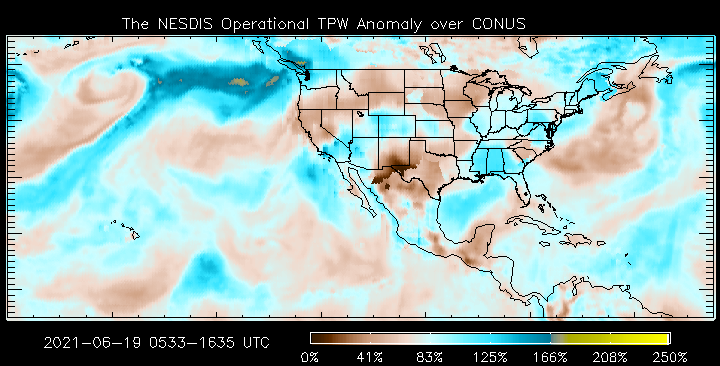
Percent-of-normal Blended Total Precipitable Water, 1800 UTC on 19 June 2021 (Click to enlarge)

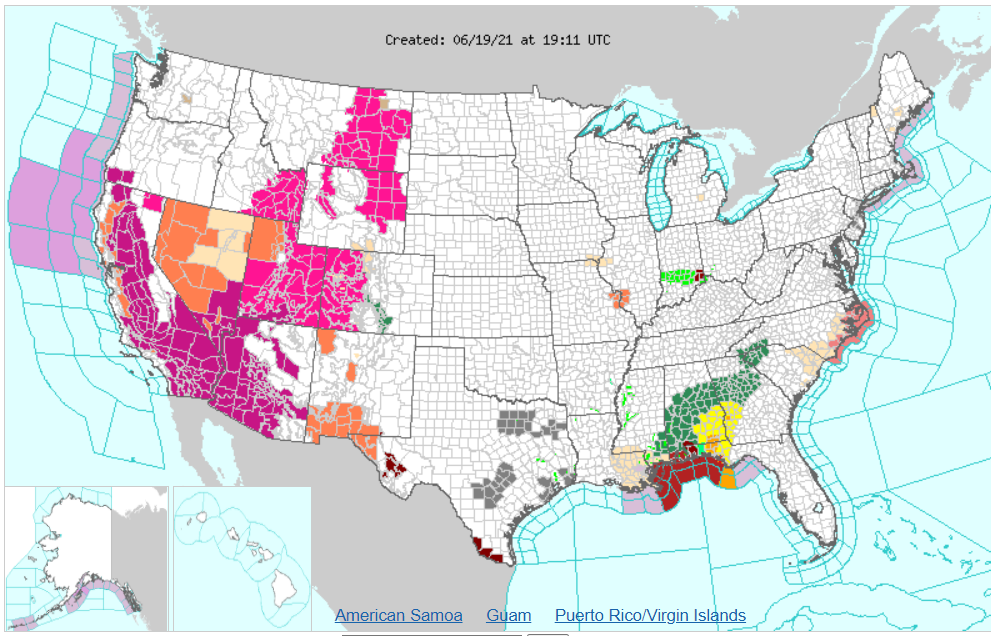
Weather hazards at 1911 UTC on 19 June 2021 (Click to enlarge)

A True-Color image from CSPP Geosphere, below, taken from this link, shows the storm inland over southwestern Alabama; much of the rain and deep moisture with the storm remains to the east of the center.

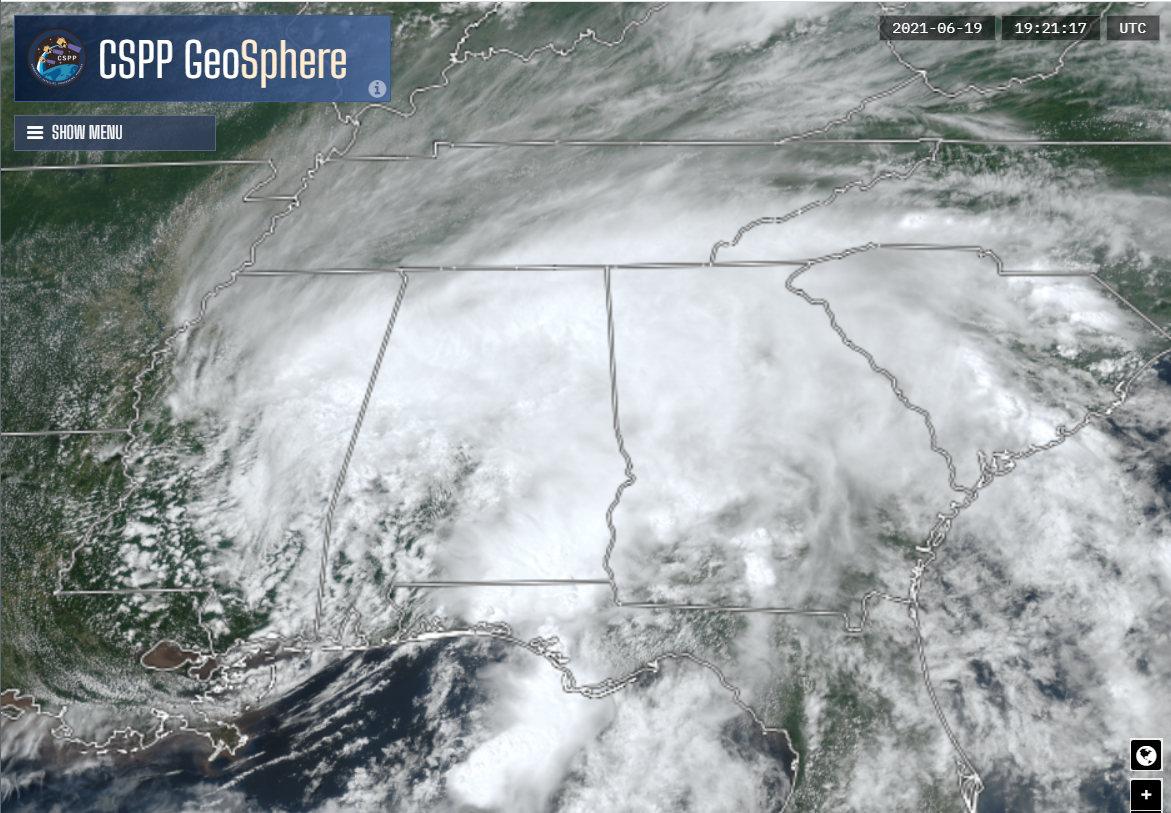
True-Color imagery, 1921 UTC on 19 June 2021, from CSPP Geosphere (Click to enlarge)


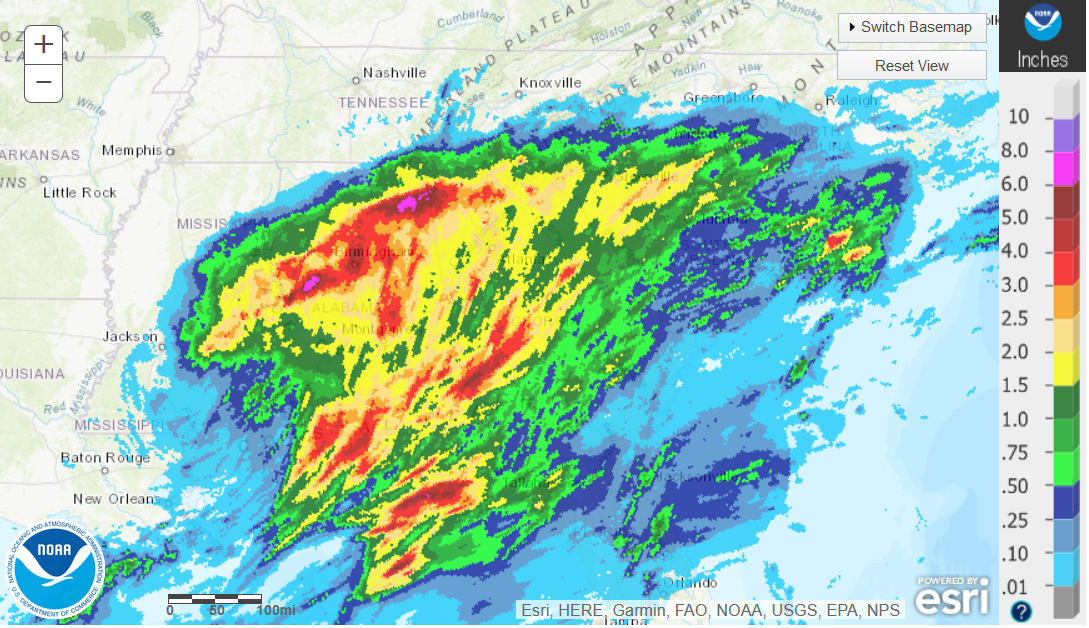
24-hour precipitation ending 1200 UTC on 20 June 2021 (Click to enlarge)

24-hour precipitation totals (from this site) are shown above. The analysis shows a few spots in northern Alabama received 6-8″ of rain.

CMORPH2 estimates for the 24-hours of precipitation ending at 0000 UTC on 20 June (that is, 12 hours before the estimate above), from RealEarth, are shown below.

24-hour CMORPH2 precipitation total estimates for the time ending 0000 UTC on 20 June 2021 (Click to enlarge)

GSMaP (link) also shows satellite-derived precipitation estimates. The 24-hour estimate ending at 0000 UTC on 20 June is shown below.

GSMaP precipitation estimate for the 24 hours ending 0000 UTC on 20 June 2021 (Click to enlarge)

View only this post Read Less

Severe weather associated with the landfall of Tropical Storm Claudette

1-minute Mesoscale Domain Sector GOES-16 (GOES-East) “Red” Visible (0.64 µm) images (above) include time-matched plots of SPC Storm Reports — and showed severe thunderstorms associated with the landfall of Tropical Storm Claudette (surface analyses) early in the day on 19 June 2021. Numerous pulsing overshooting tops were evident with some of these storms.The corresponding 1-minute GOES-16 “Clean” Infrared Window (10.35 µm) images (below) displayed cloud-top infrared brightness temperatures as cold... Read More

GOES-16 “Red” Visible (0.64 µm) images, with SPC Storm Reports plotted in red [click to play animation | MP4]

GOES-16 “Red” Visible (0.64 µm) images, with SPC Storm Reports plotted in red [click to play animation | MP4]

1-minute Mesoscale Domain Sector GOES-16 (GOES-East) “Red” Visible (0.64 µm) images (above) include time-matched plots of SPC Storm Reports — and showed severe thunderstorms associated with the landfall of Tropical Storm Claudette (surface analyses) early in the day on 19 June 2021. Numerous pulsing overshooting tops were evident with some of these storms.

The corresponding 1-minute GOES-16 “Clean” Infrared Window (10.35 µm) images (below) displayed cloud-top infrared brightness temperatures as cold as -80ºC (violet pixels) with some of the more robust overshooting tops. On both the Visible and Infrared images, Butler County, Alabama is outlined in blue — with Interstate Highways plotted in violet. A multi-vehicle accident with 10 fatalities occurred along Interstate 65 in far northeastern Butler County around 1830 UTC (2:30 PM local time); although no severe weather was reported in Butler County, the Infrared images showed cold cloud-top brightness temperatures moving northeastward over that area during much of the morning hours, so heavy rainfall and wet roads (with some residual areas of ponding water) may have been a contributing factor to this accident. Greenville in Butler County received 1.71 inches of rainfall — but not far to the southwest, Evergreen in Conecuh County received 3.16 inches of rainfall during the landfall of Claudette.

GOES-16 “Clean” Infrared Window (10.35 µm) images, with SPC Storm Reports plotted in cyan [click to play animation | MP4]

GOES-16 “Clean” Infrared Window (10.35 µm) images, with SPC Storm Reports plotted in cyan [click to play animation | MP4]

Additional details regarding Claudette’s abundant tropical moisture and resulting heavy rainfall can be found on this blog post.

View only this post Read Less

Potential Tropical Cyclone 3 develops in the Gulf of Mexico

1-minute Mesoscale Domain Sector GOES-16 (GOES-East) “Red” Visible (0.64 µm) and “Clean” Infrared Window (10.35 µm) images (above) showed the formation of Potential Tropical Cyclone 3 in the Gulf of Mexico on 17 Jun 2021. A low-level circulation could be seen near the storm center on Visible imagery, but deep convection was only occurring at some distance from the center.Even though... Read More

GOES-16 “Red” Visible (0.64 µm) and

GOES-16 “Red” Visible (0.64 µm) and “Clean” Infrared Window (10.35 µm) images [click to play animation | MP4]

1-minute Mesoscale Domain Sector GOES-16 (GOES-East) “Red” Visible (0.64 µm) and “Clean” Infrared Window (10.35 µm) images (above) showed the formation of Potential Tropical Cyclone 3 in the Gulf of Mexico on 17 Jun 2021. A low-level circulation could be seen near the storm center on Visible imagery, but deep convection was only occurring at some distance from the center.

Even though the tropical disturbance was forming over warm waters (SST | OHC), a plot of modest to high amounts of deep-layer wind shear from the CIMSS Tropical Cyclones site (below) indicated that the rate of intensification might be relatively slow.

 GOES-16 Infrared Window images, with contours of deep-layer wind shear [click to enlarge]

GOES-16 Infrared Window images, with contours of deep-layer wind shear [click to enlarge]

View only this post Read Less

Rapid Convective Initiation and NUCAPS Profiles in the upper Midwest

A favorable orbit geometry on NOAA-20 on 17 June 2021 meant that portions of the upper Midwest received NUCAPS soundings 90 minutes apart. This is an ideal way to monitor destabilization on a day when SPC has predicted an enhanced risk of severe weather, as shown below and at this link.Compare... Read More

NUCAPS Sounding Availability, 1745 and 1927 UTC on 17 June 2021. Note the overlapping coverage in eastern Iowa (Click to enlarge)

A favorable orbit geometry on NOAA-20 on 17 June 2021 meant that portions of the upper Midwest received NUCAPS soundings 90 minutes apart. This is an ideal way to monitor destabilization on a day when SPC has predicted an enhanced risk of severe weather, as shown below and at this link.

SPC Convective outlook, 2000 UTC on 17 June 2021 (Click to enlarge)

Compare the sounding at 42º N, 92º W from ~1800 UTC to the one from ~1930 UTC, below.  Destabilization is apparent;  the later profile has a lower LCL and lower LFC, and moisture has increased.

NUCAPS Profiles near 42º N, 92º W at 1800 and 1930 UTC, 17 June 2021 (Click to enlarge)

This surface plot from 2000 UTC suggests that the NUCAPS profile at ~1930 UTC has a boundary layer that is too cool and too dry.  When the sounding values are edited — the lowest 3 layers were warmed and moistened — to better match the plotted observations, the sounding CAPE increased, and the LCL/LFC dropped even farther.

Original and modified NUCAPS profile at 42.14ºº N, 91.54 W, ~1930 UTC on 17 June 2021 (Click to enlarge)

The convection developed rapidly.  The every-90-minutes toggle below (GOES-16 Visible Imagery at 2000, 2130, 2300 UTC) shows that, and the Day Cloud Phase Distinction RGB at the bottom (from 1901-2356 UTC) does too.

GOES-16 Band 2 Visible (0.64 µm) Imagery, 2001, 2136, 2301 UTC on 17 June 2021 (Click to enlarge)

GOES-16 Day Cloud Phase Distinction RGB, 1901 – 2306 UTC on 17 June 2021 (Click to animate)


A low-level water vapor (GOES-16 Band 10, 7.3 µm) infrared imagery animation, below, from CSPP Geosphere (here is a link that will show the animation in CSPP GeoSphere until about the end of June), shows evidence of a northwestward-propagating gravity wave that might have initiated convection.  This feature first interacts with convection over far southeastern Iowa, and then with a southwest-to-northeast line of convection that developed.

View only this post Read Less