GOES-17 (GOES-West) “Red” Visible (0.64 µm), Shortwave Infrared (3.9 µm) and “Clean” Infrared Window (10.35 µm) images (above) showed the explosive formation of large pyrocumulonimbus (pyroCb) clouds that were spawned by large wildfires in British Columbia, Canada on 30 June 2021. The 10.35 µm cloud-top infrared brightness temperatures rapidly cooled to the -50 to -60ºC range,... Read More
![GOES-17 “Red” Visible (0.64 µm, top), Shortwave Infrared (3.9 µm, middle) and “Clean” Infrared Window (10.35 µm, bottom) [click to play animation | MP4]](https://cimss.ssec.wisc.edu/satellite-blog/images/2021/06/G17_VIS_SWIR_IR_BC_PYROCB_30JUN2021_B2713_2021181_230031_0003PANELS_FRAME0000031.GIF)
GOES-17 “Red” Visible (0.64 µm, top), Shortwave Infrared (3.9 µm, middle) and “Clean” Infrared Window (10.35 µm, bottom) [click to play animation | MP4]
GOES-17
(GOES-West) “Red” Visible (
0.64 µm), Shortwave Infrared (
3.9 µm) and “Clean” Infrared Window (
10.35 µm) images
(above) showed the explosive formation of large
pyrocumulonimbus (pyroCb) clouds that were spawned by large wildfires in British Columbia, Canada on 30 June 2021. The 10.35 µm cloud-top infrared brightness temperatures rapidly cooled to the -50 to -60ºC range, easily surpassing the -40ºC pyroCb threshold — and pyroCb 3.9 µm cloud-top infrared brightness temperatures were warmer (darker shades of gray) than those of surrounding meteorological cumulonimbus clouds (due to the presence of smaller ice crystals and smoke particles, which were better reflectors of incoming solar radiation).
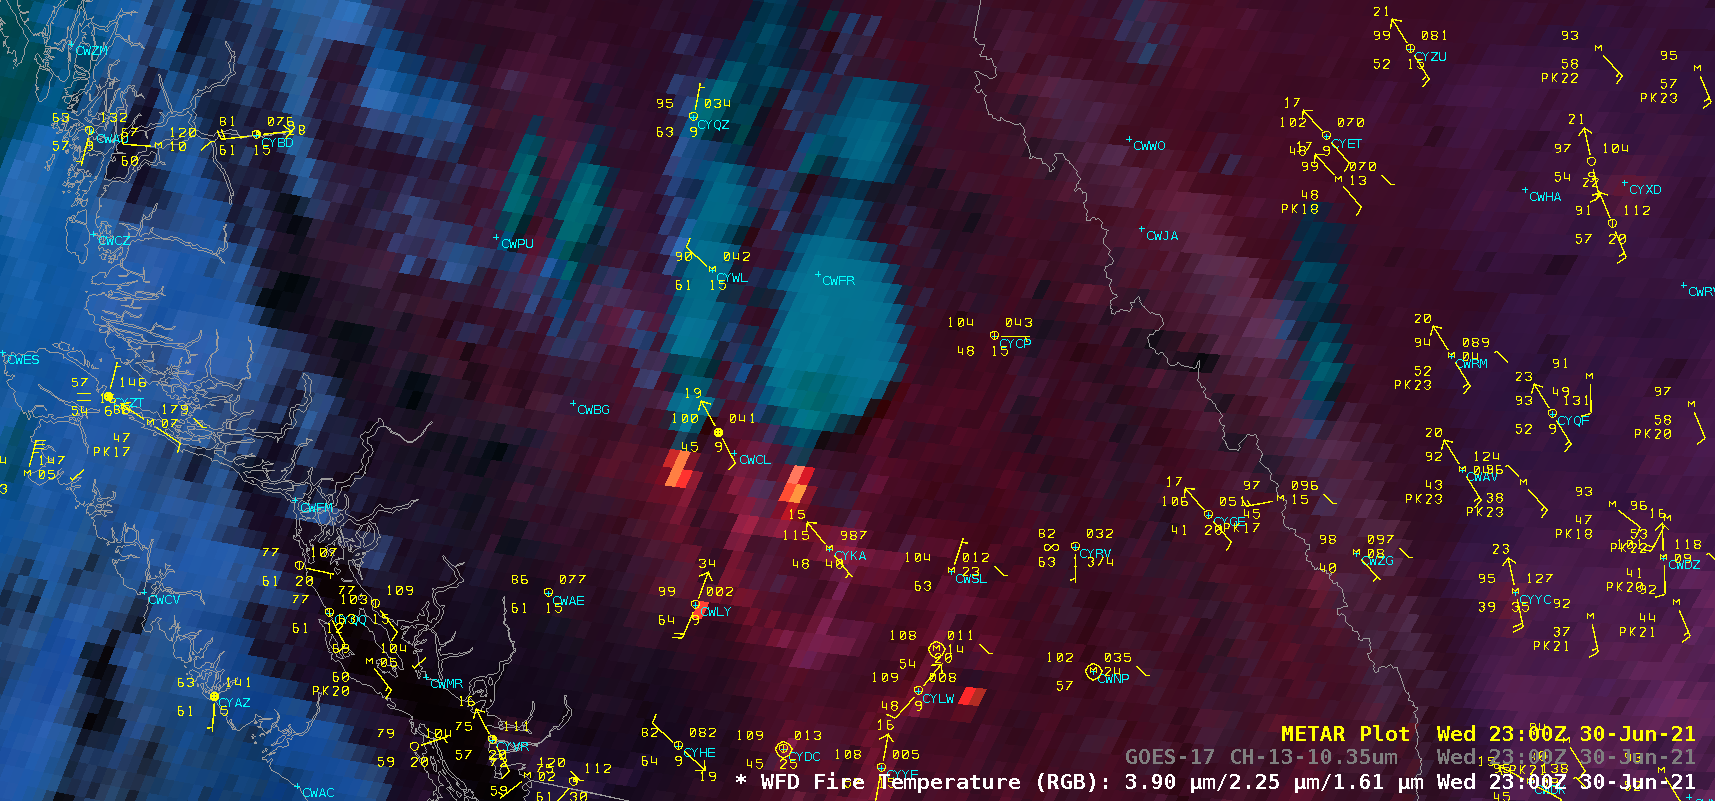
GOES-17 Fire Temperature RGB images (below) include surface reports plotted in yellow — note that the temperature reached 115ºF (46.1ºC) at Kamloops (CYKA), just southeast of the largest fire. In addition, farther to the southwest, surface observations at Lytton (CWLY) ceased as of 01 UTC (6 PM local time), as another wildfire began to destroy 90% of that town.
![GOES-17 Fire Temperature RGB images, with surface reports plotted in yellow [click to play animation | MP4]](https://cimss.ssec.wisc.edu/satellite-blog/images/2021/06/bc_fireT-20210630_230031.png)
GOES-17 Fire Temperature RGB images, with surface reports plotted in yellow [click to play animation | MP4]
====================================================================================
![GOES-17 “Red” Visible (0.64 µm, top), Shortwave Infrared (3.9 µm, middle) and “Clean” Infrared Window (10.35 µm, bottom) [click to play animation | MP4]](https://cimss.ssec.wisc.edu/satellite-blog/images/2021/06/G17_VIS_SWIR_IR_CA_PYROCB_30JUN2021_B2713_2021182_022617_0003PANELS_FRAME0000042.GIF)
GOES-17 “Red” Visible (0.64 µm, top), Shortwave Infrared (3.9 µm, middle) and “Clean” Infrared Window (10.35 µm, bottom) [click to play animation | MP4]
On a smaller spatial and temporal scale, GOES-17 Visible, Shortwave Infrared and Infrared Window images
(above) revealed the brief formation of a pyroCb that was produced by the
Lava Fire in far northern California. A portion of the cloud top reached the -40ºC threshold (darker shades of blue) to qualify as a pyroCb.
View only this post
Read Less
![GOES-17 “Red” Visible (0.64 µm, top), Shortwave Infrared (3.9 µm, middle) and “Clean” Infrared Window (10.35 µm, bottom) [click to play animation | MP4]](https://cimss.ssec.wisc.edu/satellite-blog/images/2021/06/210630_goes17_visible_shortwaveInfrared_infraredWindow_BC_pyroCb_anim.gif)
![GOES-17 Fire Temperature RGB images, with surface reports plotted in yellow [click to play animation | MP4]](https://cimss.ssec.wisc.edu/satellite-blog/images/2021/06/210630_goes17_fireTemperatureRGB_BC_pyroCb_anim.gif)
![GOES-17 “Red” Visible (0.64 µm, top), Shortwave Infrared (3.9 µm, middle) and “Clean” Infrared Window (10.35 µm, bottom) [click to play animation | MP4]](https://cimss.ssec.wisc.edu/satellite-blog/images/2021/06/210630_goes17_visible_shortwaveInfrared_infraredWindow_CA_pyroCb_anim.gif)
![GOES-16 “Red” Visible (0.64 µm) images [click to play animation | MP4]](https://cimss.ssec.wisc.edu/satellite-blog/images/2021/06/210628_goes16_visible_South_America_subtropical_storm_anim.gif)
![GOES-16 “Clean” Infrared Window (10.35 µm) images [click to play animation | MP4]](https://cimss.ssec.wisc.edu/satellite-blog/images/2021/06/210628_goes16_infrared_South_America_subtropical_storm_anim.gif)
![GOES-16 “Red” Visible (0.64 µm) images [click to play animation | MP4]](https://cimss.ssec.wisc.edu/satellite-blog/images/2021/06/210629_goes16_visible_South_America_subtropical_storm_anim.gif)
![GOES-16 “Clean” Infrared Window (10.35 µm) images [click to play animation | MP4]](https://cimss.ssec.wisc.edu/satellite-blog/images/2021/06/210629_goes16_infrared_South_America_subtropical_storm_anim.gif)
![ASCAT winds from Metop-A and Metop-C [click to enlarge]](https://cimss.ssec.wisc.edu/satellite-blog/images/2021/06/210628_210629_metopA_metopC_ascat_Subtropical_Storm_Raoni_anim.gif)


