
1-minute Mesoscale Domain Sector GOES-16 (GOES-East) “Red” Visible (0.64 µm) and “Clean” Infrared Window (10.35 µm) images (above) showed thunderstorms that moved across the northern portion of Lower Michigan on 20 May 2022. These storms produced hail (up to 3.0 inches in diameter), damaging winds (as high as 76 mph) and an EF-3 tornado that... Read More
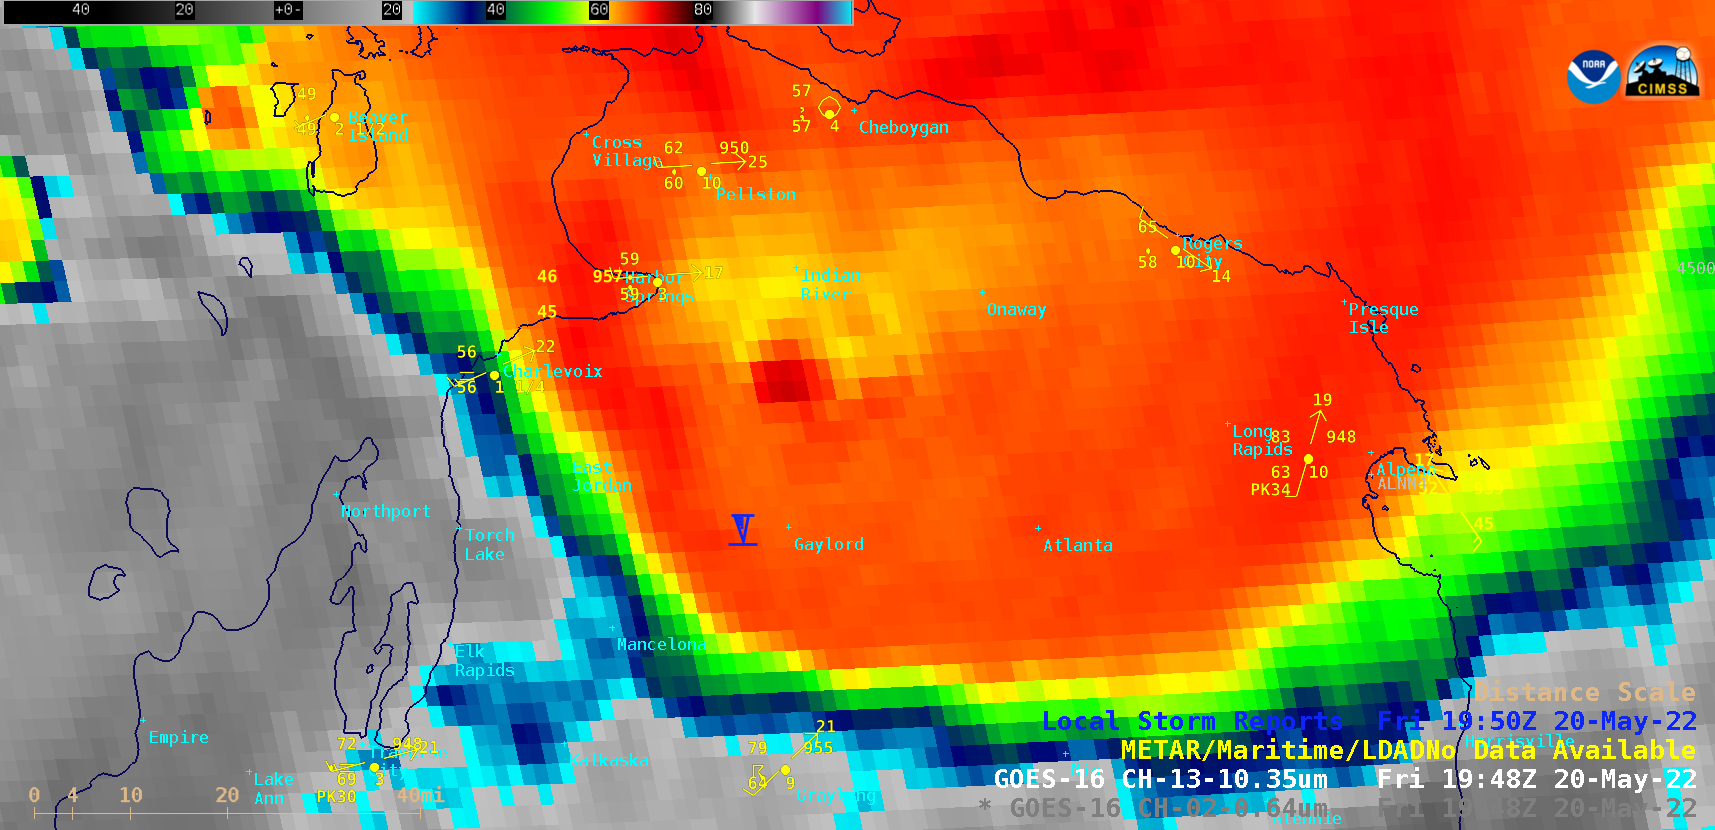
GOES-16 “Red” Visible (0.64 µm) and “Clean” Infrared Window (10.35 µm) images, with time-matched Local Storm Reports plotted in blue [click to play animated GIF | MP4]
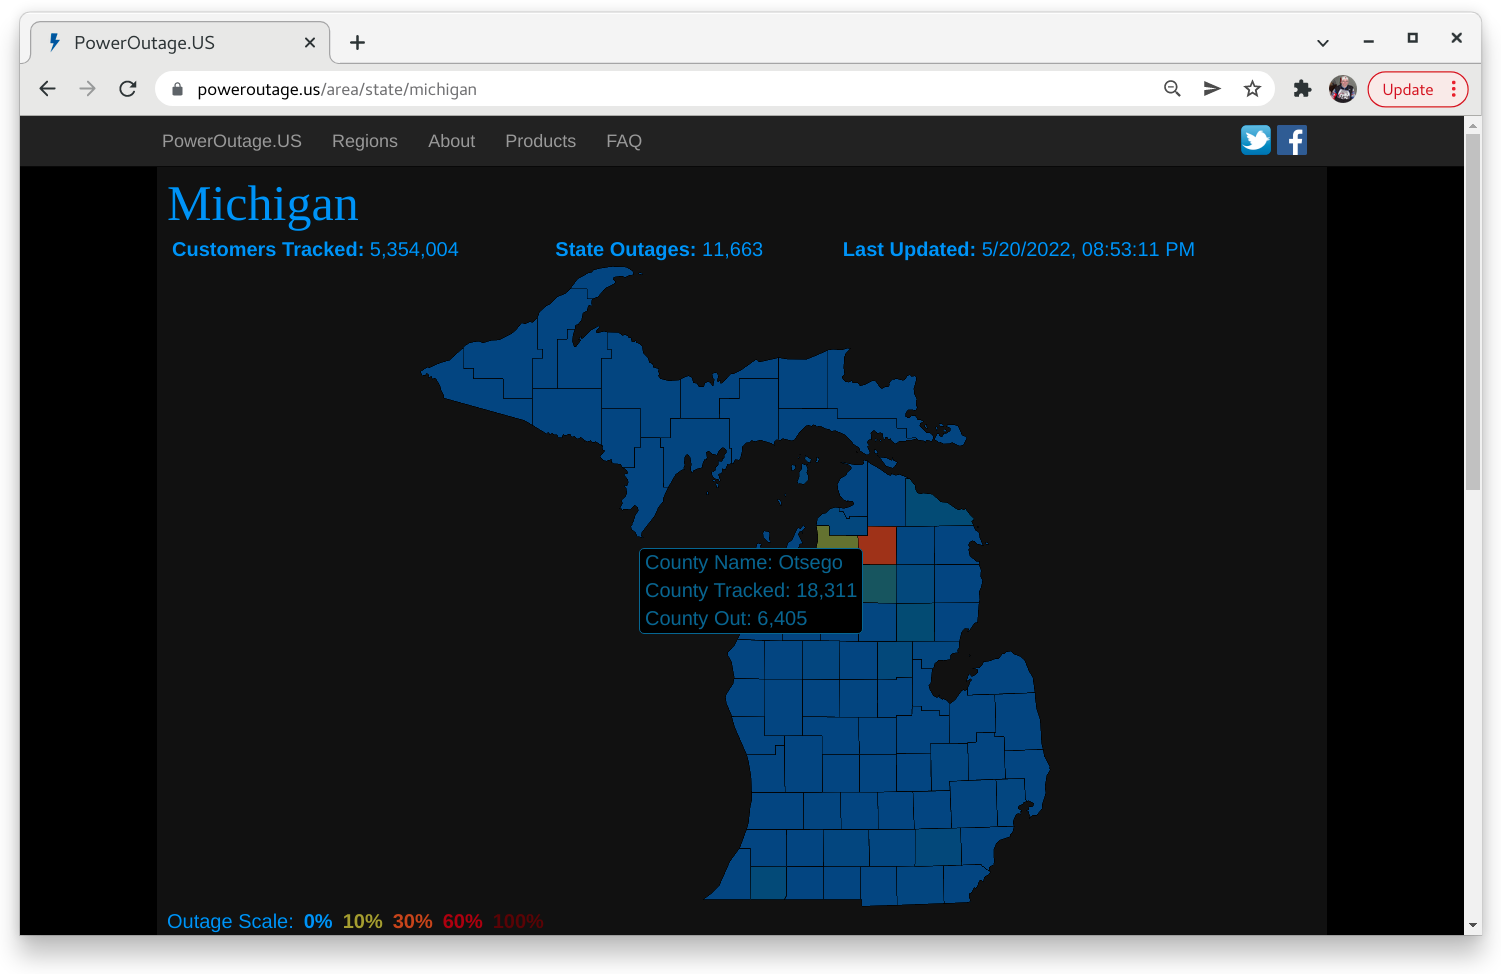
1-minute Mesoscale Domain Sector GOES-16 (GOES-East) “Red” Visible (0.64 µm) and “Clean” Infrared Window (10.35 µm) images (above) showed thunderstorms that moved across the northern portion of Lower Michigan on 20 May 2022. These storms produced hail (up to 3.0 inches in diameter), damaging winds (as high as 76 mph) and an EF-3 tornado that struck Gaylord (SPC Storm Reports | NWS Gaylord summary). Note that METAR reports were not available at Gaylord (and also about 30 miles to the west-southwest, at Bellaire) after the time of the tornado and damaging wind reports, due to widespread power outages (which affected about 1/3 of customers in Ostego County).
A 2-panel comparison of GOES-16 Visible and Infrared images — which includes time-matched plots of SPC Storm Reports — is shown below.
GOES-16 “Red” Visible (0.64 µm, top) and “Clean” Infrared Window (10.35 µm, bottom) images, with time-matched SPC Storm Reports plotted in red/cyan [click to play animated GIF | MP4]
Pulsing overshooting tops exhibited cloud-top infrared brightness temperatures as cold as -79oC — which represented an Equilibrium Level (EL) overshoot of 1 to 1.5 km, according to a special Gaylord rawinsonde launched at 19 UTC (below).
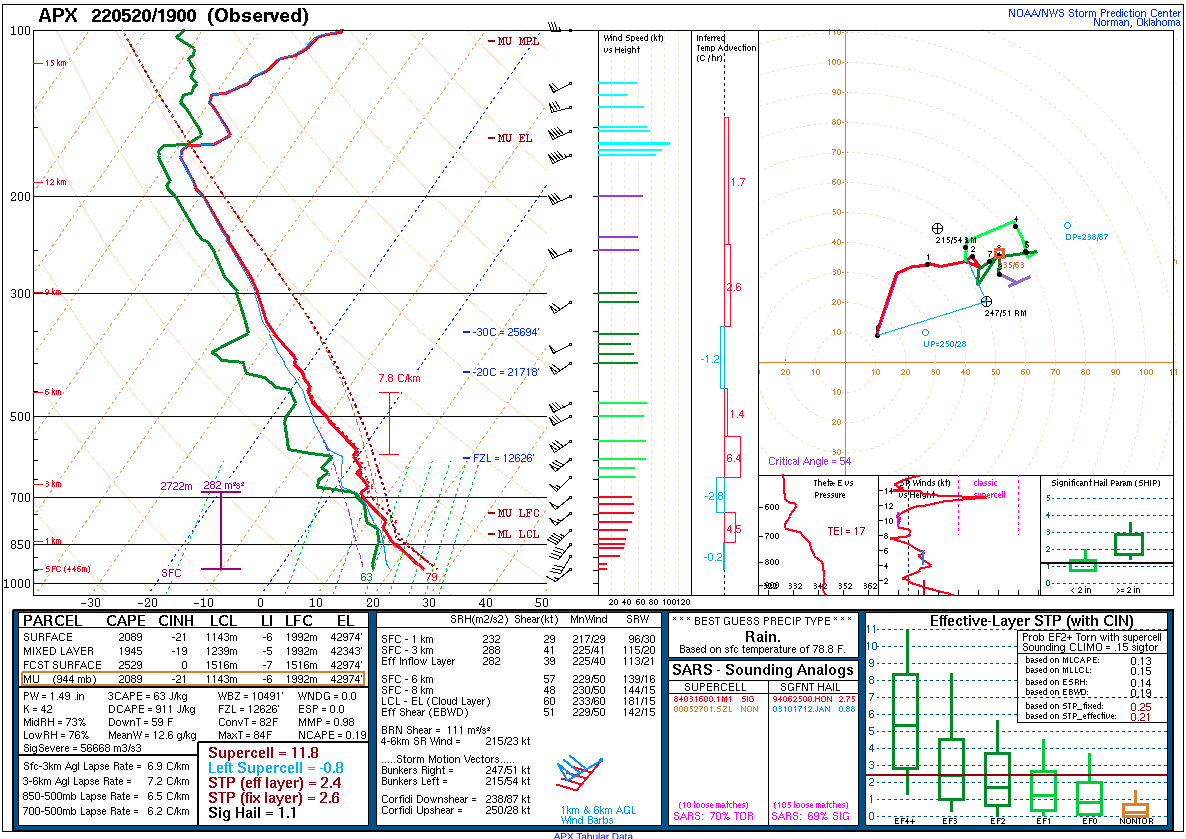
Plot of 19 UTC rawinsonde data at Gaylord, Michigan [click to enlarge]
——————————————————————–
GOES-16 “Red” Visible (0.64 µm) and “Clean” Infrared Window (10.35 µm) images at 1948 UTC, with the initial tornado report location plotted in blue [click to enlarge|
A toggle between GOES-16 Visible and Infrared images at 1948 UTC (above) includes the initial tornado report location plotted in blue. Note the offset between the overshooting top and the tornado report — this is due to parallax (below).
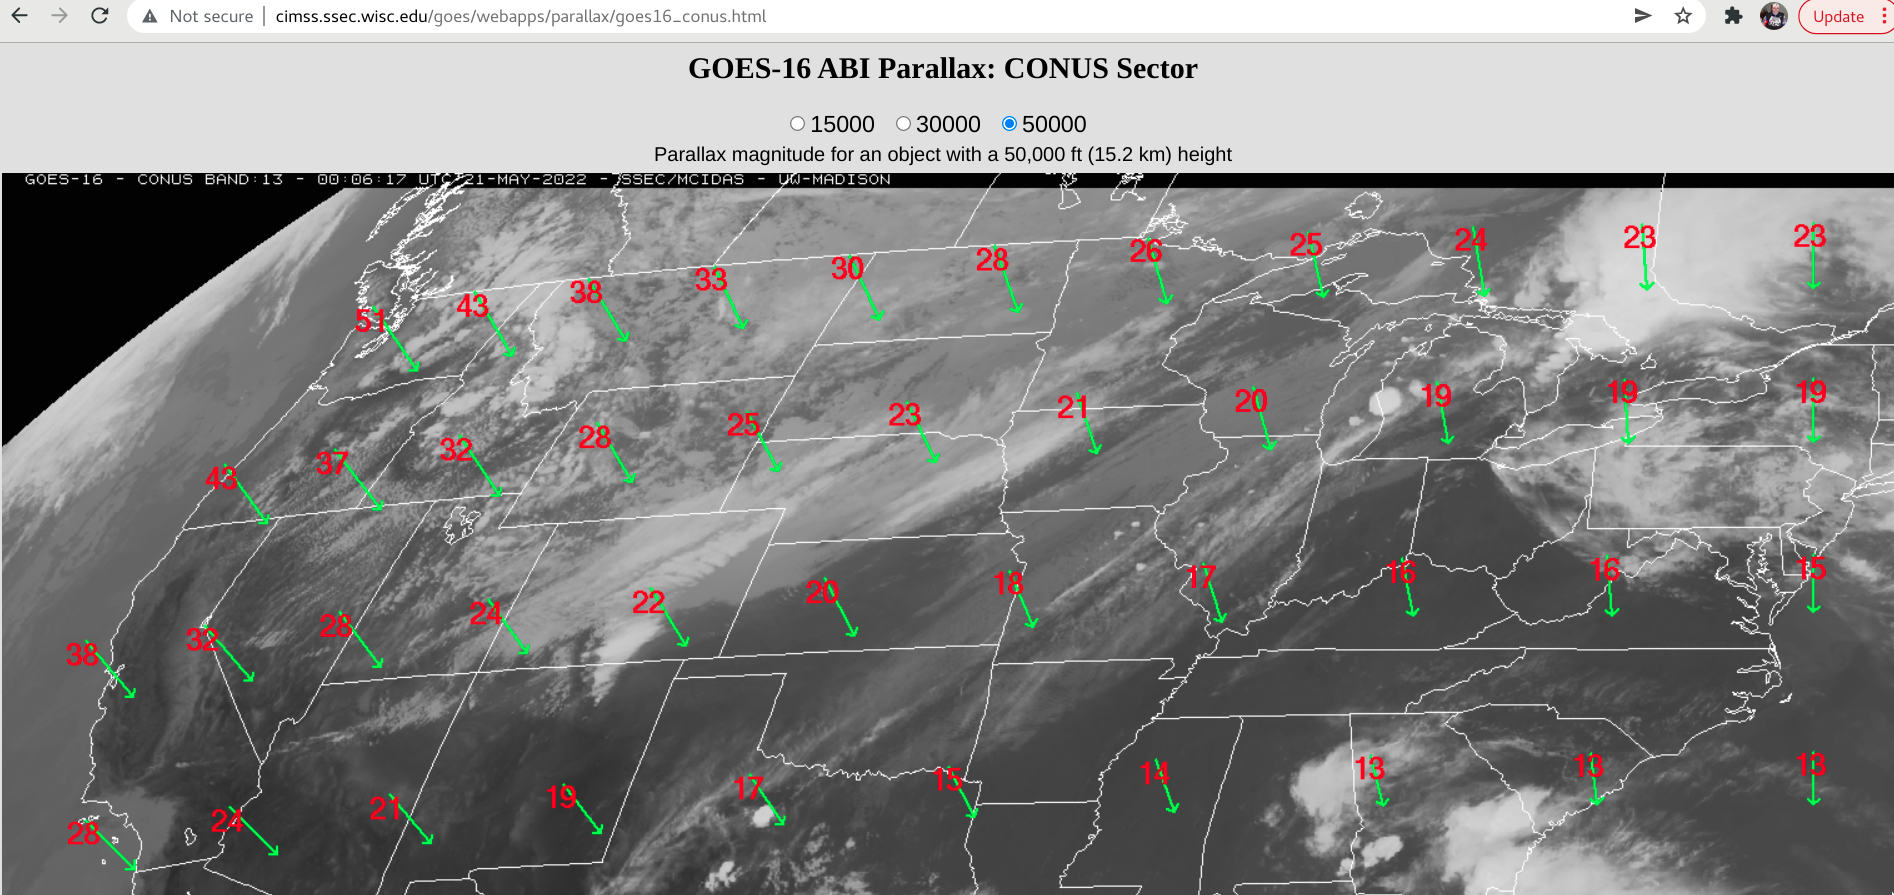
GOES-16 parallax correction direction (green) and magnitude (in km, red) [click to enlarge]
As the thunderstorms initially began moving inland from Lake Michigan and producing damaging winds near the northwest coast of Lower Michigan, a toggle between Suomi-NPP VIIRS True Color RGB and Infrared Window (11.45 µm) images (below) revealed overshooting tops with infrared brightness temperatures as cold as -87.7oC (darker purple enhancement).

Suomi-NPP VIIRS True Color RGB and Infrared Window (11.45 µm) images, with Local Storm Reports plotted in blue [click to enlarge]
View only this post
Read Less


