
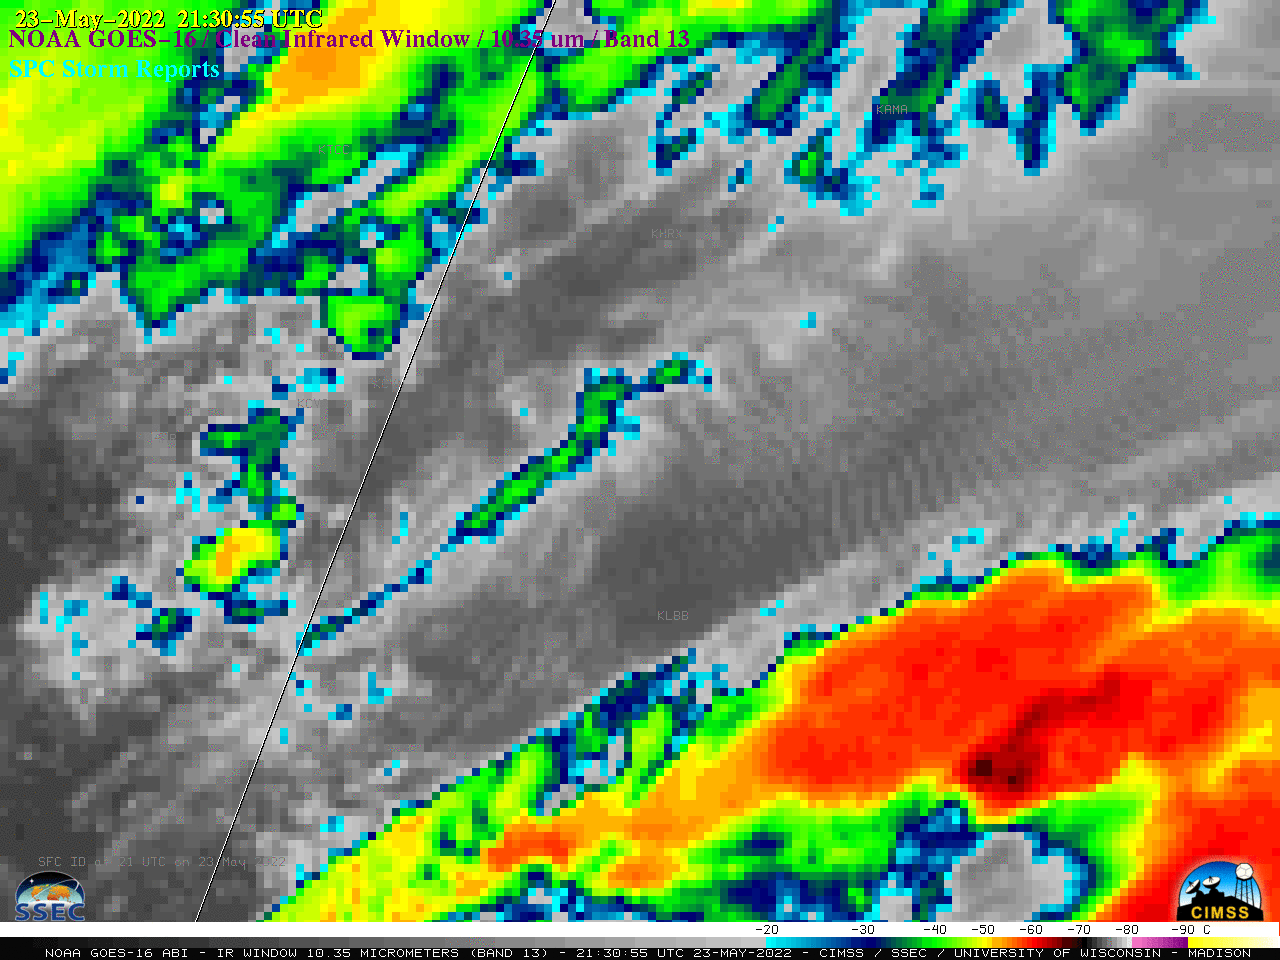
GOES-16 (GOES-East) Upper-level Water Vapor (6.2 µm) images with pilot reports of turbulence — with and without contours of RAP40 model Maximum Wind Speed (above) showed an anomalously-deep 500 hPa trough over the Southern Plains, where there was an anomalously-strong 250 hPa jet streak developing along its forward (eastern) edge. A number of pilot reports of moderate to... Read More
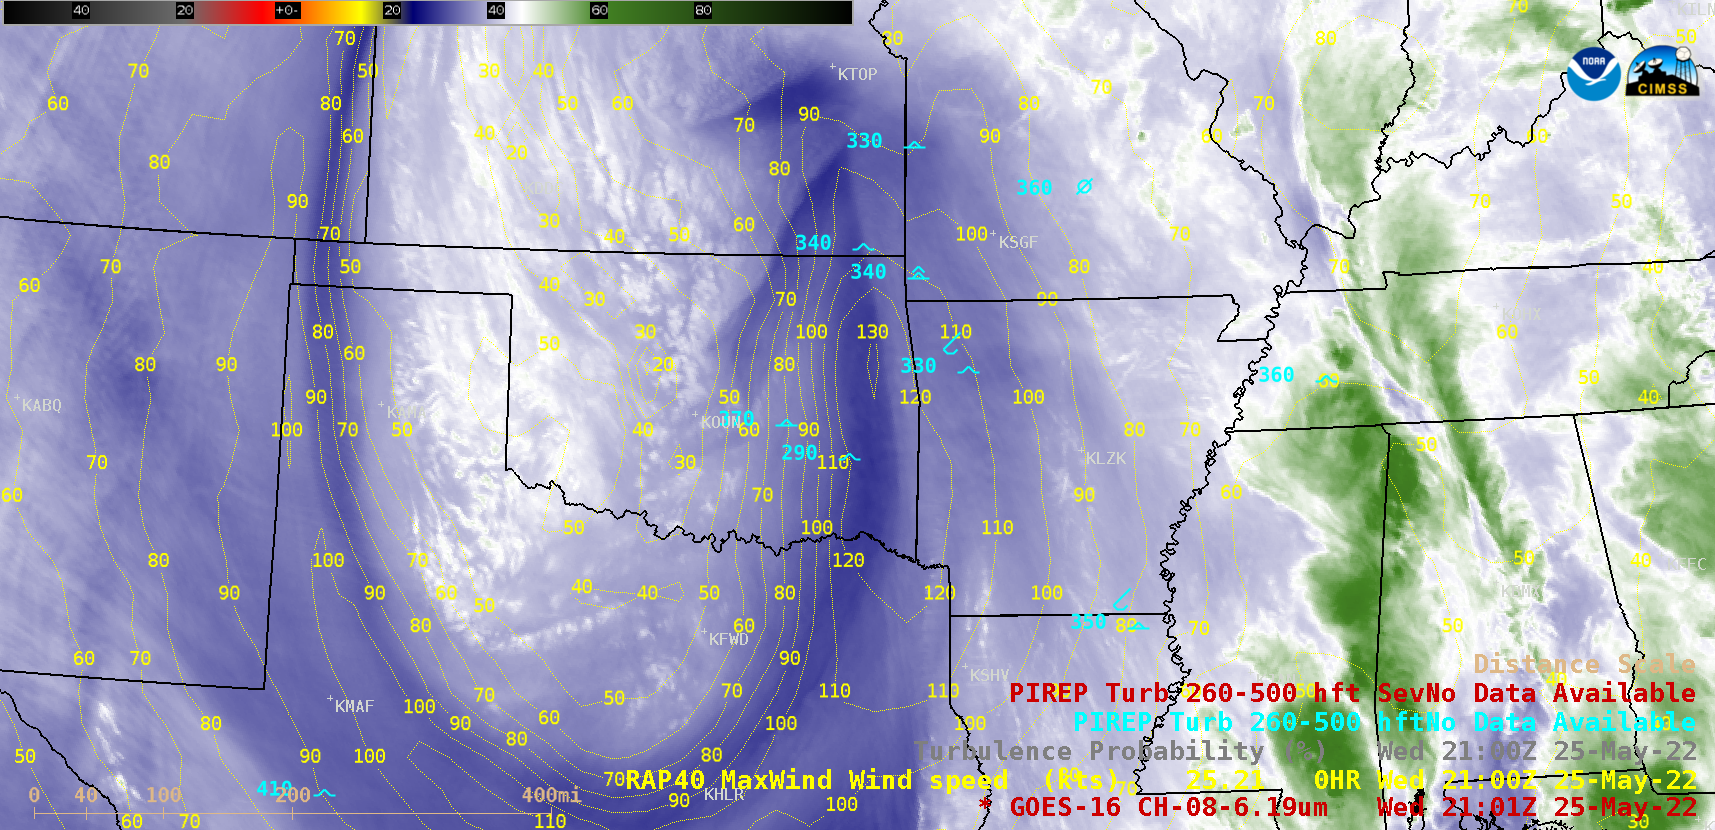
GOES-16 Upper-level Water Vapor (6.2 µm) images, with pilot reports of turbulence (cyan) — with and without contours of RAP40 model Maximum Wind Speed (yellow) [click to play animated GIF | MP4]
GOES-16
(GOES-East) Upper-level Water Vapor (
6.2 µm) images with pilot reports of turbulence — with and without contours of RAP40 model Maximum Wind Speed
(above) showed an
anomalously-deep 500 hPa trough over the Southern Plains, where there was an
anomalously-strong 250 hPa jet streak developing along its forward (eastern) edge. A number of pilot reports of moderate to severe turbulence were seen within the exit region of this jet streak.
In GOES-16 Upper-level Water Vapor images with and without an overlay of a Turbulence Probability product (below), higher probability values were apparent in the area near/along the axis of the 250 hPa jet streak (and the related pilot reports of turbulence).
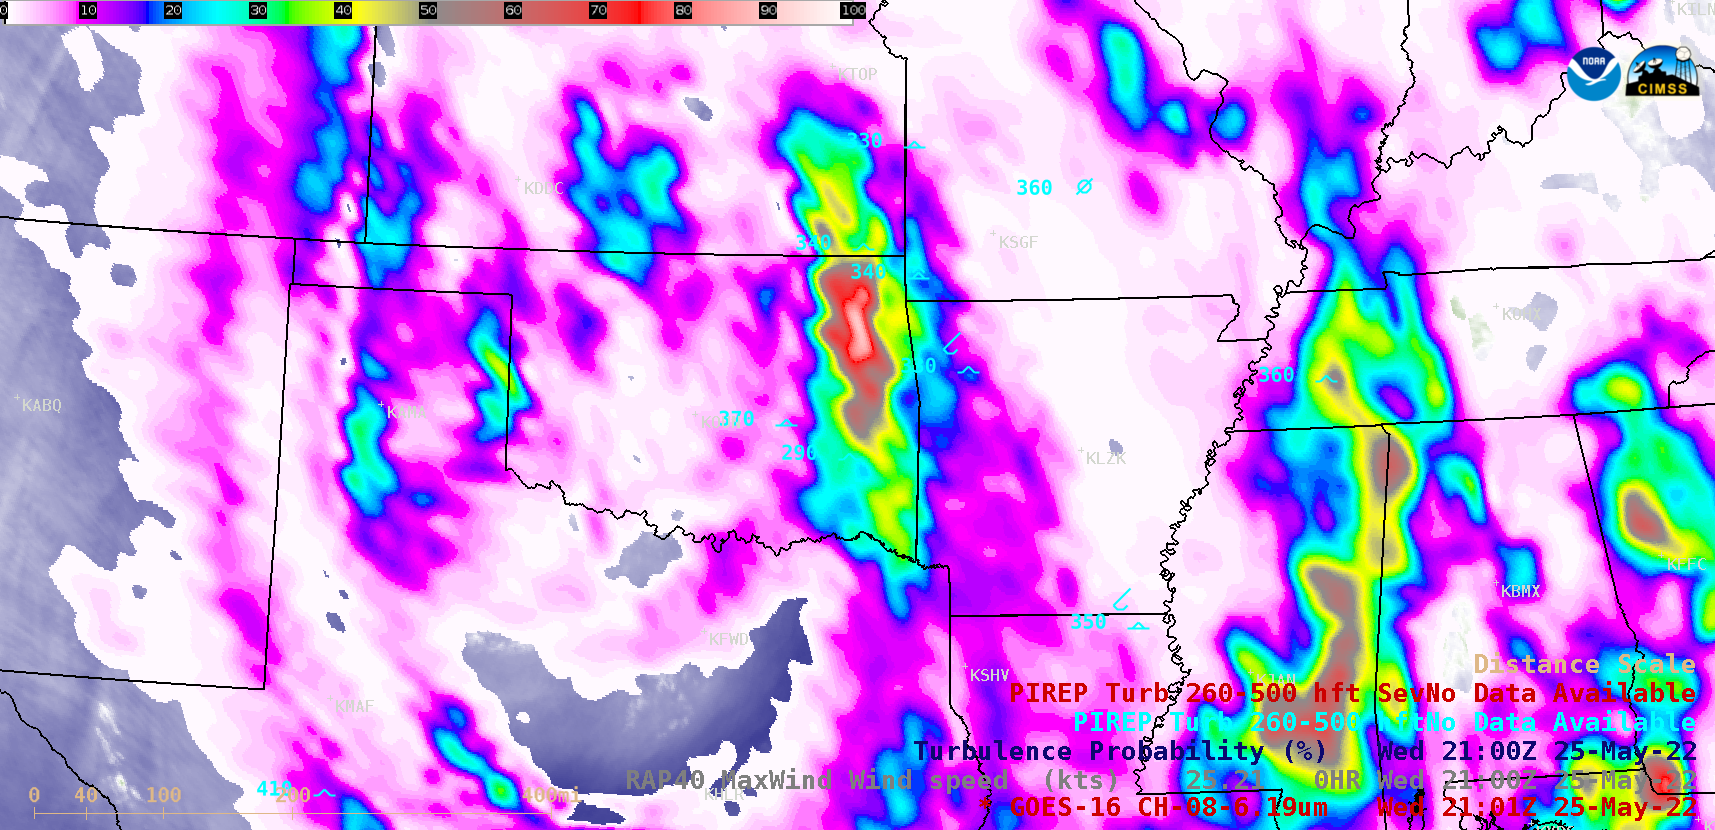
GOES-16 Upper-level Water Vapor (6.2 µm) images, with pilot reports of turbulence (cyan) — with and without an overlay of Turbulence Probability [click to play animated GIF | MP4]
View only this post
Read Less


