This website works best with a newer web browser such as Chrome, Firefox, Safari or Microsoft
Edge. Internet Explorer is not supported by this website.
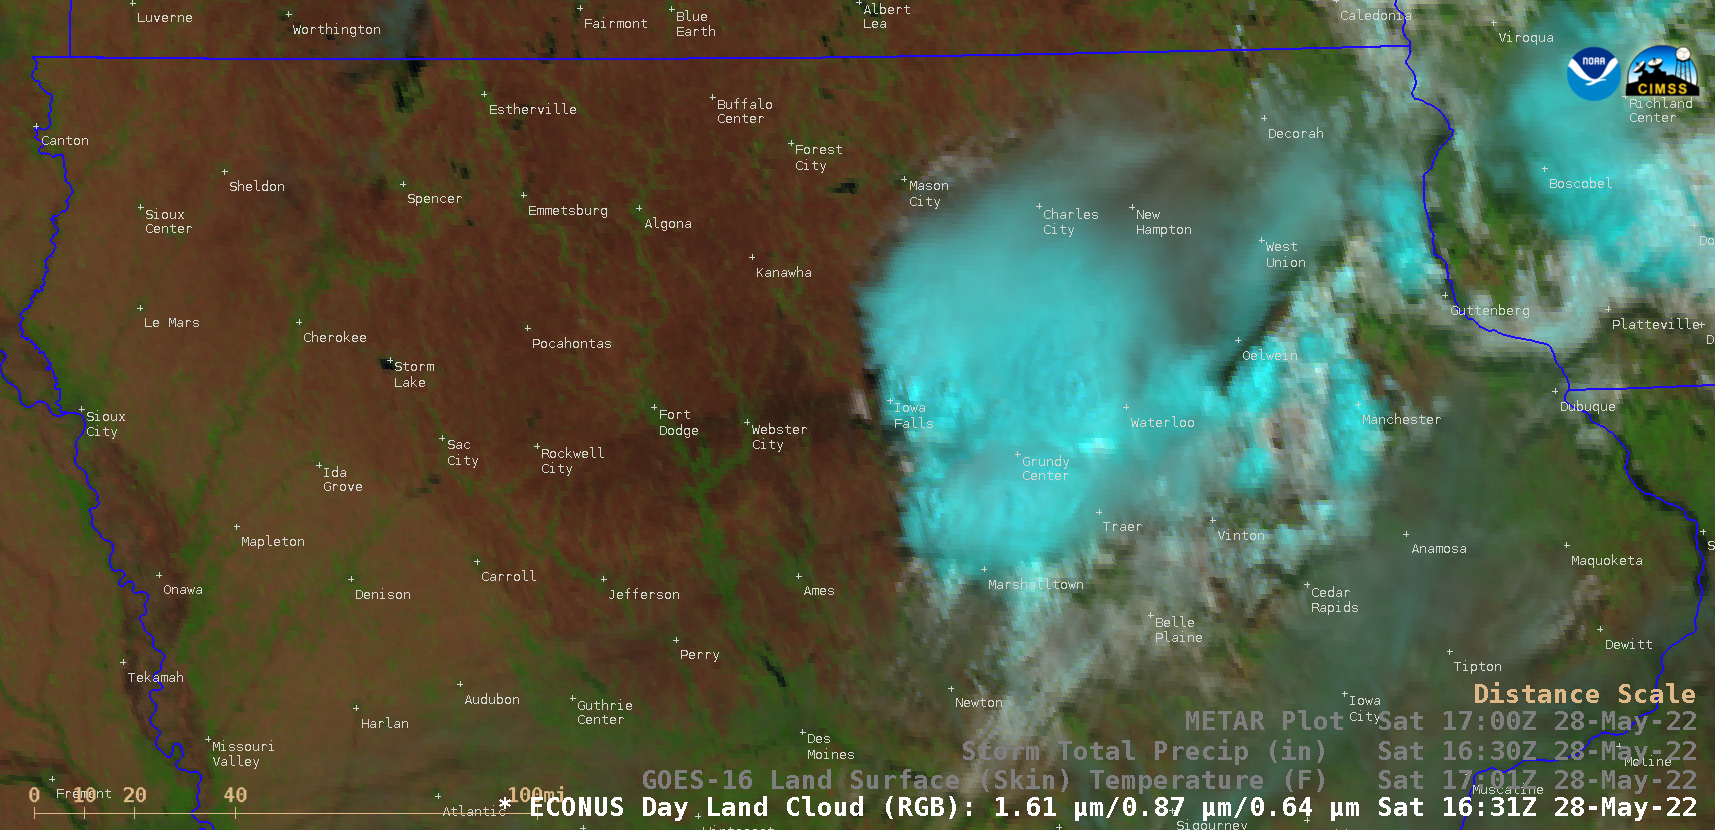
A sequence of GOES-16 (GOES-East) Day Land Cloud RGB images and radar-estimated Storm Total Precipitation (above) revealed a west-to-east oriented swath of wet soil (darker shades of brown) created by thunderstorms that moved across central Iowa on 28 May 2022. Radar-estimated precipitation associated with the swath was generally 1 inch or less.Given the fairly light... Read More
GOES-16 Day Land Cloud RGB images, with radar-estimated Storm Total Precipitation [click to play animated GIF | MP4]
A sequence of GOES-16 (GOES-East)Day Land Cloud RGB images and radar-estimated Storm Total Precipitation (above) revealed a west-to-east oriented swath of wet soil (darker shades of brown) created by thunderstorms that moved across central Iowa on 28 May 2022. Radar-estimated precipitation associated with the swath was generally 1 inch or less.
Given the fairly light precipitation amounts, the swath of wet soil dried rather quickly due to warm and windy conditions across the area (below).
GOES-16 Day Land Cloud RGB images, with plots of hourly surface reports [click to play animated GIF | MP4]
Comparisons of GOES-16 Day Land Cloud RGB, Land Surface Temperature (LST) and radar-estimated Storm Total Precipitation at 1601 UTC and 1701 UTC (below) showed that the swath of moist soil exhibited LST values in the upper 60s to low 70s F (shades of green), in contrast to upper 80s to low 90s F (shades of orange) across adjacent areas of dry soil.
GOES-16 Day Land Cloud RGB, Land Surface Temperature and radar-estimated Storm Total Precipitation at 1601 UTC [click to enlarge]
GOES-16 Day Land Cloud RGB, Land Surface Temperature and radar-estimated Storm Total Precipitation at 1701 UTC [click to enlarge]
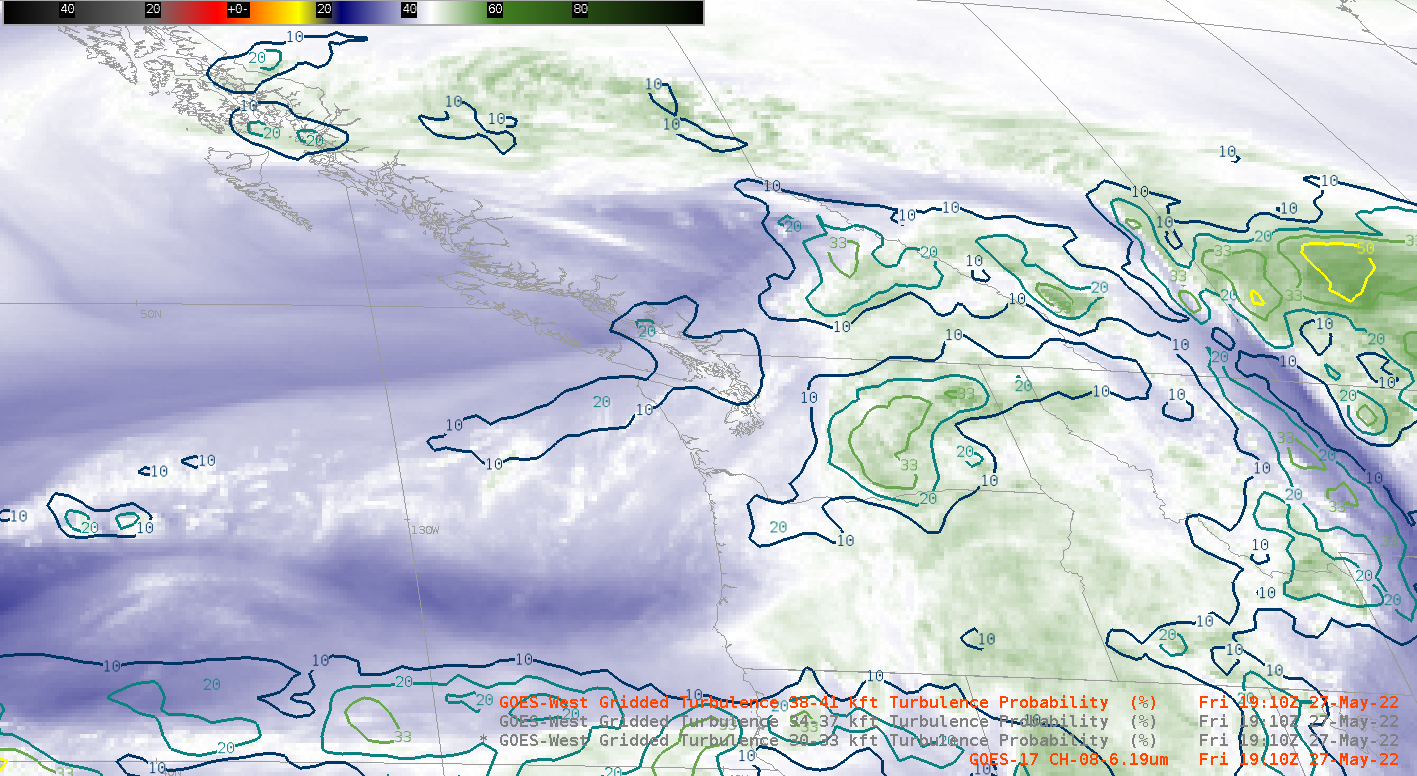
At the request of AWC and WFO HNL, the turbulence probability fields for AWIPS have been changed (the website — here — is unaltered as of now). The turbulence probability is split into 3 layers that are each 3000 feet thick: 30000-33000 feet ; 34000-37000 feet; 38000-41000 feet. The AWIPS plugin... Read More
GOES-17 Band 8 (“Low-level water vapor”) Infrared (6.19 µm) fields, 1910 UTC on 27 May 2022, along with derived Turbulence Probability for 30-33 kft, 34-37 kft, 38-41 kft (Click to enlarge)
At the request of AWC and WFO HNL, the turbulence probability fields for AWIPS have been changed (the website — here — is unaltered as of now). The turbulence probability is split into 3 layers that are each 3000 feet thick: 30000-33000 feet ; 34000-37000 feet; 38000-41000 feet. The AWIPS plugin used to display the information has also been changed, so that contours are drawn, as shown above. This will affect AWIPS performance if you are displaying the full disk imagery (because there are so many contours to draw!)
One of the products being demonstrated at Hazardous Weather Testbed the week of 23-27 May 2022 was a modeling suite that includes Polar Hyperspectral Soundings (PHS, using IASI/AMSU data from the MetopB and MetopC Satellites as well as CrIS/ATMS data Suomi/NPP and NOAA-20) that are associated with Advanced Baseline Imager... Read More
One of the products being demonstrated at Hazardous Weather Testbed the week of 23-27 May 2022 was a modeling suite that includes Polar Hyperspectral Soundings (PHS, using IASI/AMSU data from the MetopB and MetopC Satellites as well as CrIS/ATMS data Suomi/NPP and NOAA-20) that are associated with Advanced Baseline Imager (ABI) information on GOES-16 through a process known as Data Fusion (or PHSnMWnABI). Previous blog posts on PHSnMWnABI modeling can be viewed here. The summary slides below (courtesy Bill Smith, Sr) show summary results from the four days, including Storm reports from 23 May, 24 May, 25 May and 26 May. Some of the slides are followed by AWIPS screen captures from the various days. Forecasters at HWT were typically active from 1800-2300 UTC on each day.
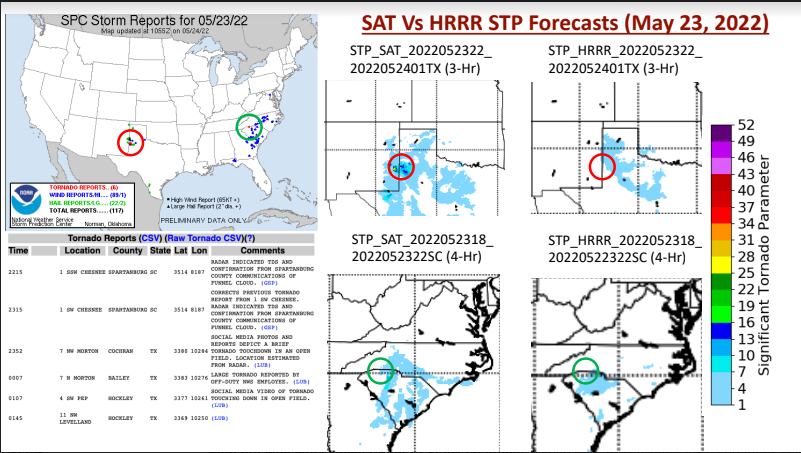
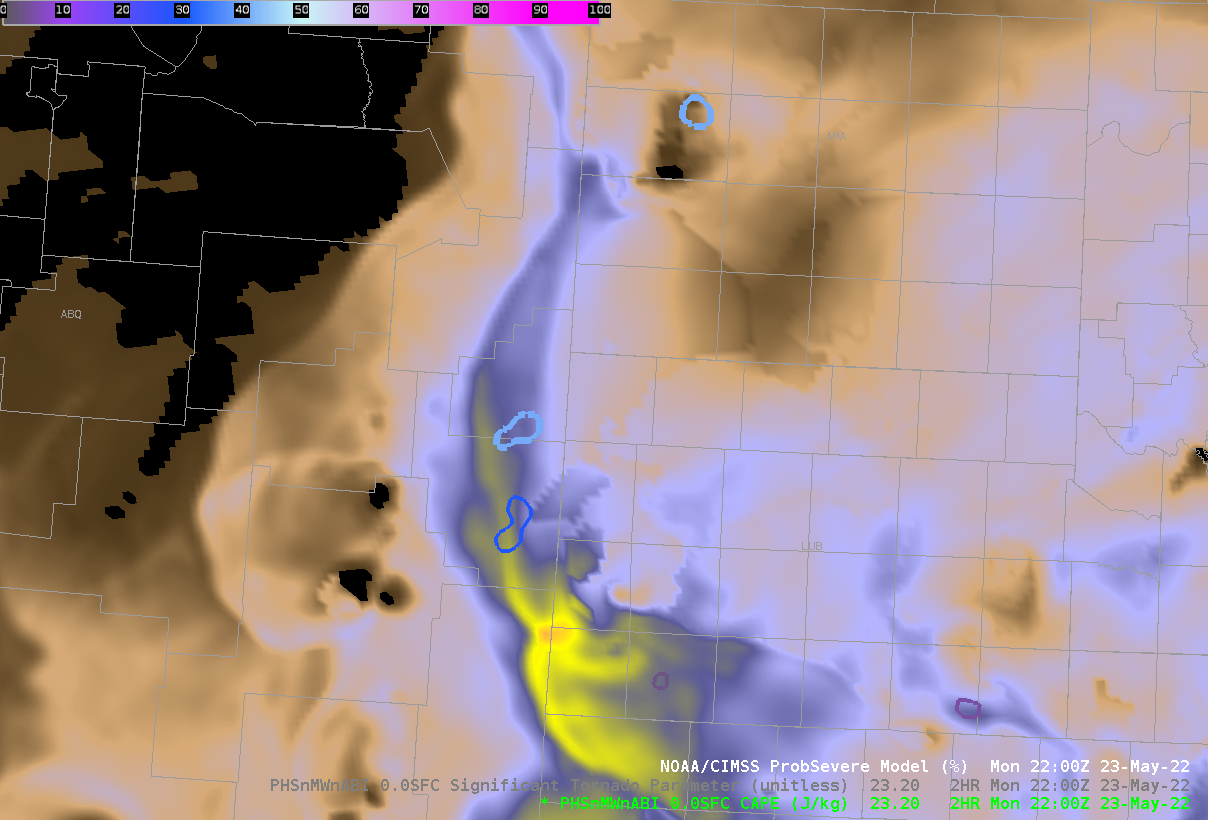
SPC Storm Reports from 23 May 2022, along with Significant Tornado Parameter predictions from PHSnABI (left) and HRRR (right) valid at 2200 UTC (Click to enlarge); HWT CWAs on this day were WFO LBB and WFO CAE.ProbSevere (Version 3) polygons superimposed on top of a 2-hour forecast of Most Unstable CAPE, all valid at 2200 UTC on 23 May 2022 (Click to enlarge)
A consistent feature of PHSnABI model output of instability over the course of the week was the accurate depiction of instability corridors, as shown above. Invariably, convection formed along the edge of those corridors, on the instability gradient.
Tuesday 24 May 2022
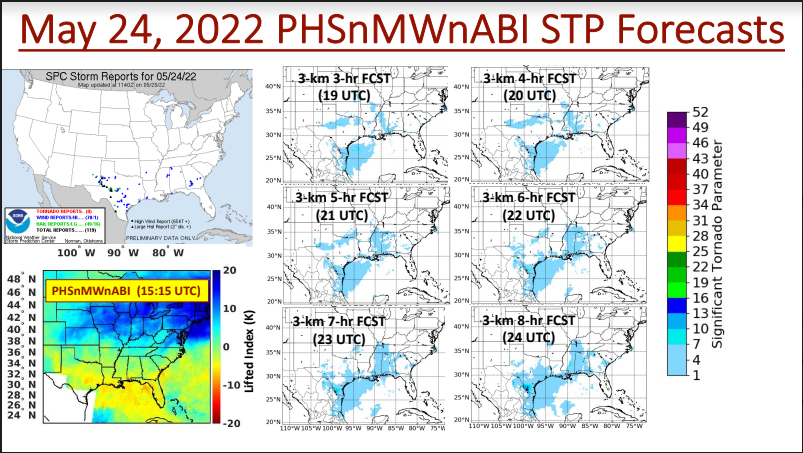
Without doubt this was the most active day of for HWT during this week (CIMSS Blog Post). Forecast offices were WFO MAF, WFO SJT and WFO FWD, a string of offices from the High Plains of Texas to north-central Texas. (Here’s the 1630 UTC Convective Outlook from 24 May.) The summary slide for this day is below. The 3 WFOs chosen this day are aligned with the corridor of stronger SigTor over the high plains of central Texas.
SPC Storm Reports from 24 May 2022, along with Most Unstable CAPE predictions at 1500 UTC (left) and SigTor predictions from PHSnABI, forecast times as indicated (right) (Click to enlarge); HWT CWAs on this day were WFO MAF, SJT and FWD.
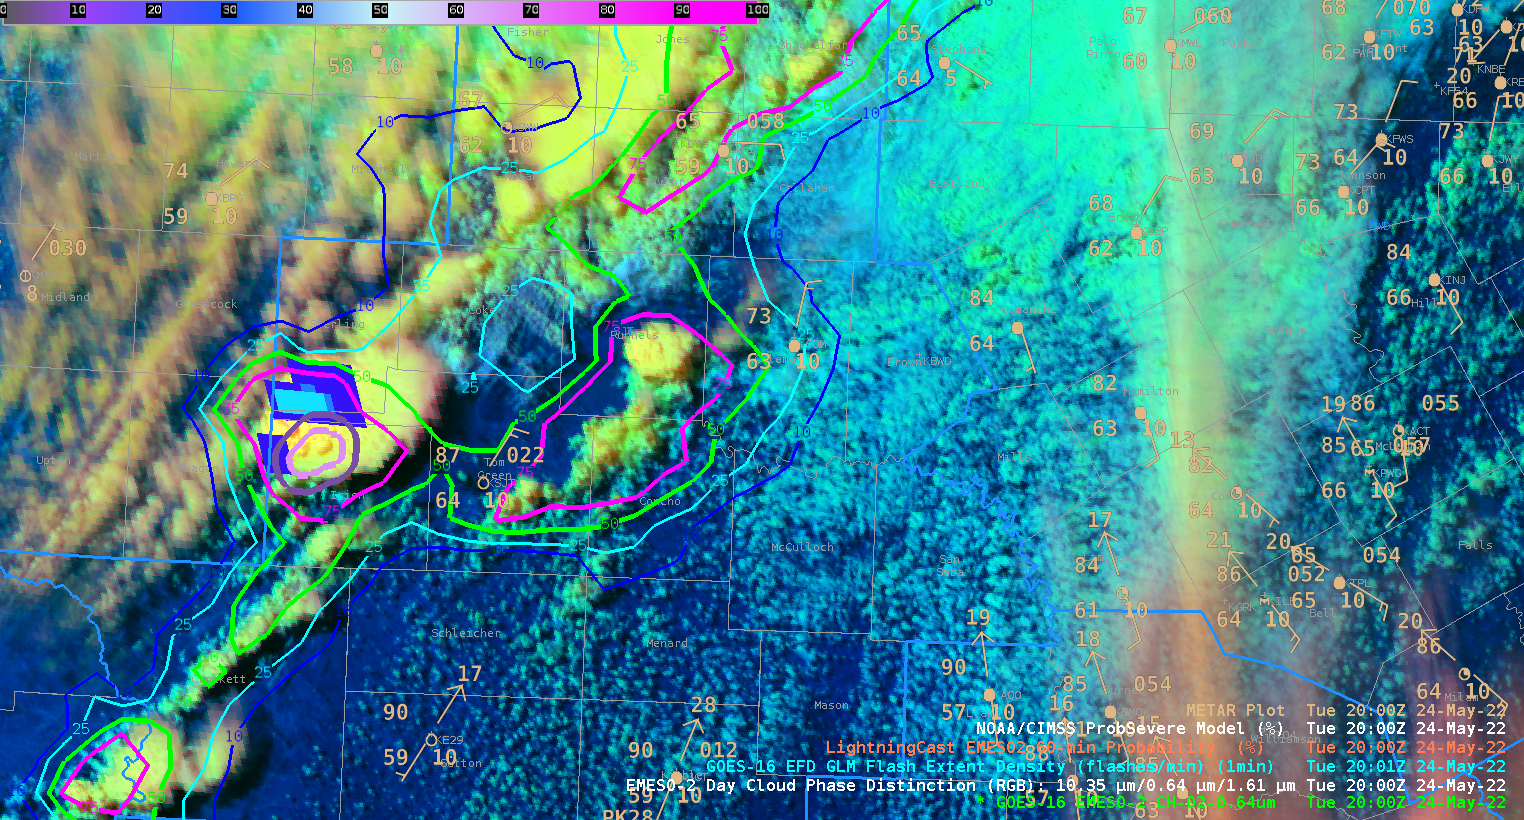
For much of this day, I was watching what the forecasters assigned to the San Angelo WFO looked at. The image below shows the Day Cloud Phase Distinction as the strongest storm was starting to form near Tom Green County in west Texas (the country with the odd panhandle!). ProbSevere LightningCast nicely outlines the regions where initiation is ongoing; note the highest values are in a region with lightning observations. That strongest cell is at the intersection of two boundaries, one from southwest to northeast through the developing cell, and one extending east-northeastward from the cell (there’s a prominent wind-shift from southwest to northeast across the line).
Day Cloud Phase Distinction at 2000 UTC on 24 May 2022, along with GLM Observations of Flash Extent Density, and contours of ProbSevere LightningCast (Click to enlarge)
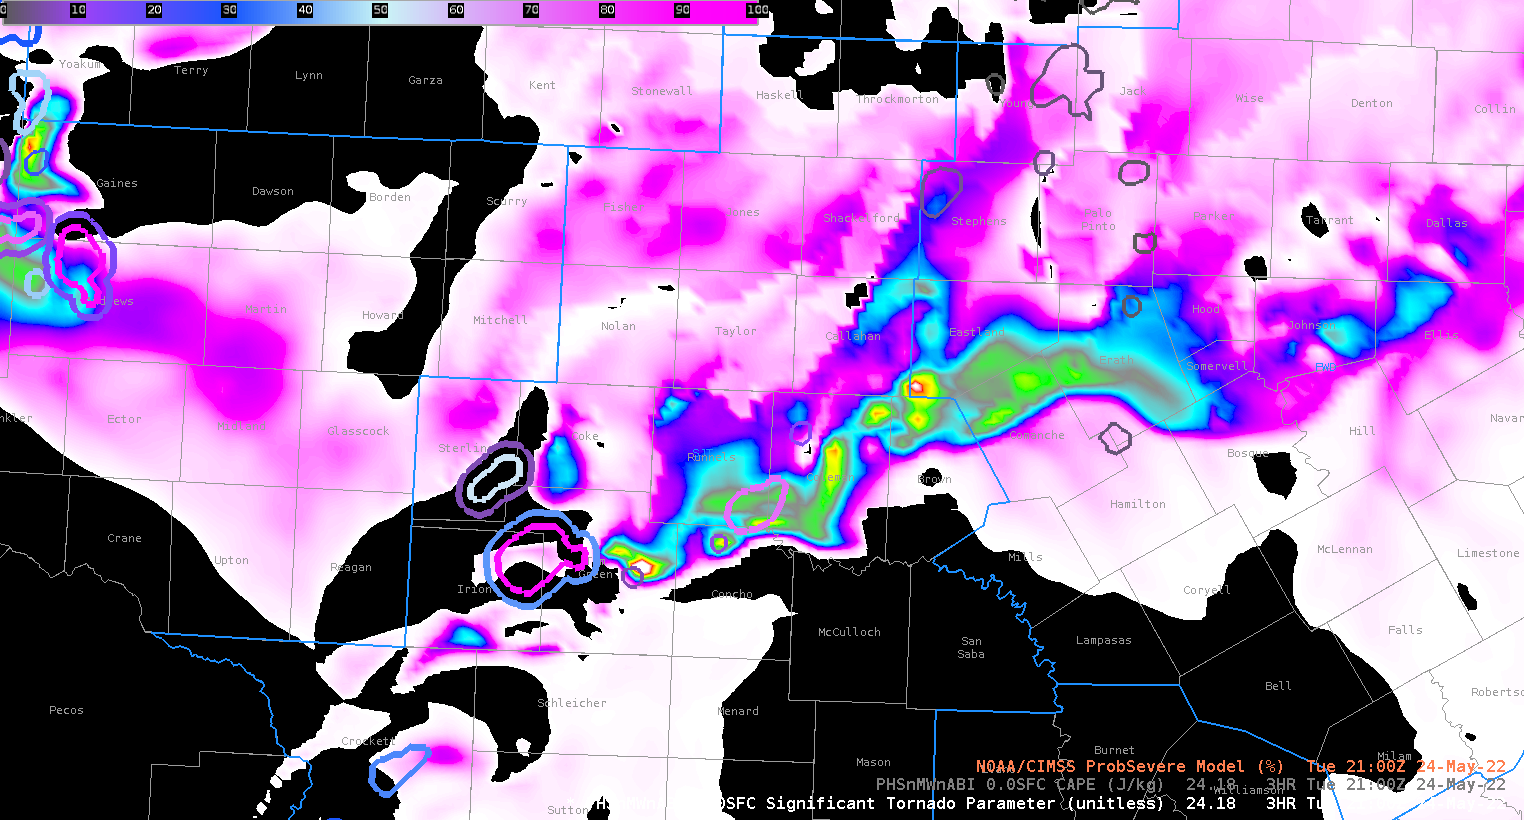
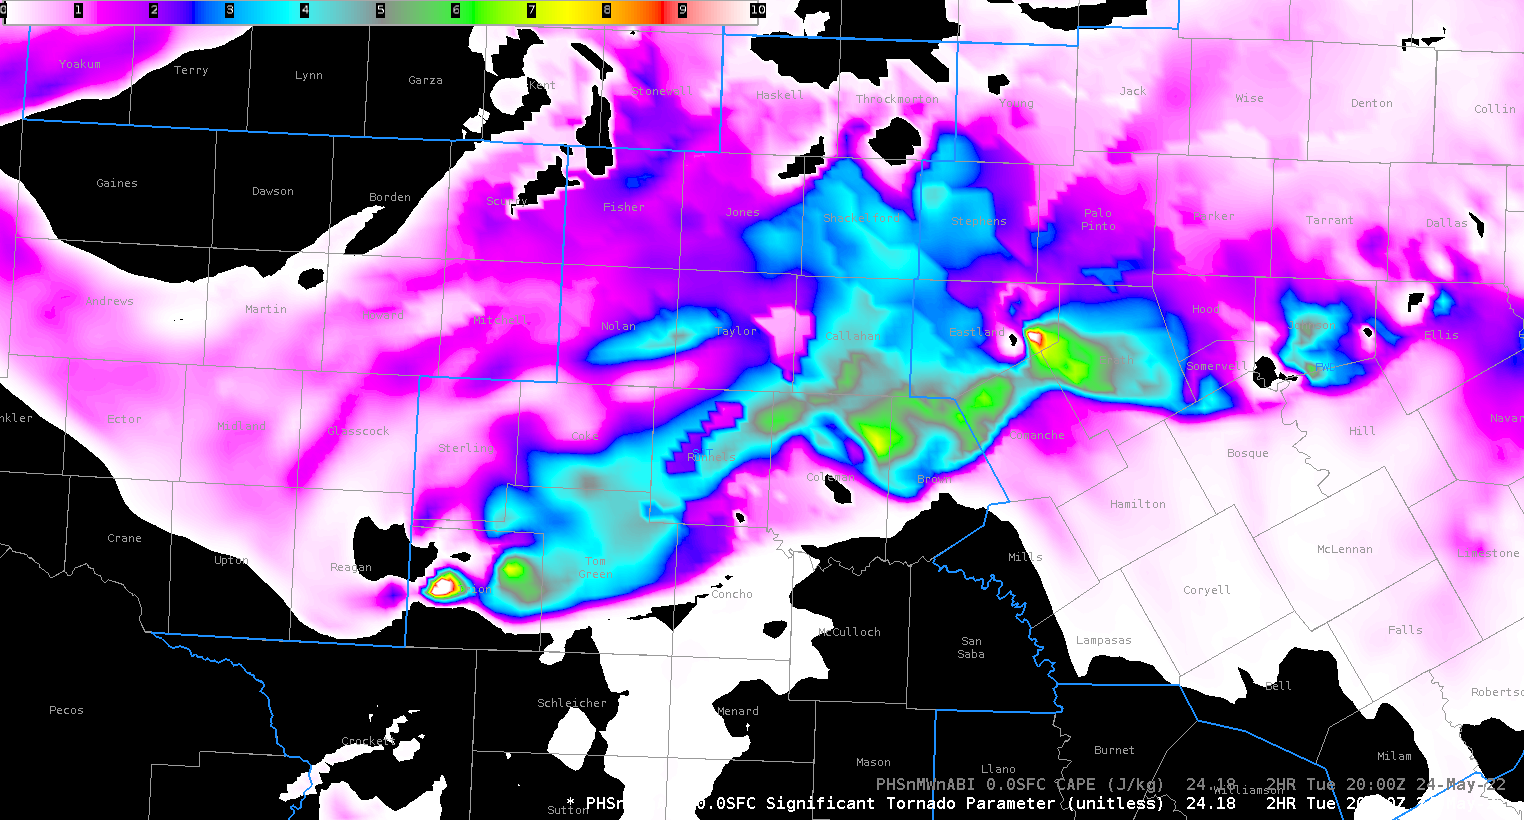
The two-hour forecast from PHSnABI, below, shows largest STP very close to where the convection is shown to be forming above. Note also how STP extends to the east-northeast along the boundary. STP more than once gave a 2-h forecast showing largest values very close to where convection developed, as in this case.
PHSnABI 2-h forecast of Significant Tornado Parameter valid at 2000 UTC on 24 May 2022 (click to enlarge)3-h forecast of SigTor from PHSnABI, valid at 2100 UTC on 24 May 2022, along with ProbSevere object polygons valid at the same time (click to enlarge)
The largest hail (grapefruit-sized) was reported at 2118 UTC in Tom Green County, shortly after the image above. As on the 23 May, ProbSevere contours are aligned along the PHSnABI parameter, in this case SigTor. The image below shows SigTor predicted values enhanced along the boundary to the east-northeast of the strong storm that by 2200 UTC was east of Tom Green County.
GOES-16 Day Cloud Phase Distinction from 2200 UTC on 24 May 2022, and a 2-h forecast SigTor valid at 2200 UTC (Click to enlarge)
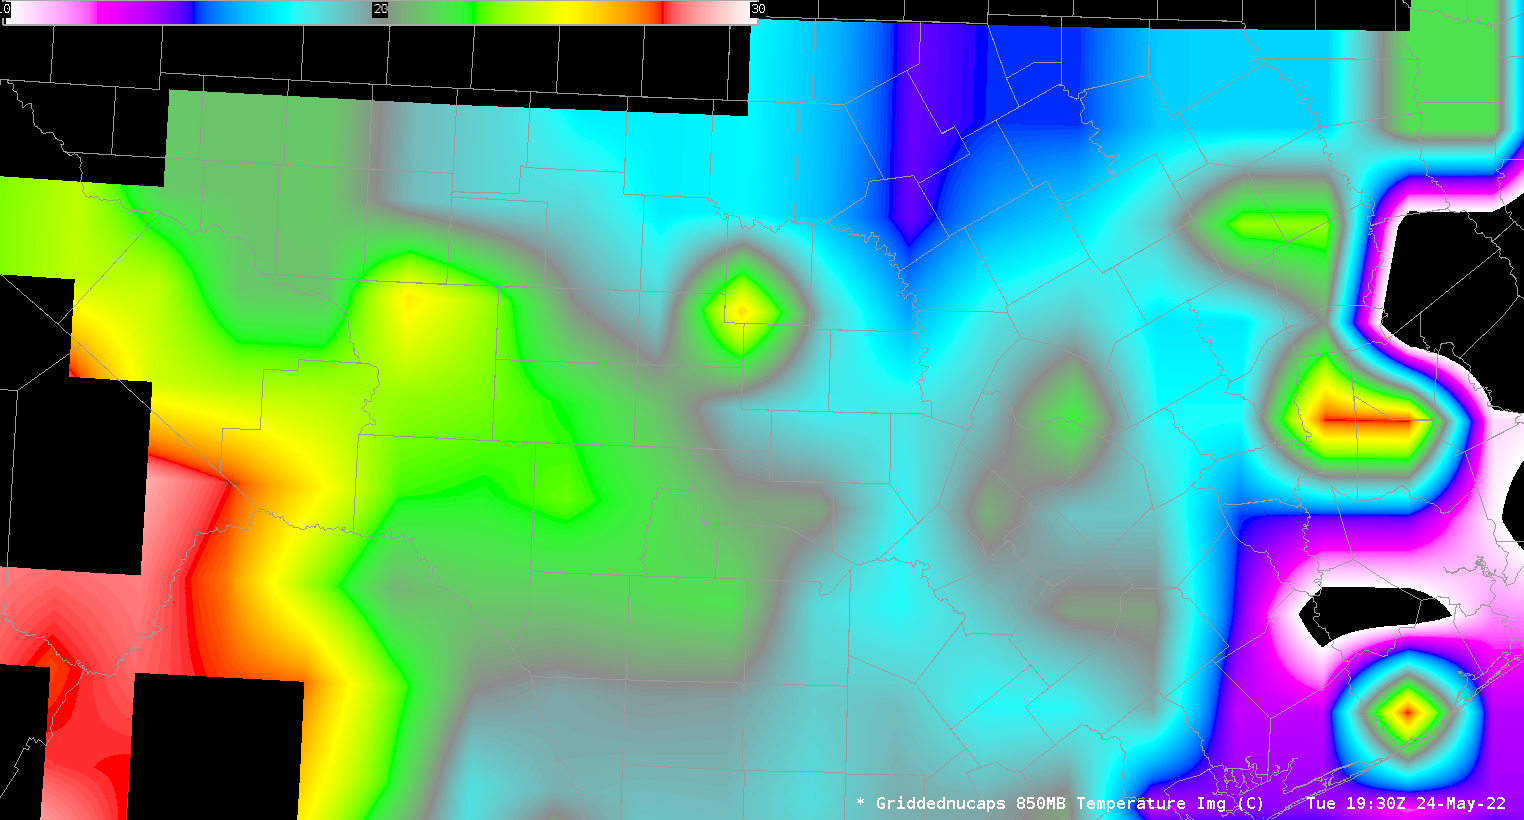
Gridded NUCAPS estimates of 850-mb temperature for this event over the high plains of Texas are shown below. 850-mb temperature north of Tom Green County are around 17oC; to the south they are closer to 23oC: this was a region of warm air advection.
850-mb Temperature fields, gridded from NOAA-20 NUCAPS observations, 1930 UTC on 24 May 2022 (click to enlarge)
Wednesday, 25 May 2022
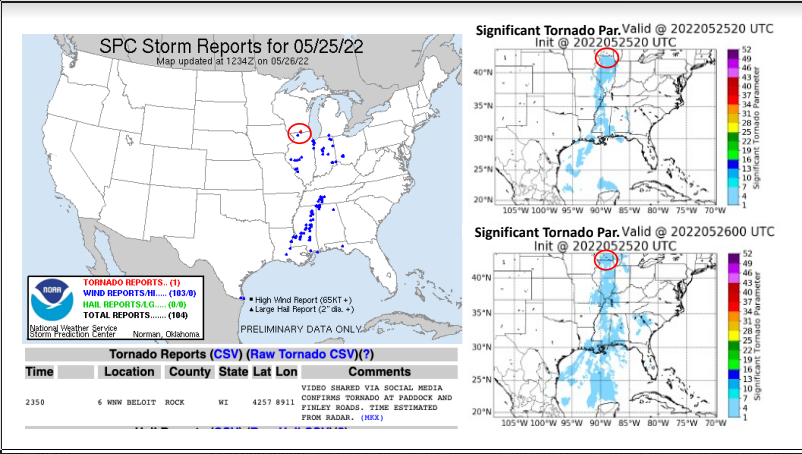
The summary slide for this date, a much quieter day than 24 May 2022, is shown before (1630 UTC Convective Outlook). WFOs chosen on this day were WFO IWX, WFO MEG and WFO BHM. The tornado on this day (Storm Reports; summary from WFO MKX) was an EF-0 over southern Wisconsin, and SigTor at 2000 UTC on 25 May 2022, and a 4-h forecast valid at 0000 UTC on 26 May 2022 are shown below.
SPC Storm Reports from 25 May 2022, and SIgTor initial field (2000 UTC on 25 May) and the 4-h forecast, valid at 0000 UTC on 26 May (Click to enlarge)
I spent a lot of time on this day watching ProbSevere LightningCast fields over WFO BMX for a simulated Decision Support event related to lightning that is detailed by the NWS forecaster participant here. LightningCast probabilities over Lake Lurlene stayed at/below 50% while western convection moved around the event. Finally, convection moved in from the southwest. An accurate estimate of lightning offset occurred. I was also looking at a line of agitated cumulus moving toward Memphis from western Arkansas that ultimately did nothing. There were subtle features in both PHSnABI CAPE fields and SigTor fields that aligned with this line.
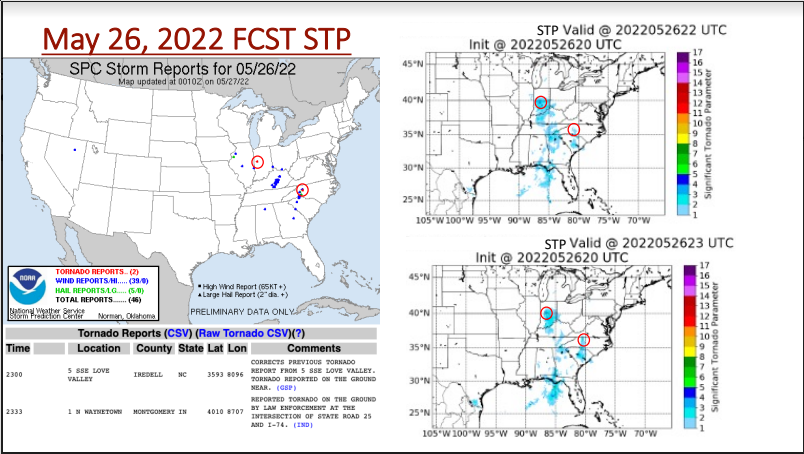
Storm Reports from 26 May 2022 (left) and SigTor forecasts at 2200 and 2300 UTC on 26 May 2022 (click to enlarge)
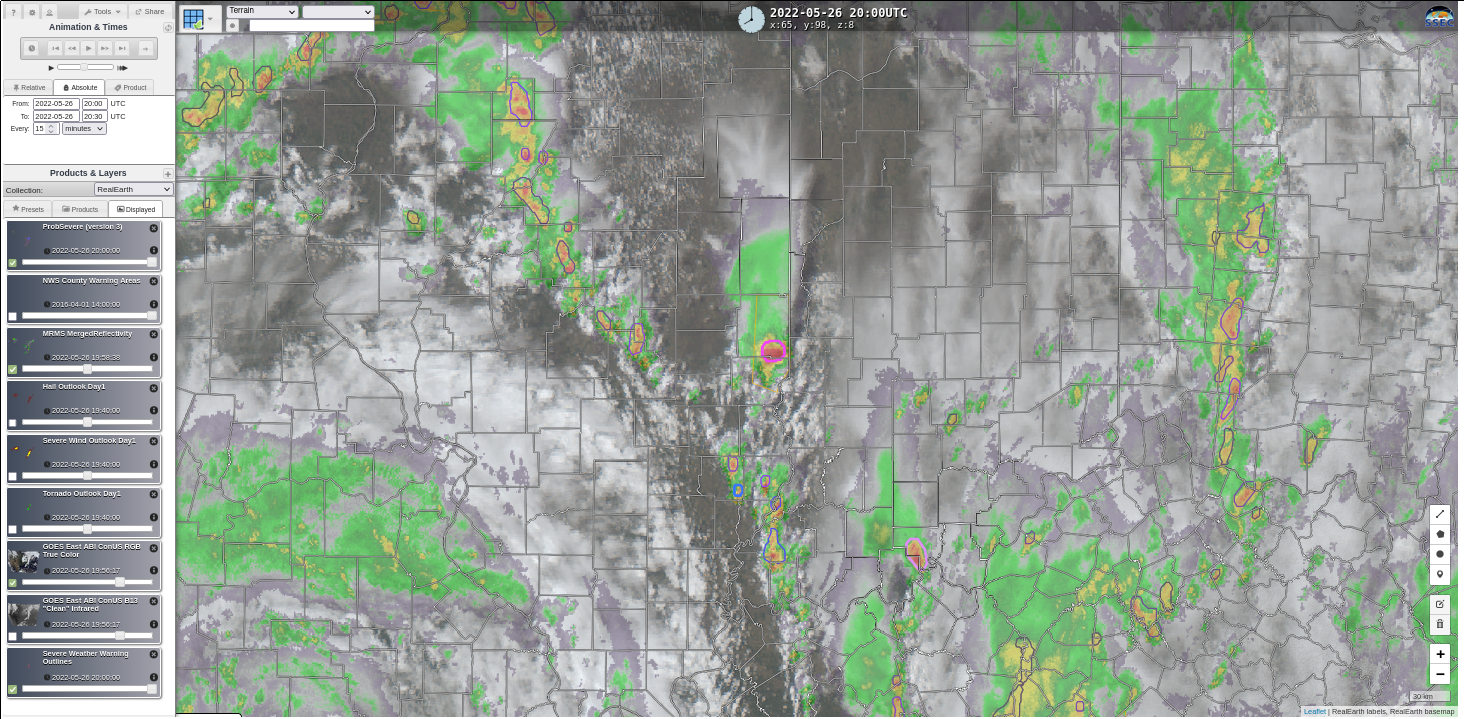
I spent the beginning of the exercise with the Lincoln, IL forecasters; that CWA had mostly sunny skies. The toggle below shows the Day Cloud Phase Distinction at 1900 UTC (shortly after we all started looking at the weather) with the PHSnABI predictions of SigTor and CAPE. The PHSnABI forecasts definitely capture the back edge of the convective field over central Iowa. The strongest cell, isolated within the warm air over the eastern part of the ILX CWA, did eventually become warned as it moved along the border Indiana (Here’s a ProbSevere image from 2000 UTC — from this website). The readout of values within the radar-based object (from this website) are here. SPC storm reports show severe wind at 1947 UTC.
GOES-16 Day Cloud Phase Distinction, 1900 UTC on 26 May 2022, PHSnABI 1-h forecast of SIgTor (overlain with ProbSevere shapefile contours) and PHSnABI 1-h forecast of MUCAPE, both forecasts valid at 1900 UTC on 26 May 2022
Animations of both MUCAPE and SigTor from PHSnABI show features lifting northeastward, as observed.
In the Louisville CWA, widespread clouds were present. The PHSnABI estimate for CAPE, below, show a skinny region of CAPE entering the western part of the CWA.
PHSnABI estimates of CAPE from a forecast initialized at 1800 UTC, 00h – 03h forecasts (Click to enlarge)
I was curious about the region of no CAPE that develops in the northwestern part of WFO LMK at 2000 UTC (which apparently moves out of the LMK CWA by 2100 UTC). Is that convection that the PHSnABI has captured? The toggle below compares the GOES-16 Band 13 imagery, regional radar imagery (overlain with ProbSevere contours) and the predicted MUCAPE at 2000 UTC. The region of very small CAPE is very close to the observed radar convection. (It’s not quite so close in the 2100 UTC imagery.) Note that radar convection has a ProbSevere contour (here’s the image from the ProbSeverev3 website, with the readout for the radar object here), but the presentation from the GOES-16 imagery is not eye-catching. ProbSevere can help focus a forecaster’s attention.
Predicted MUCAPE at 2000 UTC (a 2-h forecast initialized at 1800 UTC), GOES-16 Band 13 Imagery, and regional radar valid at 2000 UTC (Click to enlarge)
The Hazardous Weather Testbed continues on 6 June. Kudos to Kevin Thiel, the SPC Satellite Liaison for GOES-R, and to Kristin Calhoun, SPC, for coordinating this event! For more blog posts from HWT, check out this blog!
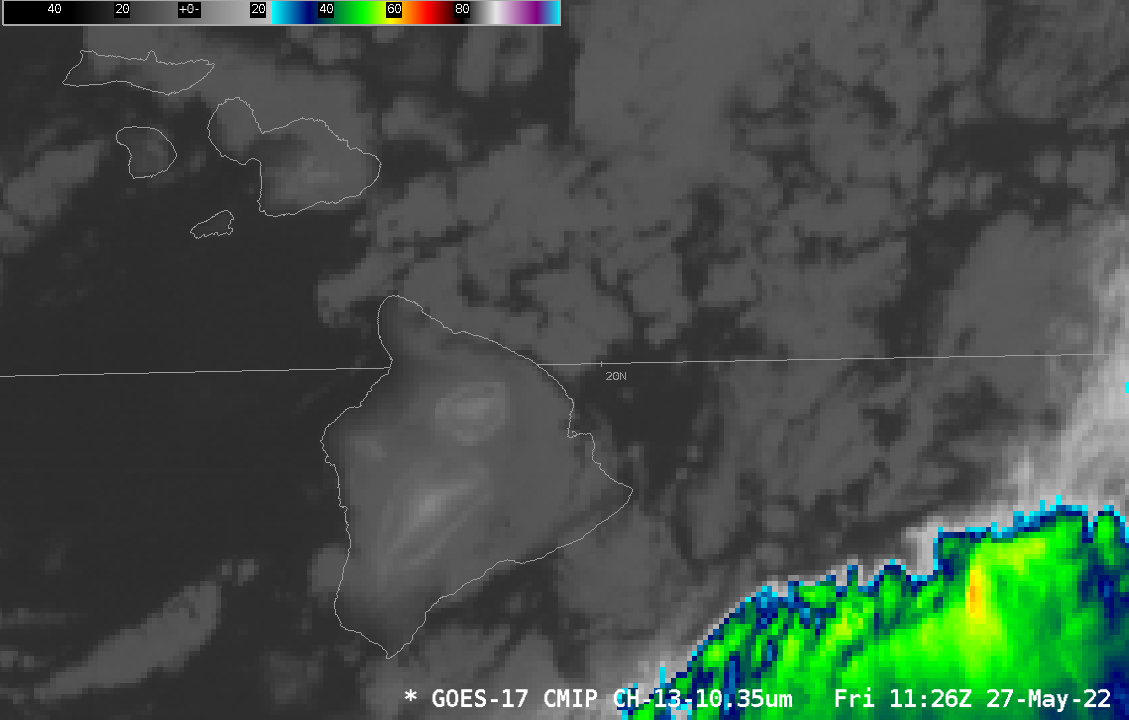
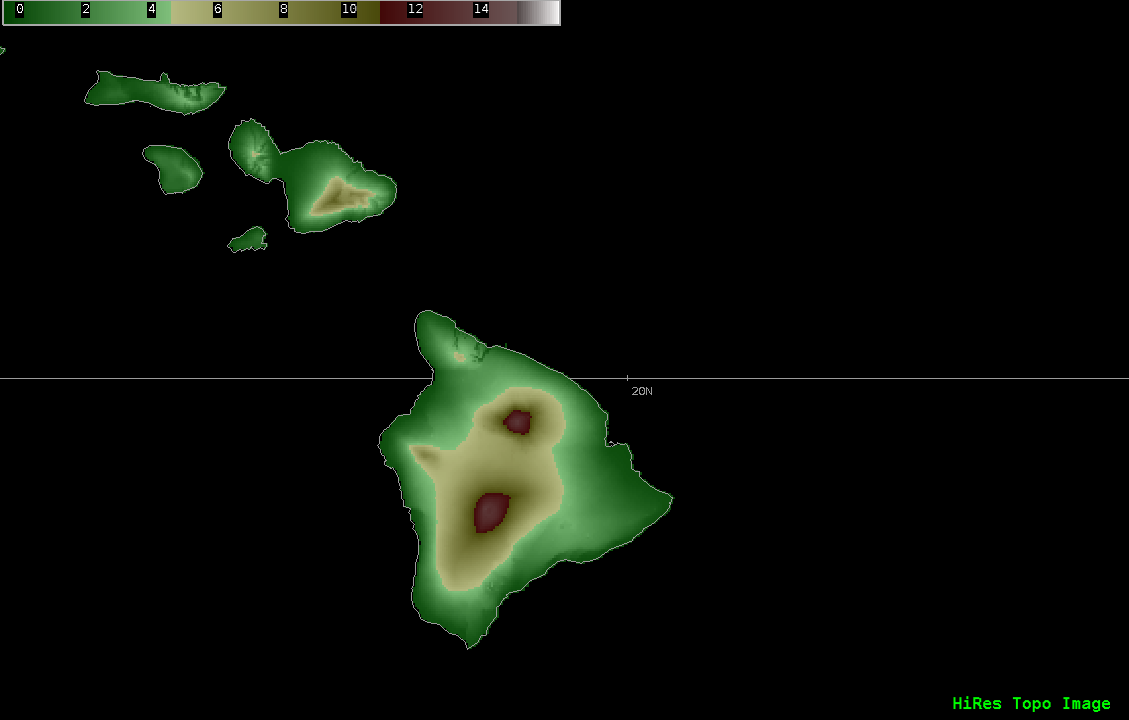
An animation of GOES-17 Band 13 10.3 µm infrared imagery, above, shows the development of concentric circles of cold, warm, cold and warm surrounding the high peaks of the island of Hawai’i (Click here to see a topographic view). The warmth apparent around the peaks at the start of the... Read More
GOES-17 Clean Window Infrared (10.3 µm) imagery, 0301 – 1601 UTC 27 May 2022 (click to enlarge)
An animation of GOES-17 Band 13 10.3 µm infrared imagery, above, shows the development of concentric circles of cold, warm, cold and warm surrounding the high peaks of the island of Hawai’i (Click here to see a topographic view). The warmth apparent around the peaks at the start of the animation above (dark in the enhancement chosen) suggests that the peaks are peeking through a stratus deck; the toggle below between sunset and sunrise imagery (the sunrise imagery has been brightened considerably) shows that clouds dissipated overnight.
GOES-17 Band 2 (0.64 µm) visible imagery at 0401 UTC and 1601 UTC on 27 May 2022 (Click to enlarge)
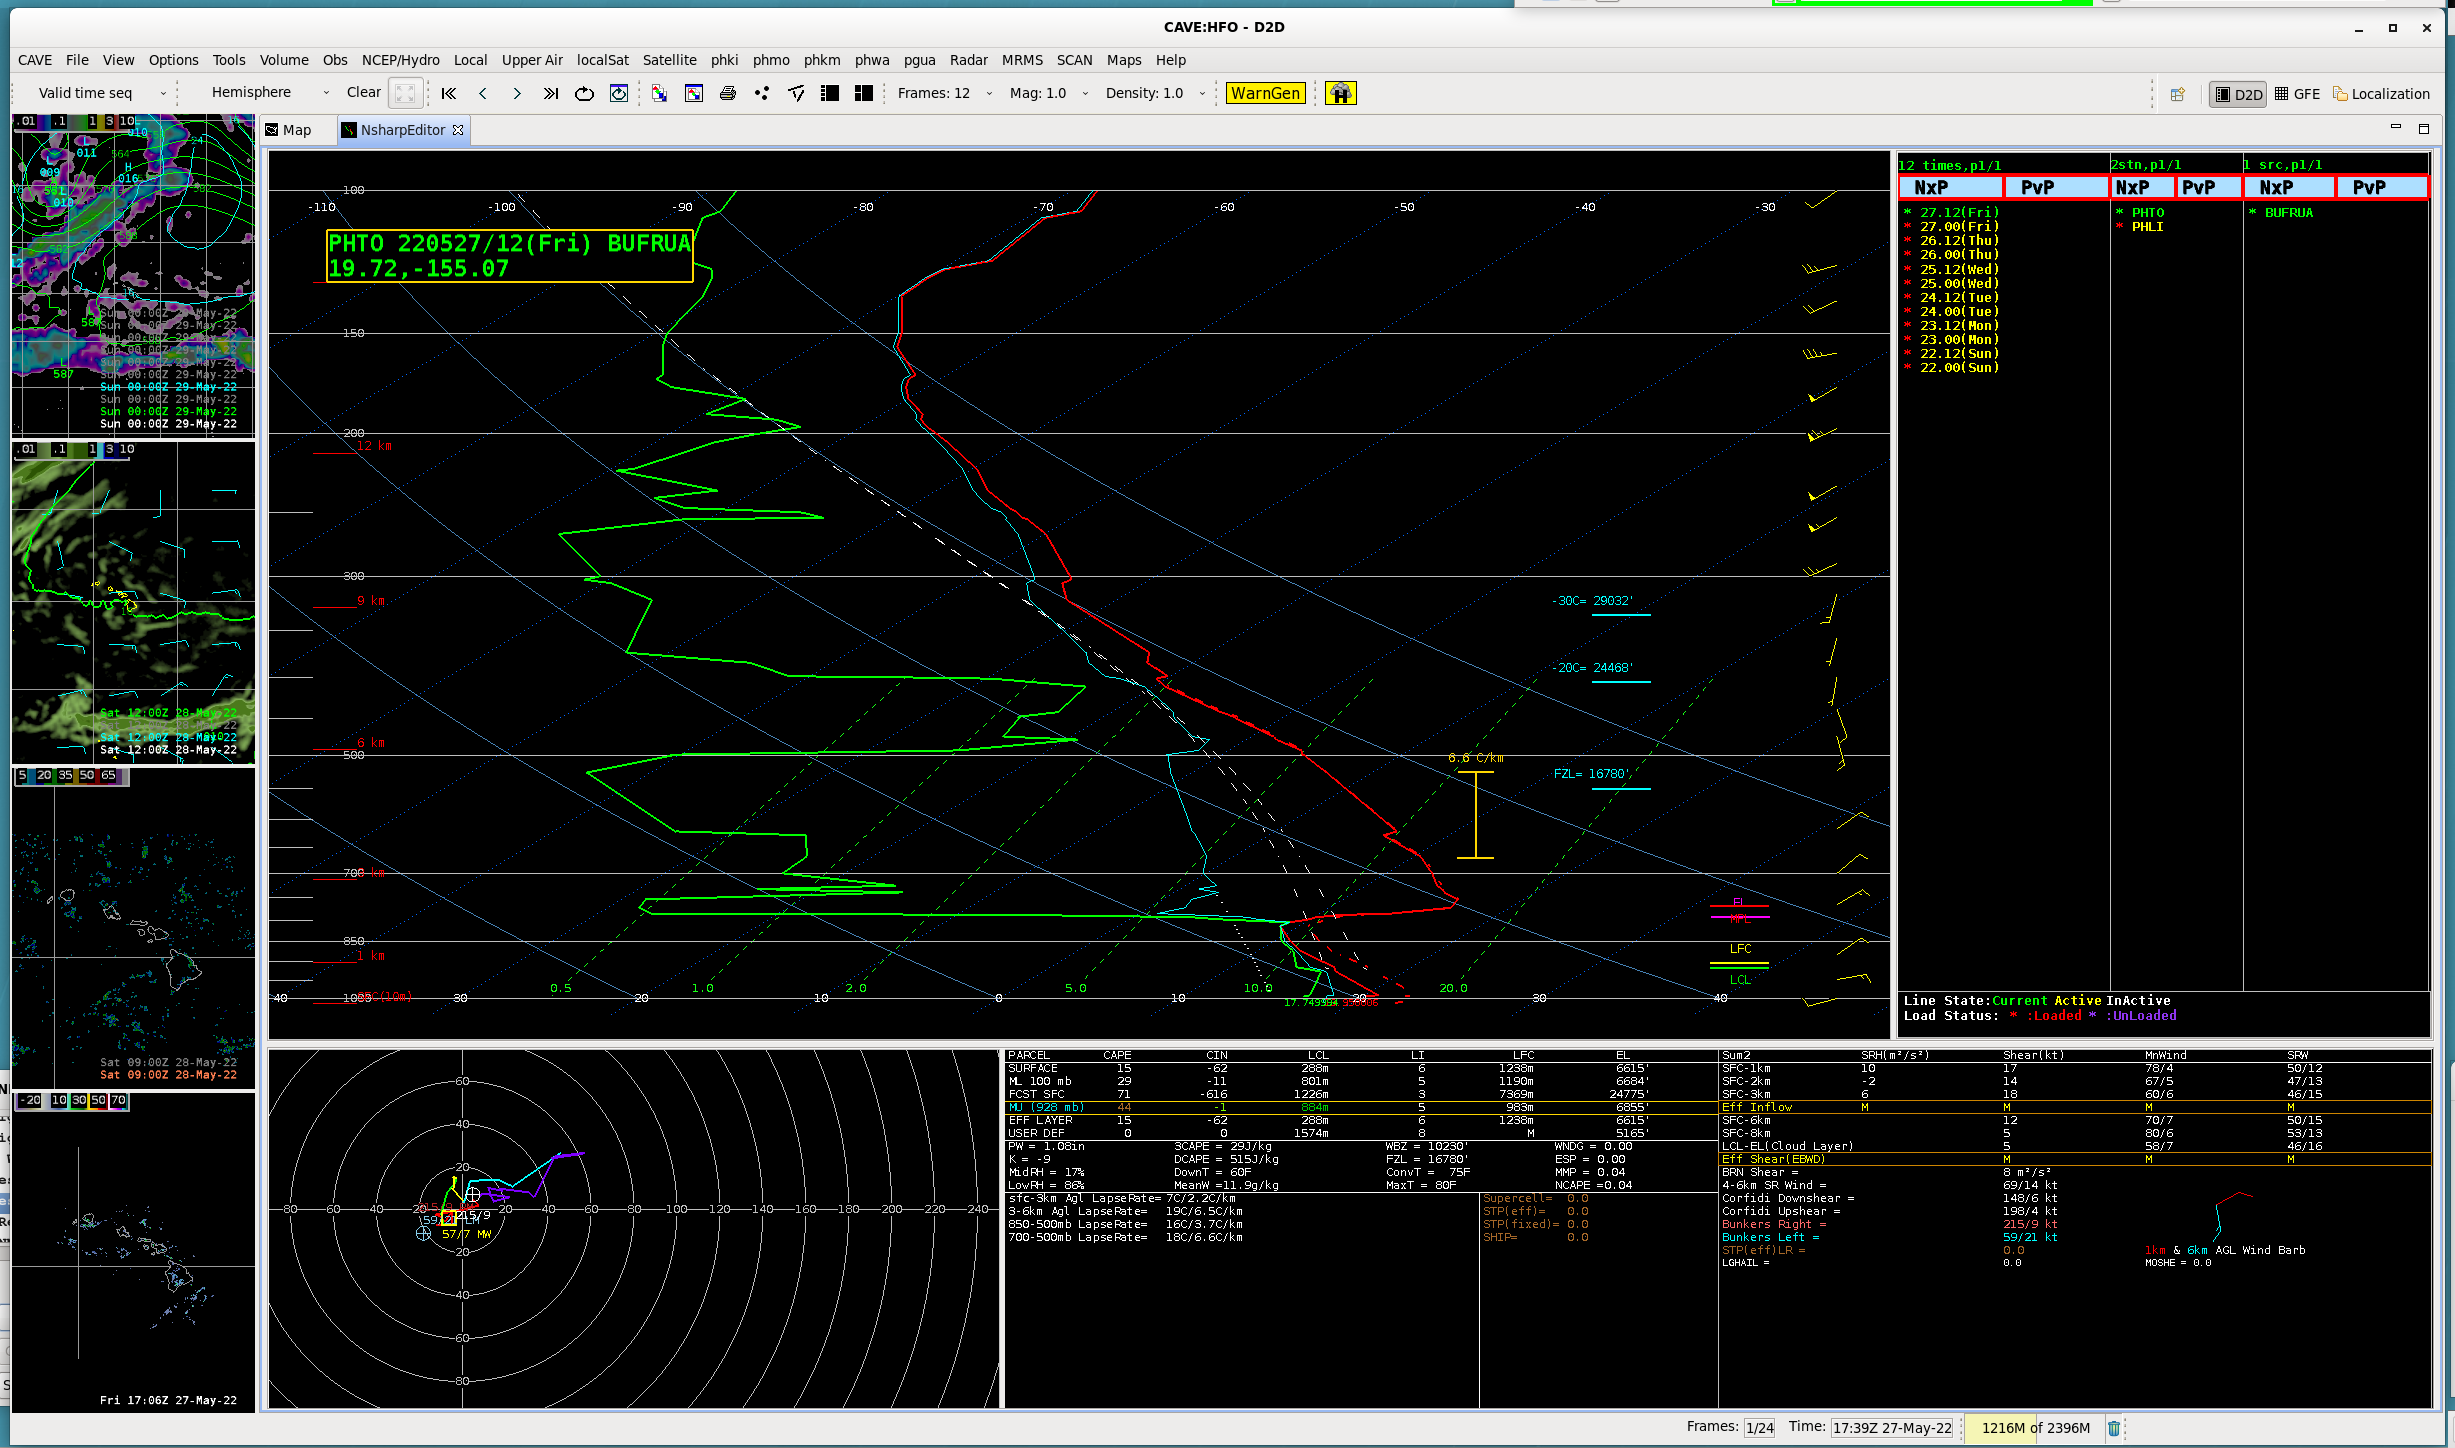
The animation below shows brightness temperatures sampled through the rings at 1121 UTC surrounding Mauna Kea. Mountain-top temperatures are sub-freezing, warming to around 5oC/41oF just off the peak, before cooling again to 2oC/36oF and then warming to 5+oC/41+oF farther down the slope. This interesting behavior results from a combination of cooling in the presence of an inversion, and cooling interrupted by the presence of cloudiness. The 1200 UTC sounding from Hilo, on the eastern part of the north coast of Hawai’i, is shown here (courtesy K. Kodama, WFO HNL).
GOES-17 Infrared Band 13 imagery (10.3 µm) at 1121 UTC on 27 May 2022, with brightness temperatures sampled at select points (Click to enlarge)
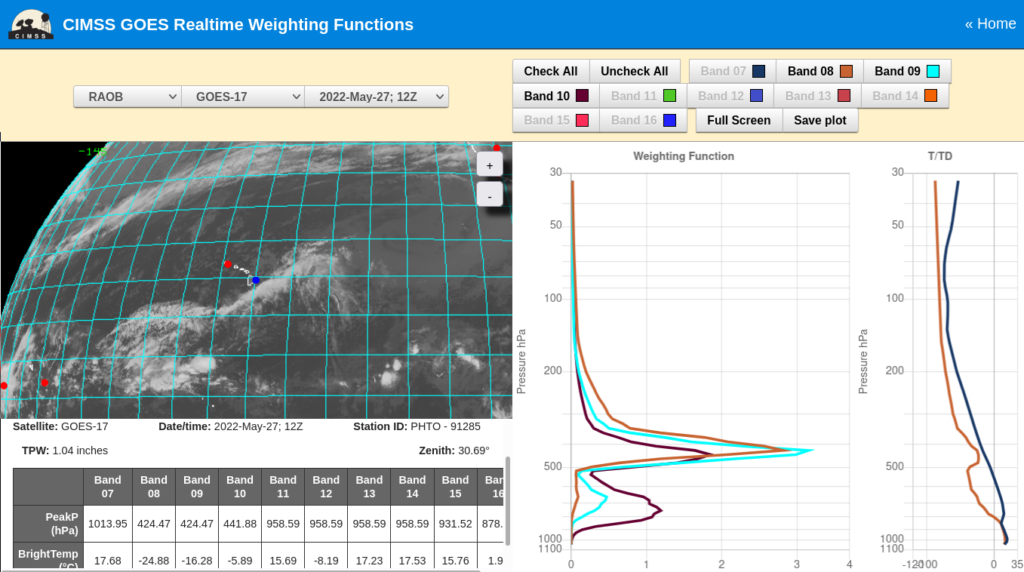
The toggle below compares GOES-17 Bands 13, 10 and 8 (10.3 µm, 7.3 µm and 6.19 µm, respectively) at 1121 UTC. The ringing is obvious in Band 13; it is not obvious in Bands 10 and 8: in those two bands any surface cooling differences are masked by water vapor emissions higher in the atmosphere, even at the high altitudes along the slopes of Mauna Kea and Mauna Loa.
GOES-17 Bands 13, 10 and 8 (Clean Window, Low-Level Water Vapor and Upper-Level Water Vapor, i.e., 10.3 µm, 7.3 µm and 6.19 µm, respectively) at 1121 UTC on 27 May 2022 (click to enlarge)
Weighting Functions for the three water vapor bands (taken from this website) underscore why ringing around the peaks is far less likely to be observed in the water vapor channels on this day. The sounding shown below (or here) shows a moist layer above 500 mb, between 6 and 8 km above ground; Mauna Loa and Mauna Kea peak at about 4.2 km. The surface-based infrared signal at wavelengths between 6.2 and 7.3 µm will be obscured by water vapor emissions from higher up in the atmosphere. If that high-altitude moist layer were missing, the cold-warm-cold-warm signal would have a better chance of appearing in the water vapor imagery.
Because skies are clearing, one might expect these ring features to appear in the Land Surface Temperature field. However, a toggle that field at 1201 UTC, along with the Clear Sky Mask, shows that is not the case. Land Surface Temperature is computed in regions where skies are “Clear” or “Probably Clear”, but not where skies are “Cloudy” or “Probably Cloudy” (the four possible states in the Clear Sky Mask; note however that AWIPS displays on “Cloudy” skies as white, and all other states are transparent). Thus, the ‘warm’ parts of the rings are displayed; the cold parts are not.
GOES-16 Land Surface Temperature display with/over, Band 13 infrared (10.3 µm) imagery, Topography, and Clear Sky Mask at 1201 UTC on 27 May 2022 (click to enlarge)
Thanks very much to Kevin Kodama, WFO HNL, and Jordan Gerth, NWS/OBS, for bringing this interesting case to our attention!


