This website works best with a newer web browser such as Chrome, Firefox, Safari or Microsoft
Edge. Internet Explorer is not supported by this website.
1-minute Mesoscale Domain Sector GOES-16 (GOES-East) “Red” Visible (0.64 µm) images (above) include time-matched plots of SPC Storm Reports — and showed severe thunderstorms moving eastward across parts of New Jersey, New York, Connecticut, Rhode Island and Massachusetts on 13 November 2021. These storms developed along and just ahead of a cold front (surface analyses), the position of which was highlighted by an “arc cloud”... Read More
GOES-16 “Red” Visible (0.64 µm) images, with SPC Storm Reports plotted in red [click to play animated GIF | MP4]
1-minute Mesoscale Domain Sector GOES-16 (GOES-East) “Red” Visible (0.64 µm) images (above)include time-matched plots of SPC Storm Reports — and showed severe thunderstorms moving eastward across parts of New Jersey, New York, Connecticut, Rhode Island and Massachusetts on 13 November 2021. These storms developed along and just ahead of a cold front (surface analyses), the position of which was highlighted by an “arc cloud” extending southward across the Atlantic Ocean.
The corresponding 1-minute GOES-16 “Clean” Infrared Window (10.35 µm) images (below) extended past sunset into the early evening hours; the low-topped convection only displayed coldest cloud-top infrared brightness temperatures in the -40 to -50ºC range (green to yellow enhancement).
GOES-16 “Clean” Infrared Window (10.35 µm) images, with SPC Storm Reports plotted in red [click to play animated GIF | MP4]
GOES-16 (GOES-East) “Clean” Infrared Window (10.35 µm) and “Red” Visible (0.64 µm) images (above) showed a line of deep convection which moved northwestward across the Brazil / Bolivia border during 11-12 November 2021 — and in its wake, the circulation of a remnant Mesoscale Convective Vortex (MCV) was seen moving south-southeastward across Brazil, back toward the... Read More
GOES-16 “Clean” Infrared Window (10.35 µm) and “Red” Visible (0.64 µm) images [click to play animated GIF | MP4]
GOES-16 (GOES-East) “Clean” Infrared Window (10.35 µm) and “Red” Visible (0.64 µm) images (above) showed a line of deep convection which moved northwestward across the Brazil / Bolivia border during 11-12 November 2021 — and in its wake, the circulation of a remnant Mesoscale Convective Vortex (MCV) was seen moving south-southeastward across Brazil, back toward the Boliva border.
GOES-16 Visible images combined with the clear-sky Total Precipitable Water product (below) revealed TPW values in the 2.2 to 2.5 inch range in the vicinity of the MCV. This environment of high moisture likely aided the development of new convection as the MCV approached. Nearby 12 UTC soundings from Porto Velho (SBPV) and Vilhena (SBVH) showed minimal instability across far southwestern Brazil, but the sounding TPW values (2.0 to 2.3 inches) were in good agreement with the TPW values derived from GOES-16.
GOES-16 “Red” Visible (0.64 µm) images, combined with the clear-sky Total Precipitable Water product [click to play animated GIF | MP4]
GOES-16 Visible images at 1200 UTC and 1800 UTC with plots of GFS wind barbs at 850 hPa and 500 hPa (below) indicated that the MCV was moving through an environment of relatively low wind shear — this helped the MCV to maintain its circulation for the remainder of the daytime hours on 12 November.
GOES-16 “Red” Visible (0.64 µm) images at 1200 UTC and 1800 UTC, with plots of GFS wind barbs at 850 hPa and 500 hPa [click to enlarge]
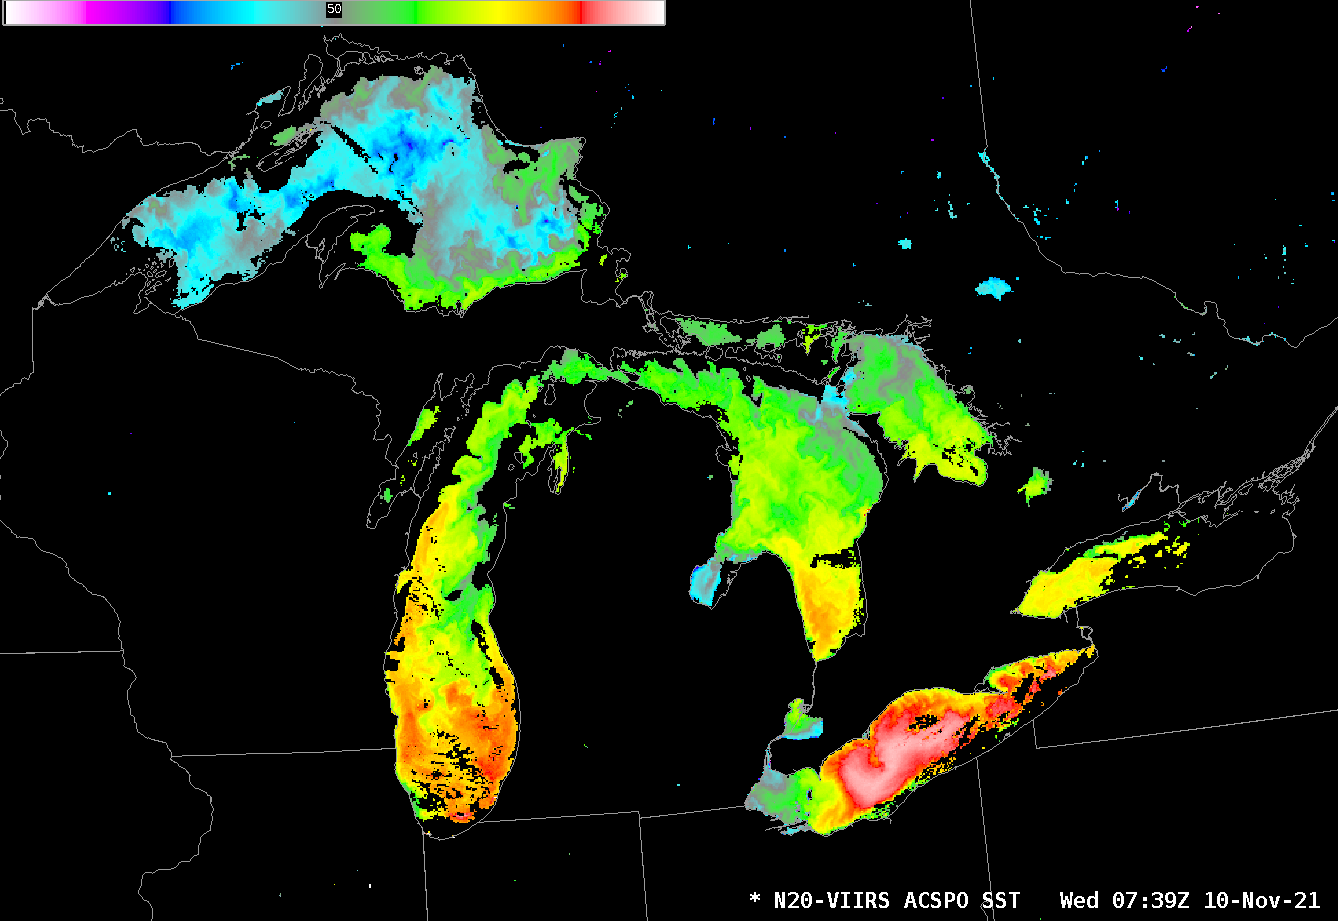
Clear skies in the early morning of 10 November 2021 allowed mapping of lake surface temperatures (LSTs) over the Great Lakes using the Advanced Clear-Sky Processor for Oceans (ACSPO) algorithm with VIIRS data acquired at the direct broadcast site at CIMSS. Surface values over Lake Superior, for example, were in... Read More
ACSPO SSTs from NOAA-20 VIIRS Imagery, 0739 UTC on 10 November 2021 (Click to enlarge)
Clear skies in the early morning of 10 November 2021 allowed mapping of lake surface temperatures (LSTs) over the Great Lakes using the Advanced Clear-Sky Processor for Oceans (ACSPO) algorithm with VIIRS data acquired at the direct broadcast site at CIMSS. Surface values over Lake Superior, for example, were in the mid-40s (º Fahrenheit; the color bar ranges from 41º F to 59º F — 5º to 15º C); much of central Lake Erie is in the upper-50s! What do temperatures in the airmass poised to move over the Lakes look like?
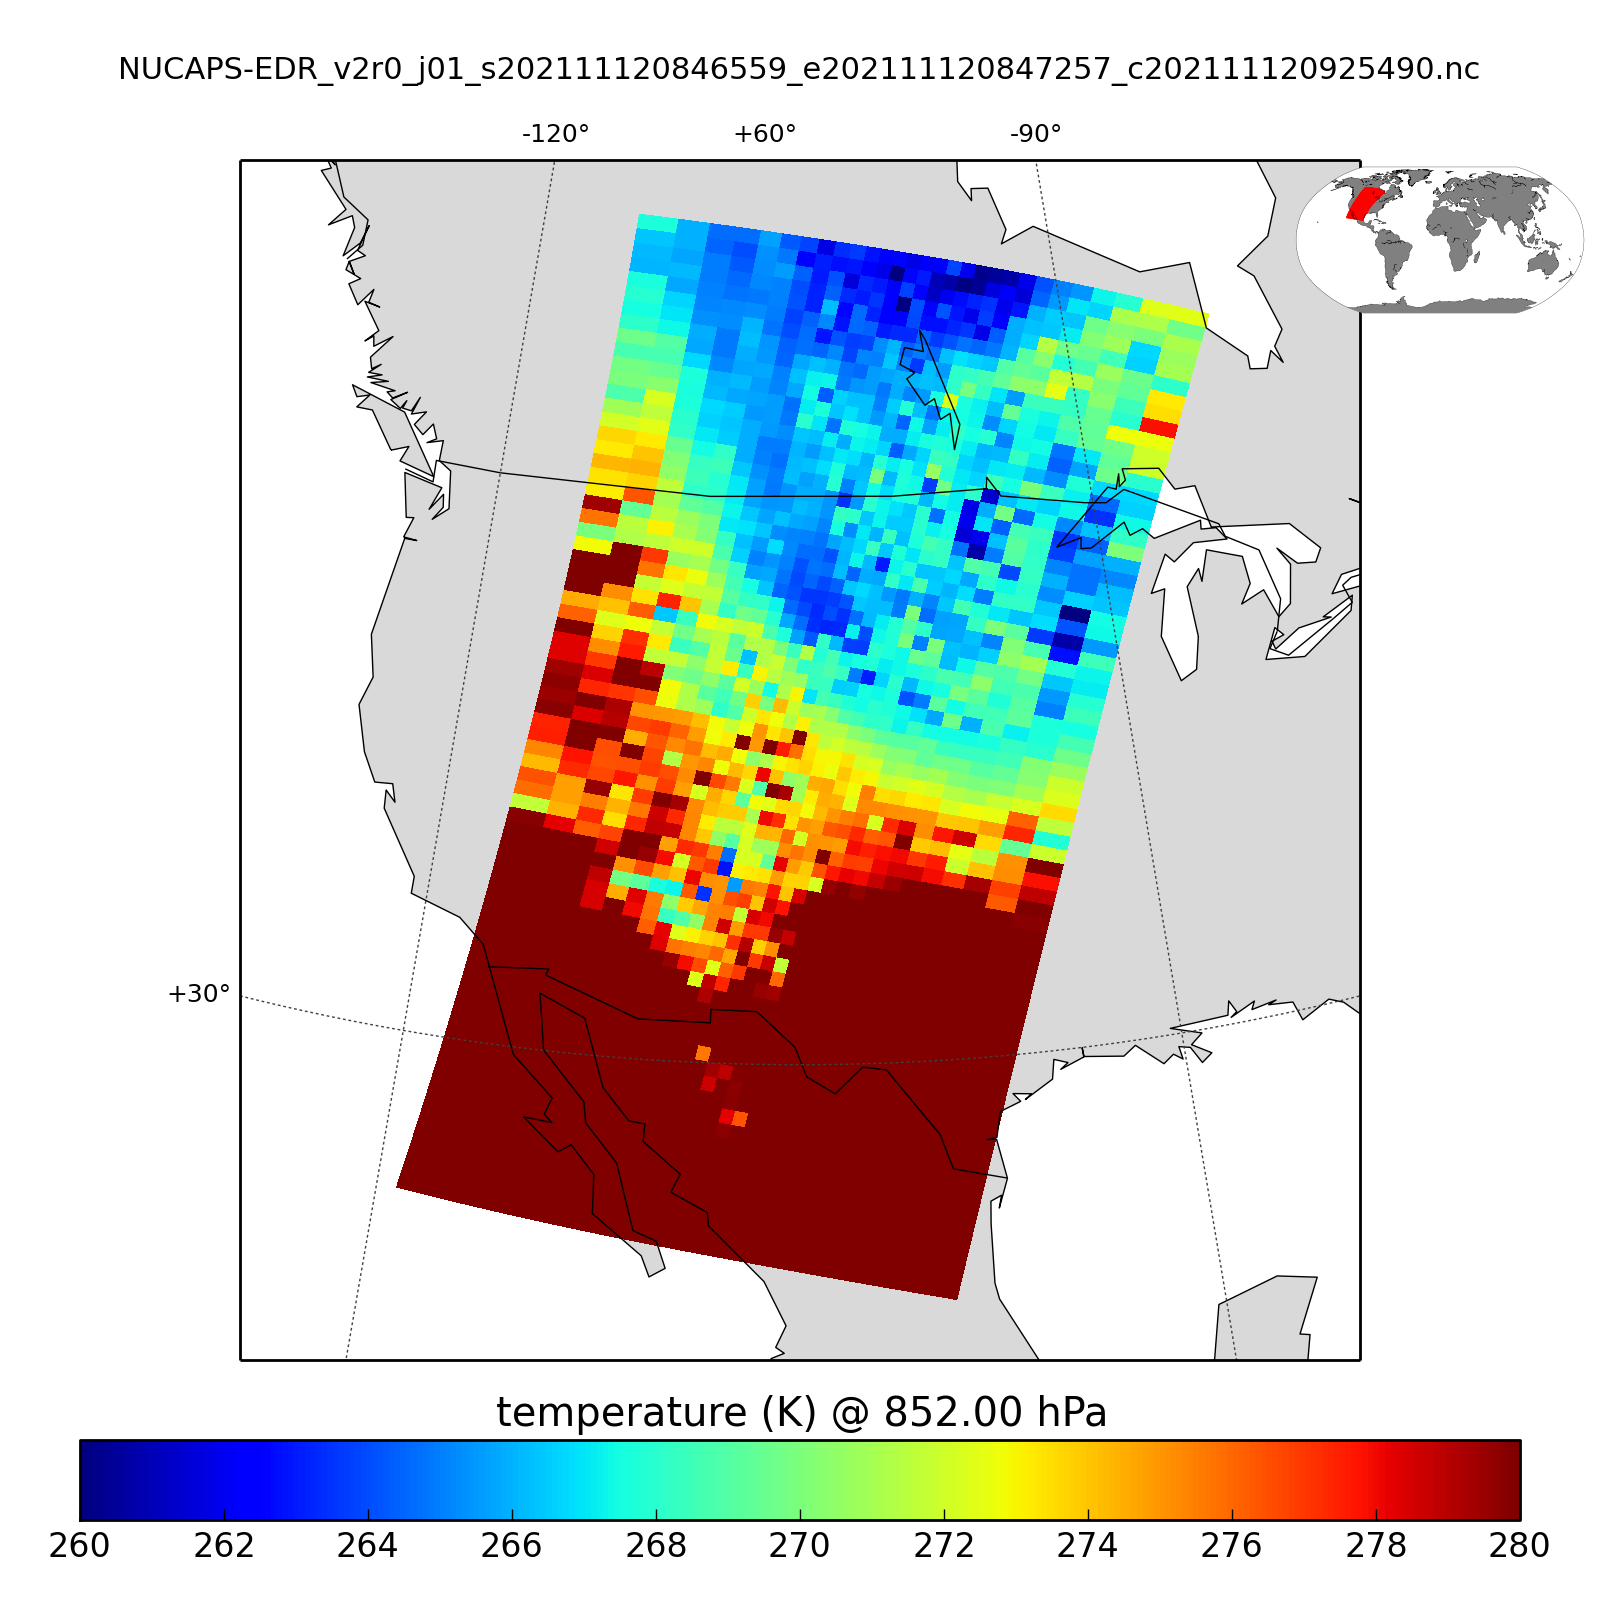
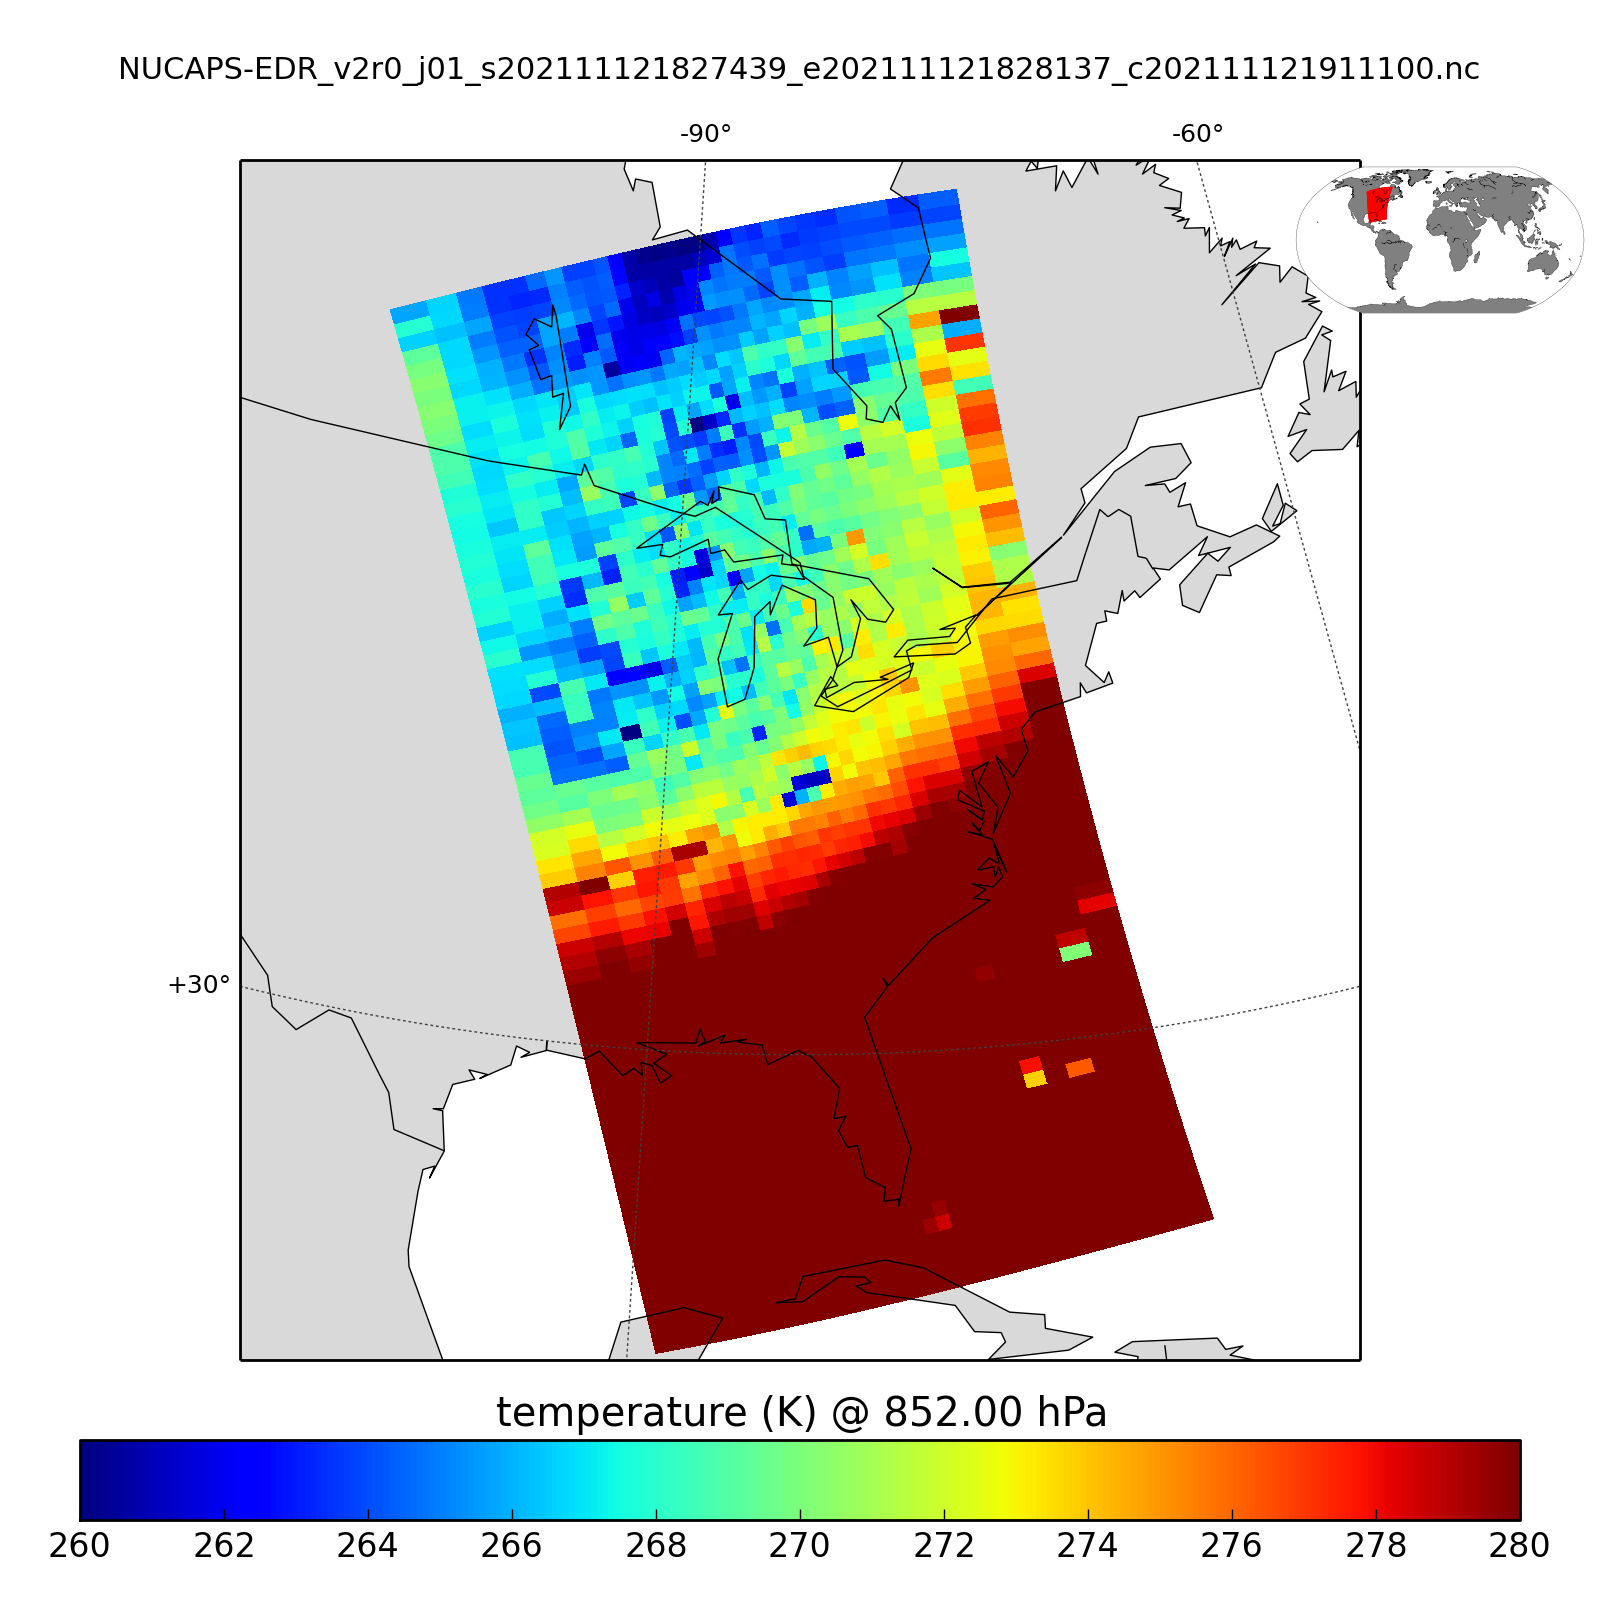
QuickLook software (from this site, with use described in this blog post) can be used with Direct Broadcast output of NUCAPS EDR data (in this directory, for example) to produce 852-mb temperature fields, as shown below. (You can routinely view fields of dewpoint, relative humidity and mixing ratio at 247, 496, 753 and 904 mb here, for example, as well). Minimum 850-mb temperatures as diagnosed by NUCAPS are around -10º to -13º C. A common-cited minimum temperature difference threshold between lake and 850 mb is 13º (Celsius) (as noted here and in many other places); certainly that is satisfied based on the ACSPO SSTs and the NUCAPS temperatures!
852-mb temperature from NUCAPS EDRs, 0847 UTC on 12 November 2021 (Click to enlarge)
A similar image, below (produced about 90 minutes after the NOAA-20 overpass) also shows the cold air ready to overspread the Great Lakes.
852-mb temperature from NUCAPS EDRs, 1827 UTC on 12 November 2021 (Click to enlarge)
Gridded NUCAPS fields at 850 mb are also available at this site maintained by NASA SPoRT. The toggle below shows temperature at 850 mb and Quality Control Flags (yellow corresponds to regions where the infrared retrieval did not converge to a solution — but the microwave retrieval did) from the same afternoon overpass from NOAA-20 as shown above.
850-mb Temperatures and NUCAPS Quality Control, 1824 UTC on 12 November 2021 (Click to enlarge)
AWIPS-ready ACSPO SST fields are available to National Weather Service offices via LDM. Contact the blog author for details.
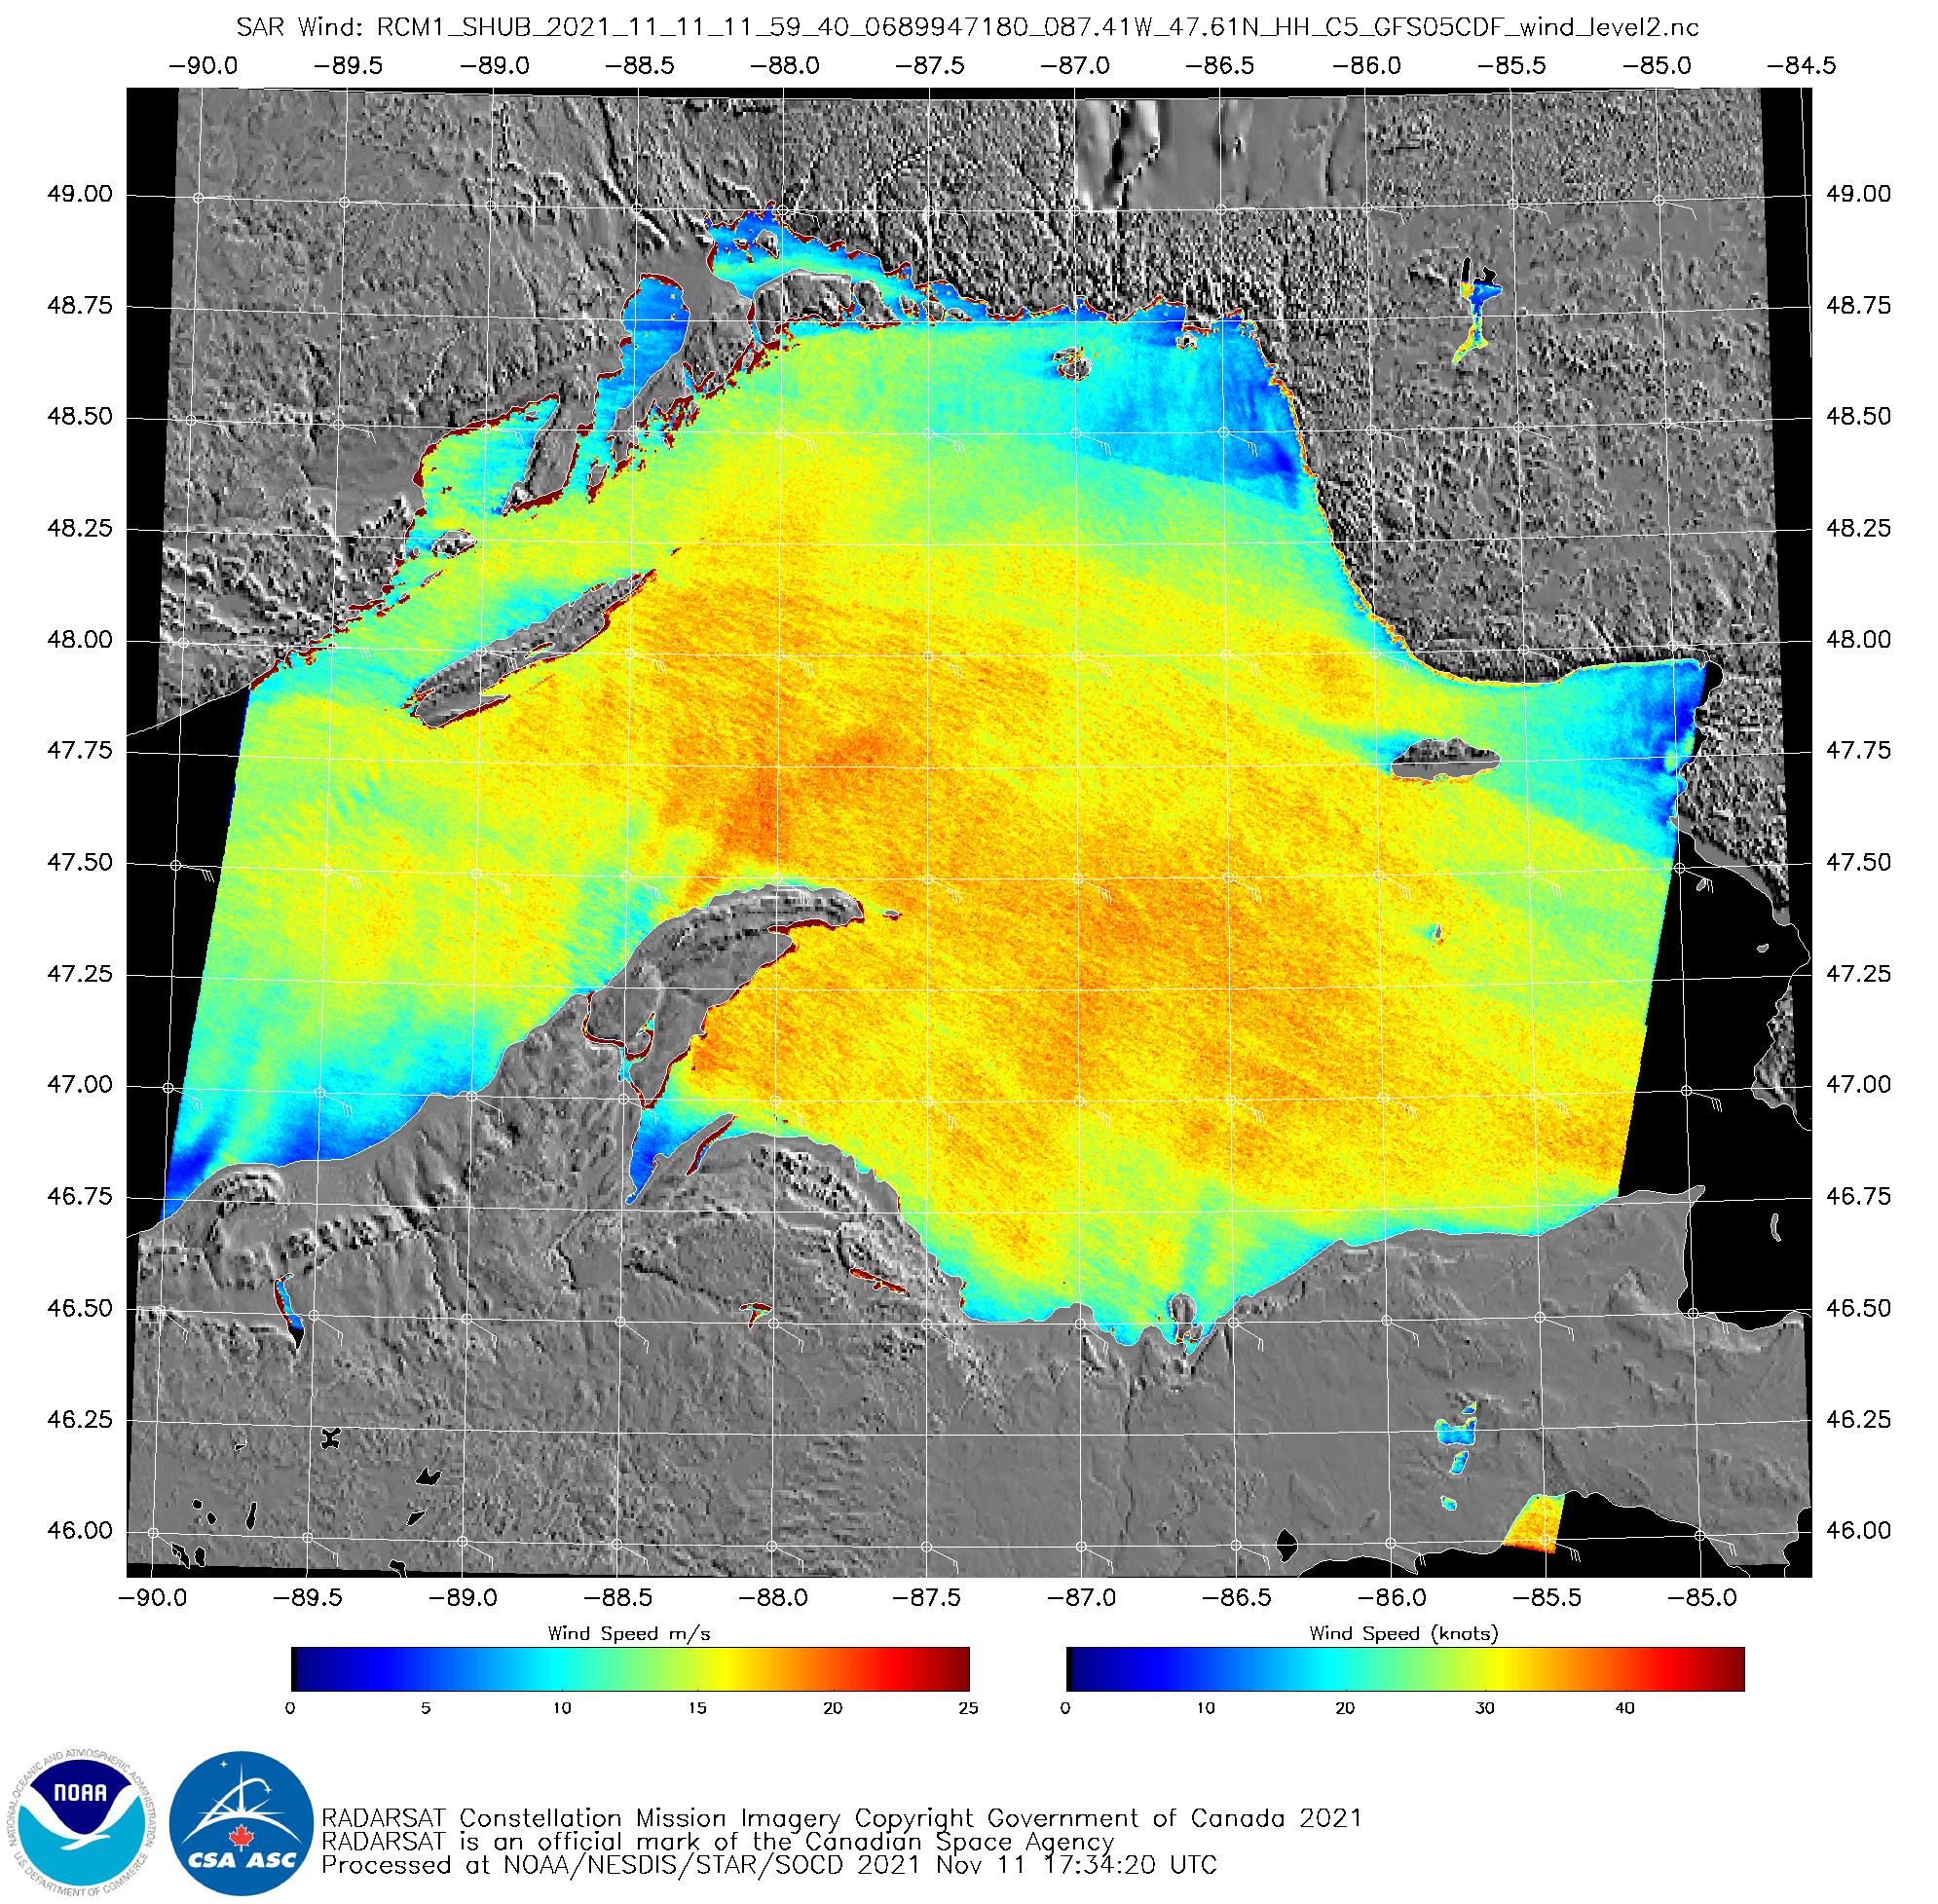
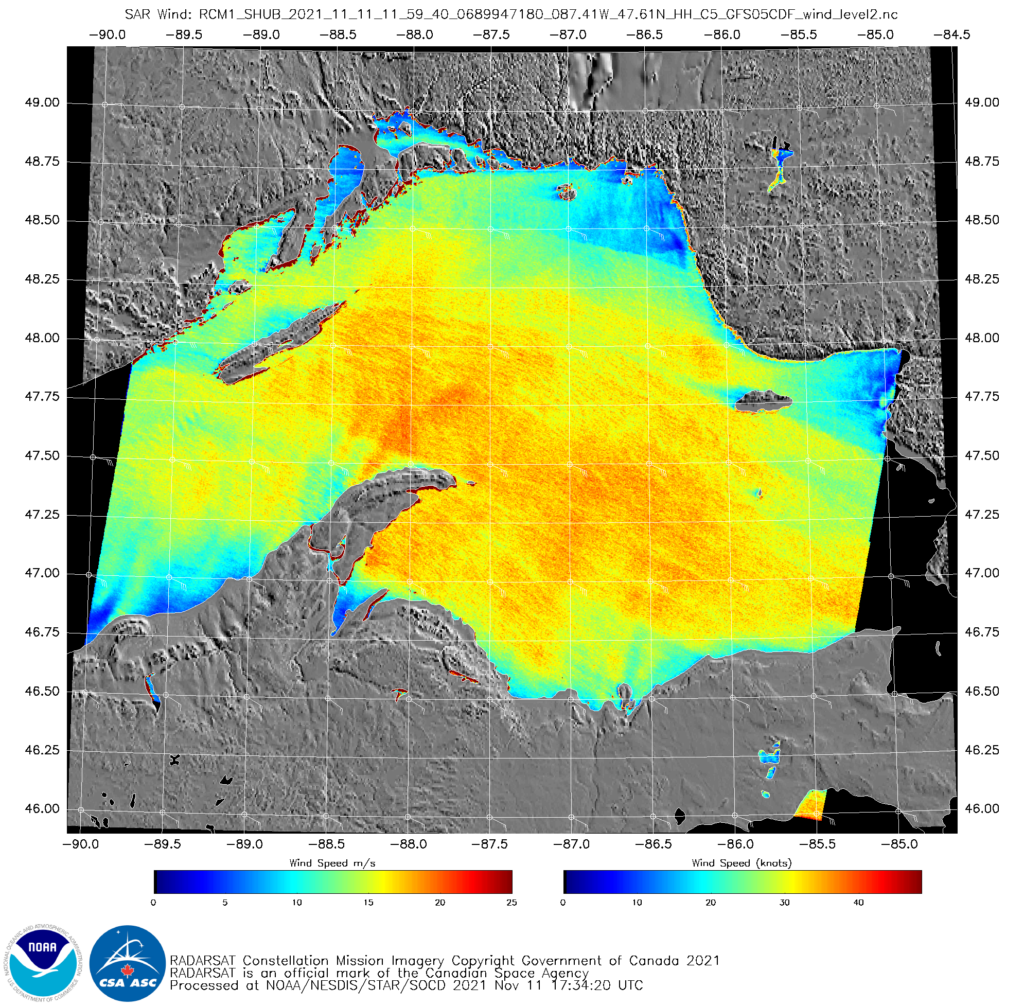
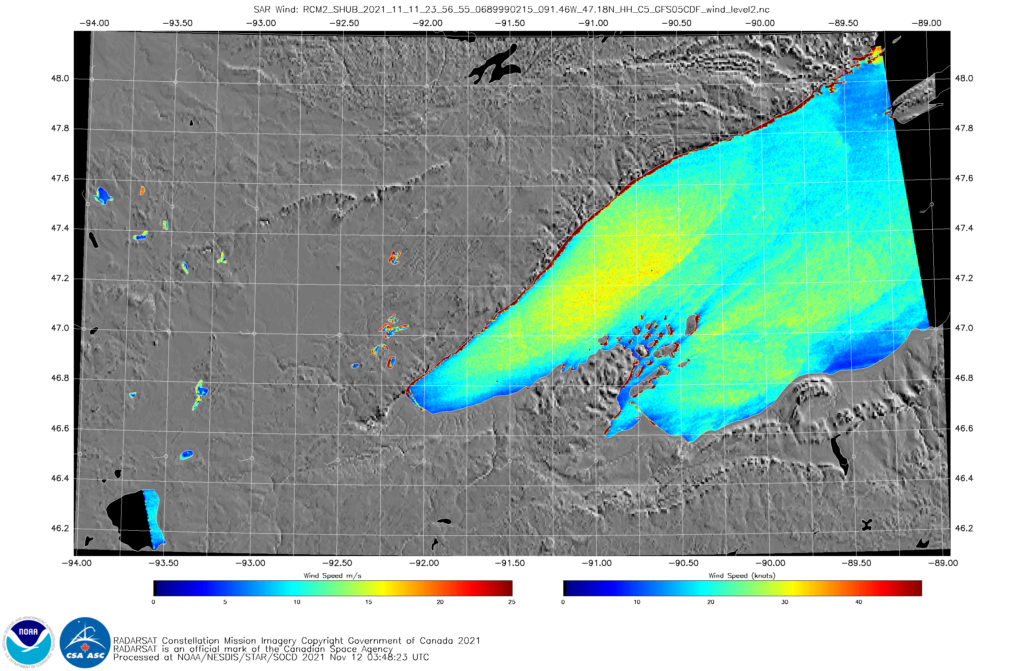
A vigorous extra-tropical cyclone moving towards the western Great Lakes on 11 November 2021 generated significant winds and waves over Lake Superior. RADARSAT winds, above, from RCM1, (available at this website) show a large area of southeasterly winds between 30 and 40 knots at 1159 UTC on 11 November. Regions of... Read More
RCM1 RADARSAT winds over Lake Superior, 11:59:40 UTC on 11 November 2021 (Click to enlarge)
A vigorous extra-tropical cyclone moving towards the western Great Lakes on 11 November 2021 generated significant winds and waves over Lake Superior. RADARSAT winds, above, from RCM1, (available at this website) show a large area of southeasterly winds between 30 and 40 knots at 1159 UTC on 11 November. Regions of lighter winds are present to the lee of both Isle Royale and Michicipoten Island. The animation below steps through the low-level water vapor and clean window infrared channels (Band 10 at 7.34 µm and Band 13 at 10.3 µm, respectively) and the airmass RGB. All three ABI products suggest a negatively-tilted trough moving into the western Great Lakes. Click here to see an animation of 3-hour surface plots from 0900 UTC 11 November through 0600 UTC on 12 November (also shown at the bottom of this post).
GOES-16 ABI Band 10 (7.34 µm), 13 (10.3 µm) and Airmass RGB, 1201 UTC on 11 Nov 2021 (Click to enlarge)
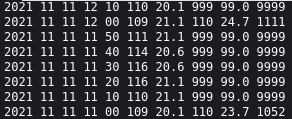
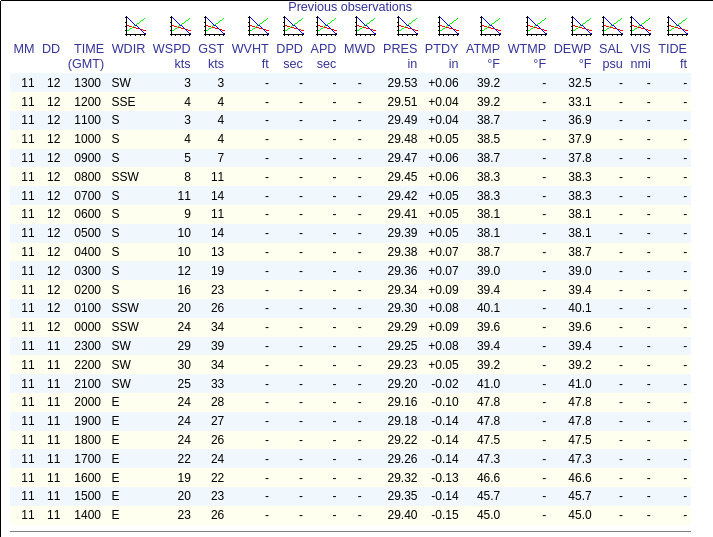
How do the SAR winds above compare to observations? Open-lake observations are scarce during Gales, and the mid-lake buoys (45028, 45006 and 45001, for example) have been retrieved for the season. However, Stannard Rock Lighthouse observations show sustained east-southeast winds near 40 knots at around 1200 UTC, as shown in the capture below, from this website (accessed from here). (Note that Stannard Rock wind observations are 35 m above the Lake surface)
Stannard Rock winds observations, 1100-1210 UTC on 11 November 2021. The format of the data is, from left to right: Year, Month, Day, Hour, Minute, Wind Direction, Wind Speed (m/s), Wind Direction, Peak Gust (m/s), Time of Gust.
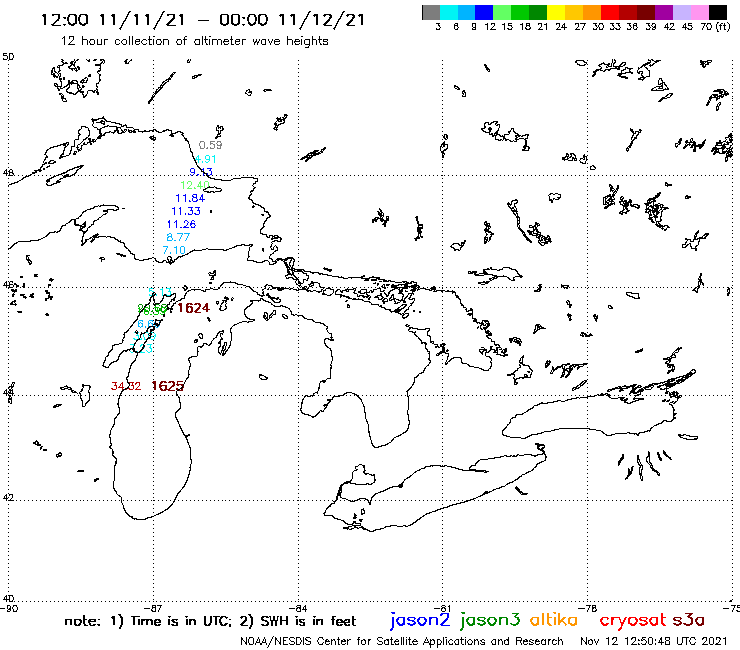
At 1636 UTC, JASON-2 overflew eastern Lake Superior, and Altimetry data (from this website) from that satellite was used to compute wave heights, shown below. Peak Significant Wave Heights (defined as the average of the highest 1/3rd of all waves) under the satellite were in the 11-12 foot range. (Click here for a quick brief on JASON Wave Heights). Lake Superior Wave Heights at 1600 UTC (from this website (linked off here) maintained by GLERL) show rough agreement with the JASON observations.
JASON-2 Significant Wave Heights, 1624 UTC on 11 November 2021 (Click to enlarge)
GOES-16 Data at the time of the JASON overpass, below, shows the continued development/amplification of the extratropical cyclone. Note in particular the feature over western Iowa/eastern Nebraska that has dropped down the western side of this developing storm since 1201 UTC imagery, above.
GOES-16 ABI Band 10 (7.34 µm), 13 (10.3 µm) and Airmass RGB, 1626 UTC on 11 Nov 2021 (Click to enlarge)
At 2356 UTC on 11 November, RCM2 overflew western Lake Superior, and data at that time shows southwesterly winds between 25 and 30 knots over western Lake Superior. GOES-16 data at the same time, below (and surface data, bottom) show a mature storm to the north of Lake Superior. Data from the Devils Island C-MAN station (link) (see below) show sustained winds at 24 knots with gusts to 34 knots. (Note that the instruments for this reading are 25 m above ground)
RCM2 RADARSAT winds over Lake Superior, 23:56 UTC on 11 November 2021 (Click to enlarge)GOES-16 ABI Band 10 (7.34 µm), 13 (10.3 µm) and Airmass RGB, 2356 UTC on 11 Nov 2021 (Click to enlarge)Observed winds from C-MAN site DISW3 (Devils Island, Wisconsin), 1400 UTC 11 November – 1300 UTC 12 November 2021
Airmass RGB imagery from 1201, 1626 and 2356 UTC, below, the times of the wind and wave observations above, show the piecewise development of this system. Surface analyses for this system, from 0900 UTC on 11 November through 0600 UTC 12 November, are shown at bottom.
GOES-16 Airmass RGB at 1201 UTC, 1626 UTC and 2356 UTC on 11 November 2021 (Click to enlarge)Surface Analysis, 0900 UTC 11 November to 0600 UTC 12 November 2021


