This website works best with a newer web browser such as Chrome, Firefox, Safari or Microsoft
Edge. Internet Explorer is not supported by this website.
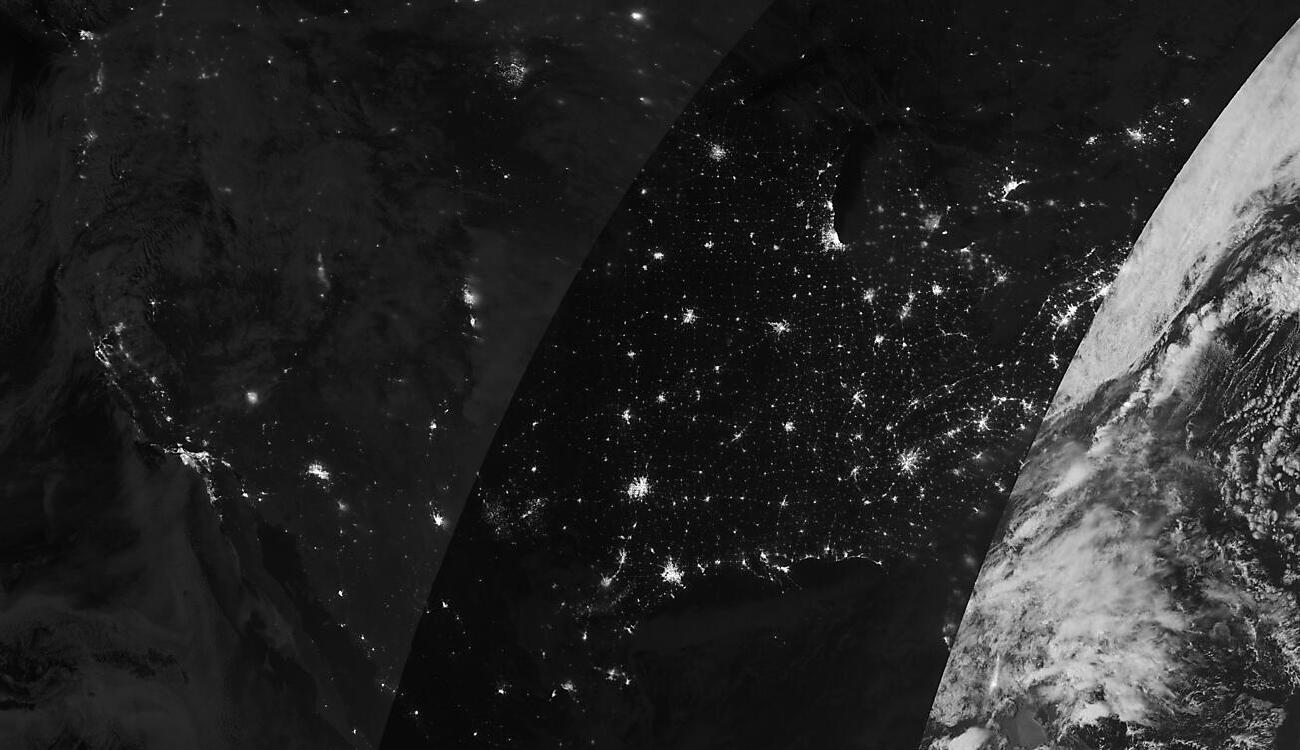
NOAA-20 Day Night Band imagery from early morning (from the VIIRS Today website at CIMSS) on 19 November 2021 shows the impact of the total lunar eclipse on Day Night Band imagery. A lunar eclipse will always occur during a Full Moon; ample lunar illumination off the east coast accompanied that descending NOAA-20 pass between about 0635... Read More
NOAA-20 Day Night Band, 19 November 2021 (Click to enlarge)
NOAA-20 Day Night Band imagery from early morning (from the VIIRS Today website at CIMSS) on 19 November 2021 shows the impact of the total lunar eclipse on Day Night Band imagery. A lunar eclipse will always occur during a Full Moon; ample lunar illumination off the east coast accompanied that descending NOAA-20 pass between about 0635 and 0640 UTC (as shown in this orbital path image from this website) — just as the lunar eclipse was starting. By the time NOAA-20 overflew the central US (0815 to 0825 UTC), near totality was occurring. The overflight on the west coast (0955 to 1005 UTC) occurred as the eclipse was starting to wane, so a bit more lunar illumination was available.
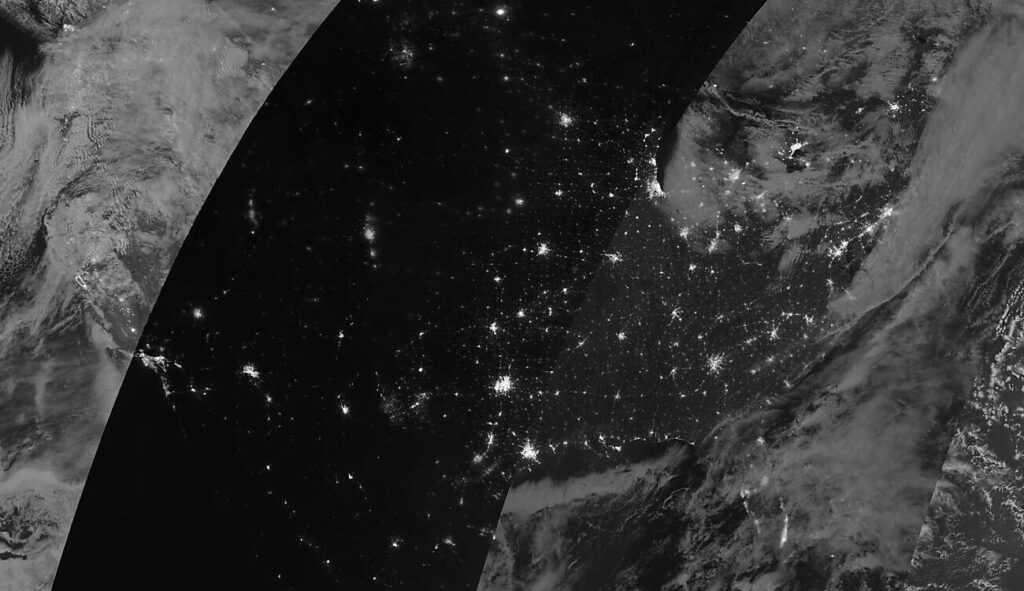
A similar Day Night Band image from Suomi-NPP (also from the VIIRS Today website) is below, and it shows similar differences in swath illumination. The west coast overpass by Suomi-NPP occurred around 1050 UTC; by then the eclipse had ended. Suomi NPP Day Night Band imagery is also available at the NASA Worldview site.
Suomi-NPP Day Night Band imagery from early morning 19 November 2021 (Click to enlarge)
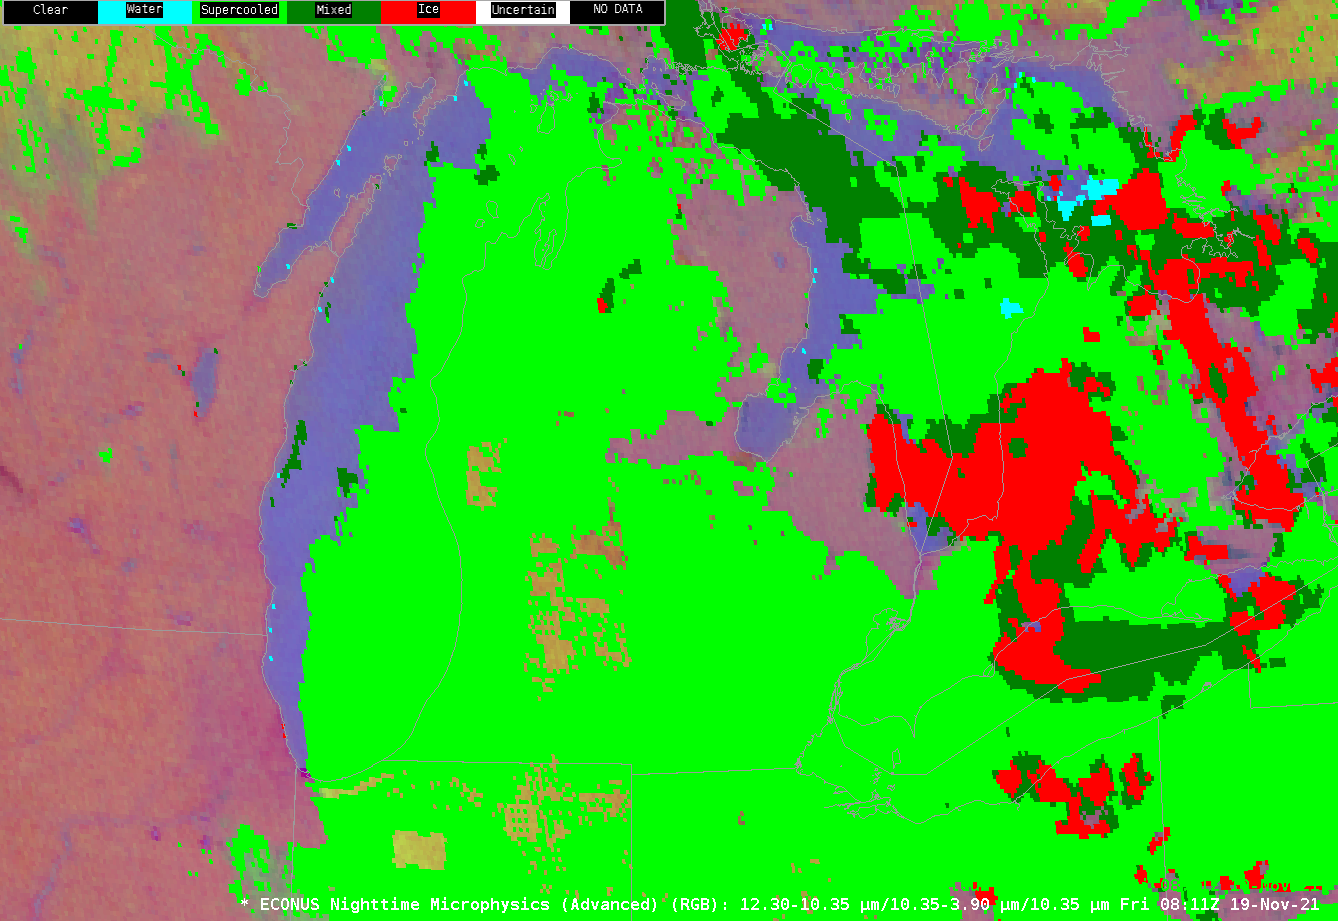
Cold temperatures over the Great Lakes (the Green Bay 850-mb sounding temperatures, for example, were -11.9º C at 0000 UTC and -8.1º C at 1200 UTC) on 18-19 November 2021 generated extensive cloud cover and occasional snow showers. The nighttime microphysics RGB, above, showed extensive stratiform clouds downwind of Lake Michigan. The GOES-16 Cloud Top Phase product at this... Read More
GOES-16 Nighttime microphysics RGB, VIIRS ACSPO SSTs and NUCAPS Sounding Availability points, 0806-0811 UTC on 19 November 2021 (Click to enlarge)
Cold temperatures over the Great Lakes (the Green Bay 850-mb sounding temperatures, for example, were -11.9º C at 0000 UTC and -8.1º C at 1200 UTC) on 18-19 November 2021 generated extensive cloud cover and occasional snow showers. The nighttime microphysics RGB, above, showed extensive stratiform clouds downwind of Lake Michigan. The GOES-16 Cloud Top Phase product at this time (here) uniformly showed water droplets over lower Michigan.
Skies over eastern Lake Michigan were clear enough at 0811 UTC to allow some lake-surface temperature computations using NOAA-20 VIIRS channels and the ACSPO algorithm. Diagnosed lake-surface temperatures are in the low 50s (º Fahrenheit; the colorbar range is 40º to 55º F).
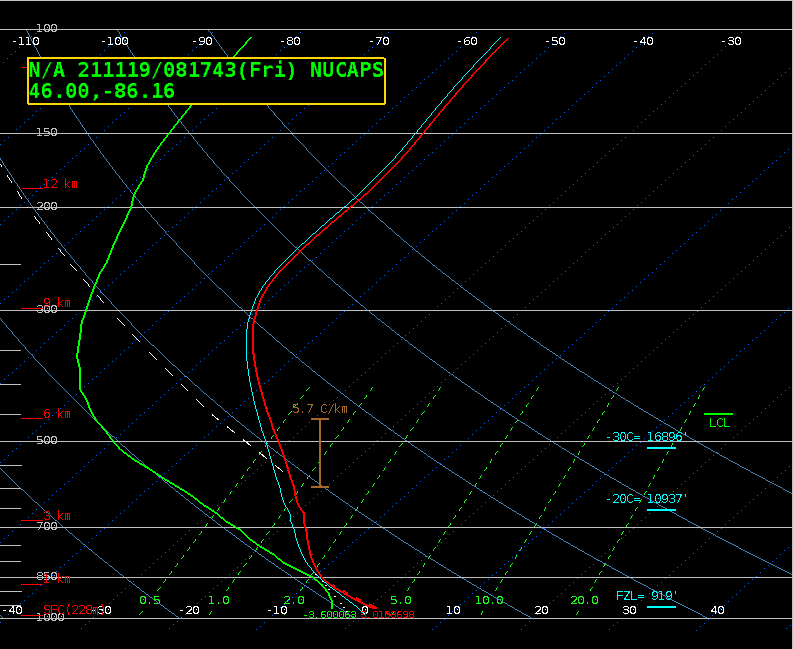
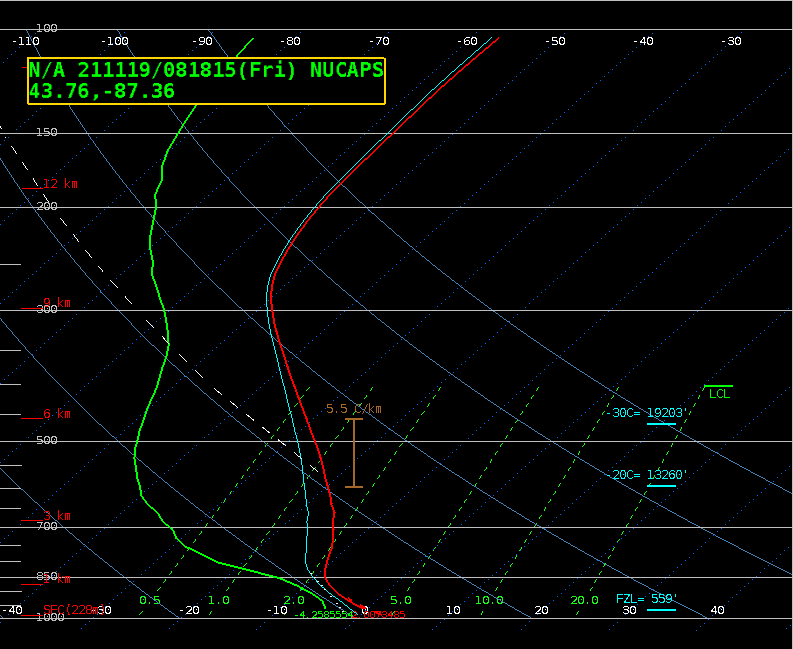
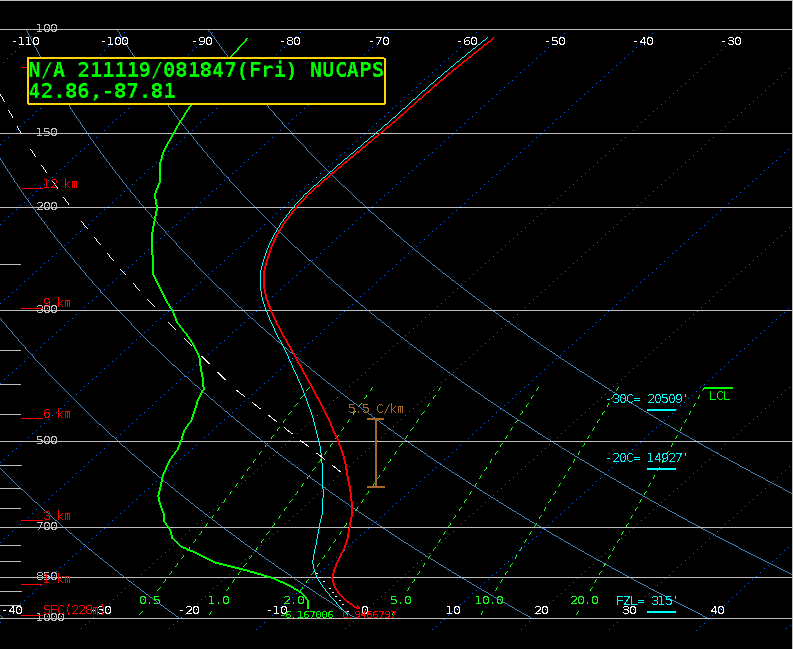
NUCAPS Profiles near Escanaba MI (left), east of Sheboygan WI (middle), and near Racine WI (right) (Click to enlarge)
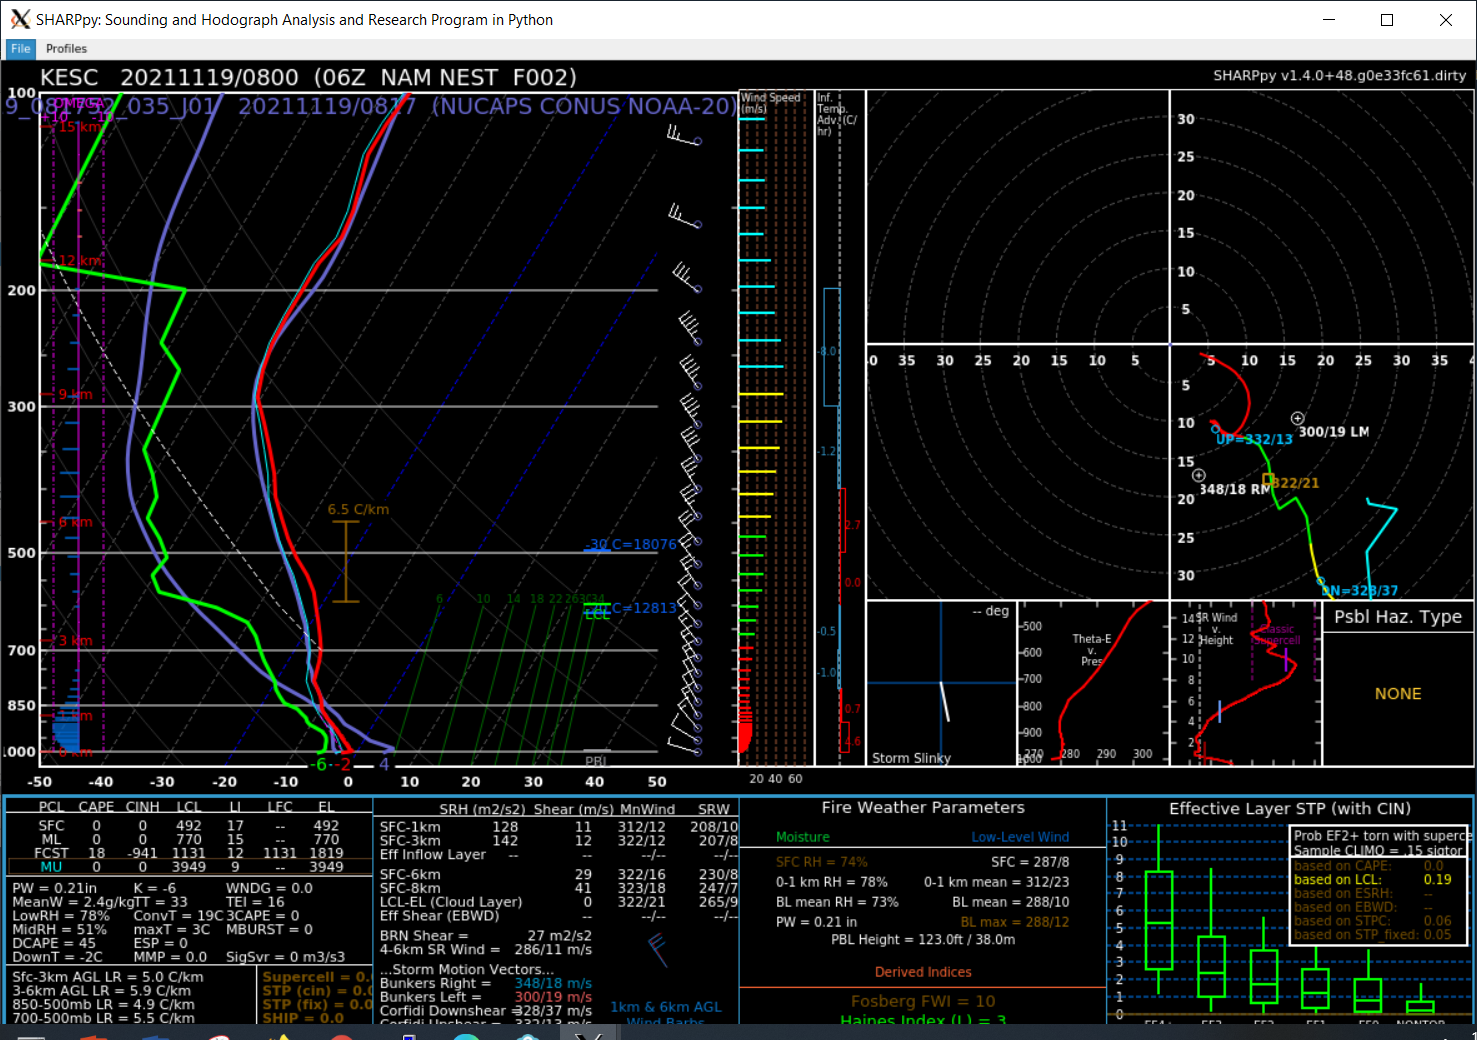
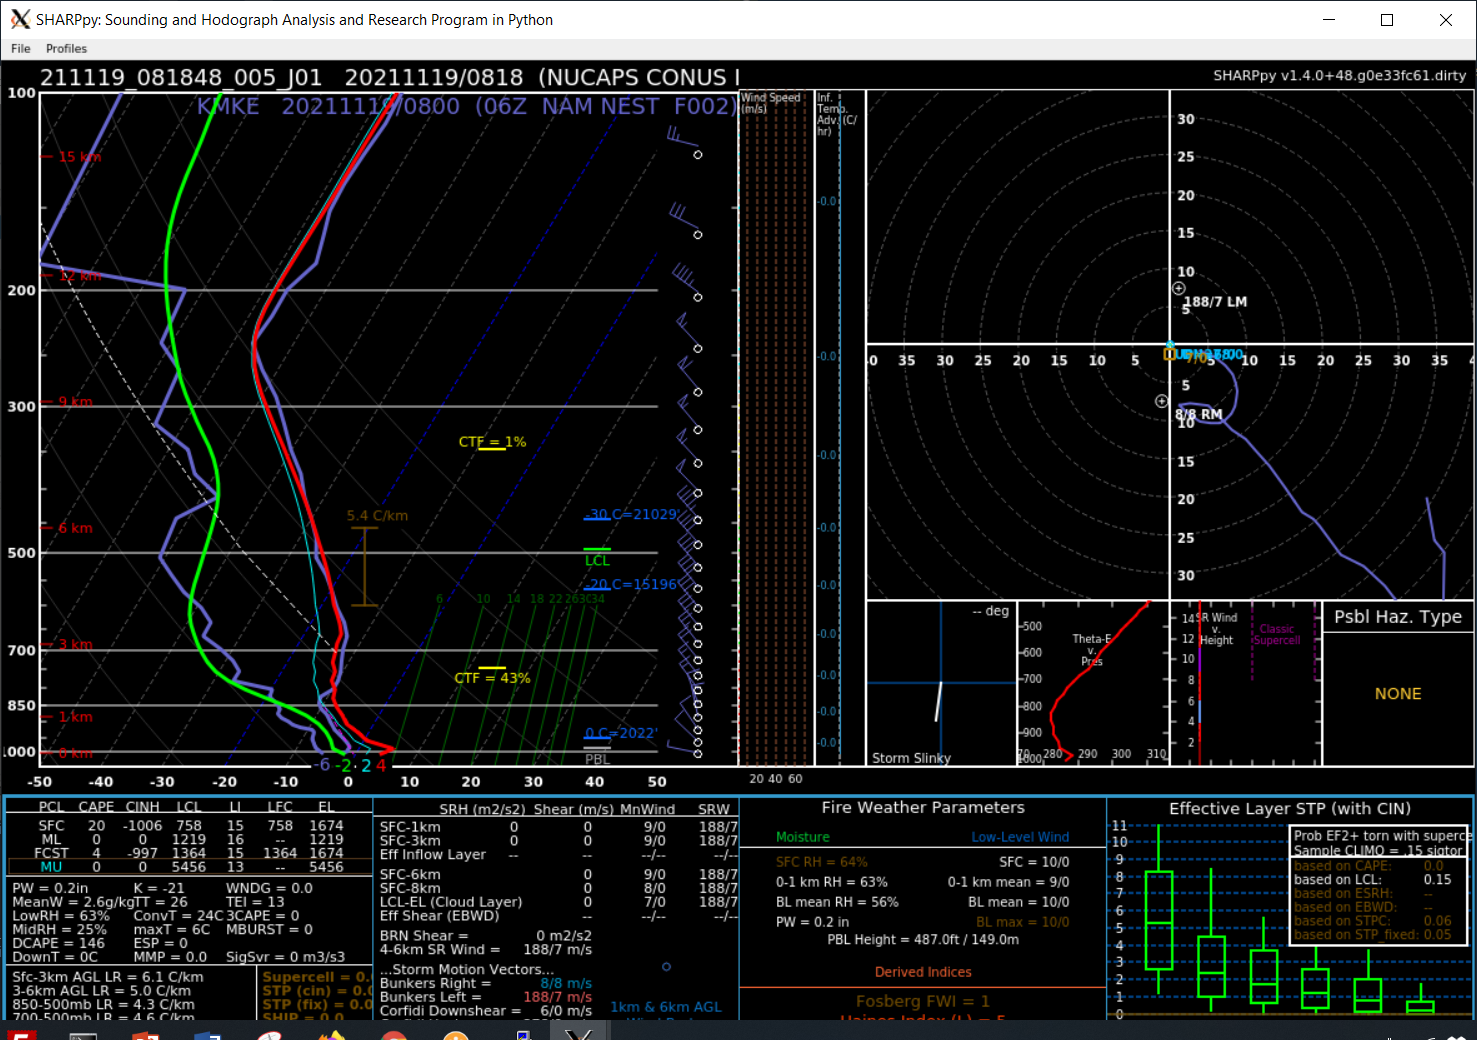
NUCAPS profiles on this day over western Lake Michigan were uniformly warmer than 2-hour forecast NAM Nest profiles from the 0600 UTC model run. The image below compares (via Sharppy, using the NUCAPS in the Cloud methodology outlined here) model (red and green lines) and NUCAPS (purple lines) near Escanaba. NUCAPS shows warmer low-level temperatures (and also cooler mid/upper-tropospheric temperatures). Comparisons for the NUCAPS point east of Sheboygan and NAM Nest values at Sheboygan, and the NUCAPS point near Racine and the NAM Nest values at Milwaukee (note that for those two linked plots, the colors are flipped: NUCAPS Temperature and Dewpoint are red and green, respectively, and NAM Nest values are purple) are similar: NUCAPS values in the lowest part of the atmosphere are warmer than the NAM Nest. How might that affect the downwind production of lake-effect clouds and precipitation?
Sharppy display showing NAM Nest profiles at Escanaba MI at 0800 UTC, a 2-h forecast from an 0600 UTC initial time (red: Temperature; green: dewpoint) as well as the nearby NUCAPS profile (purple) (Click to enlarge)
NUCAPS profiles give a model-independent estimate of temperature and dewpoint in the atmosphere. They are available about halfway (in time) between routine upper-air soundings in the lower 48 states of the USA. ‘NUCAPS Sounding Availability’ can be found under the ‘Satellite > S-NPP and NOAA-20’ menu.
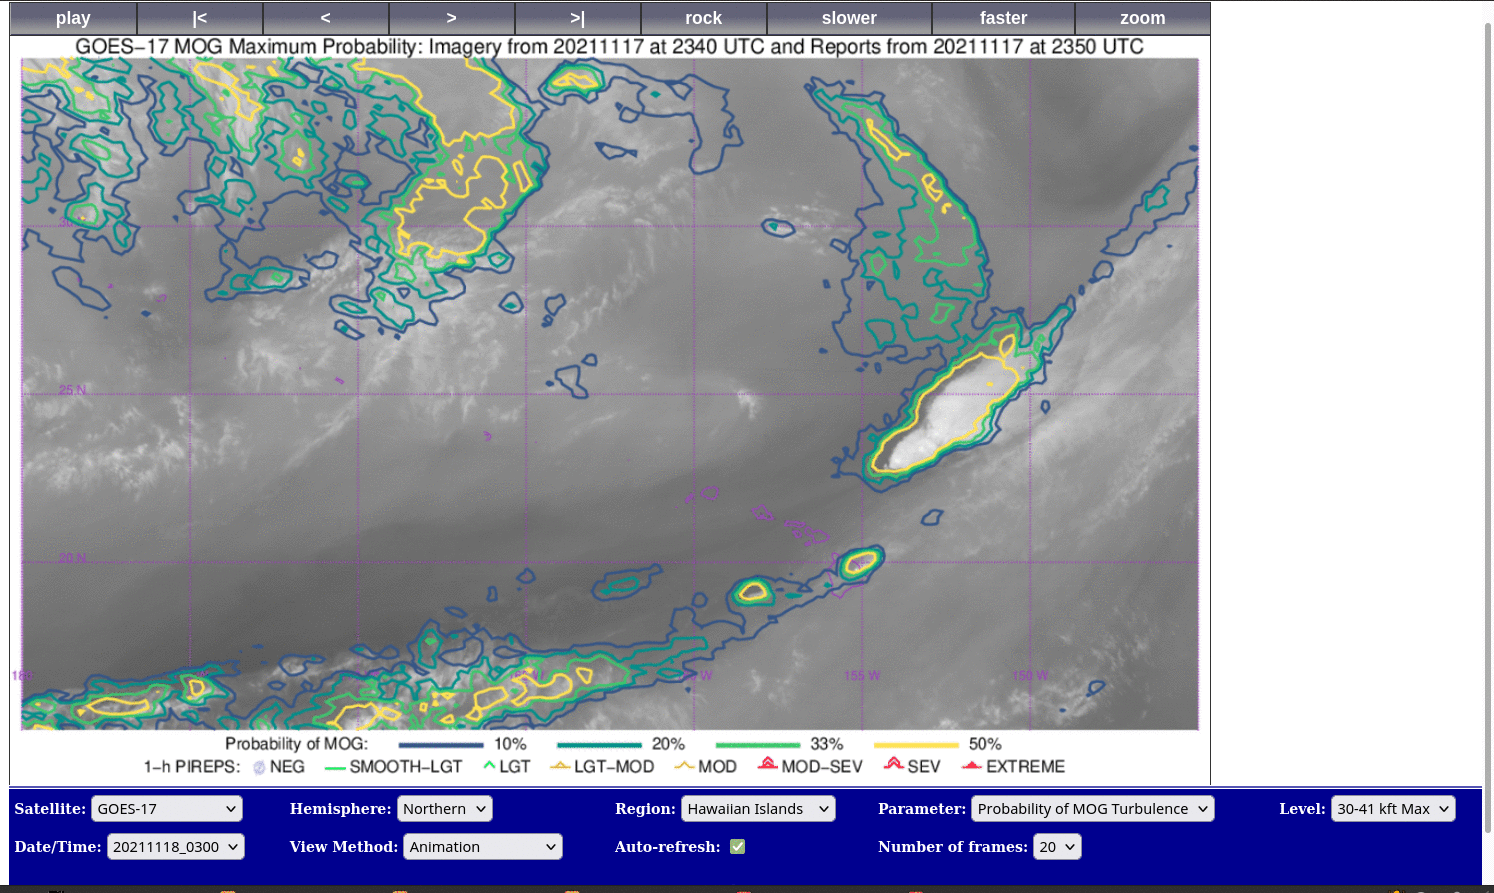
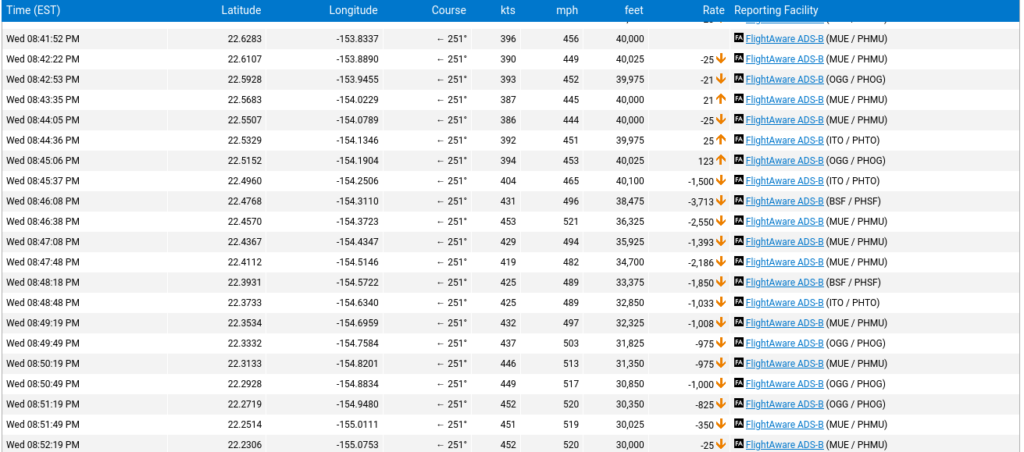
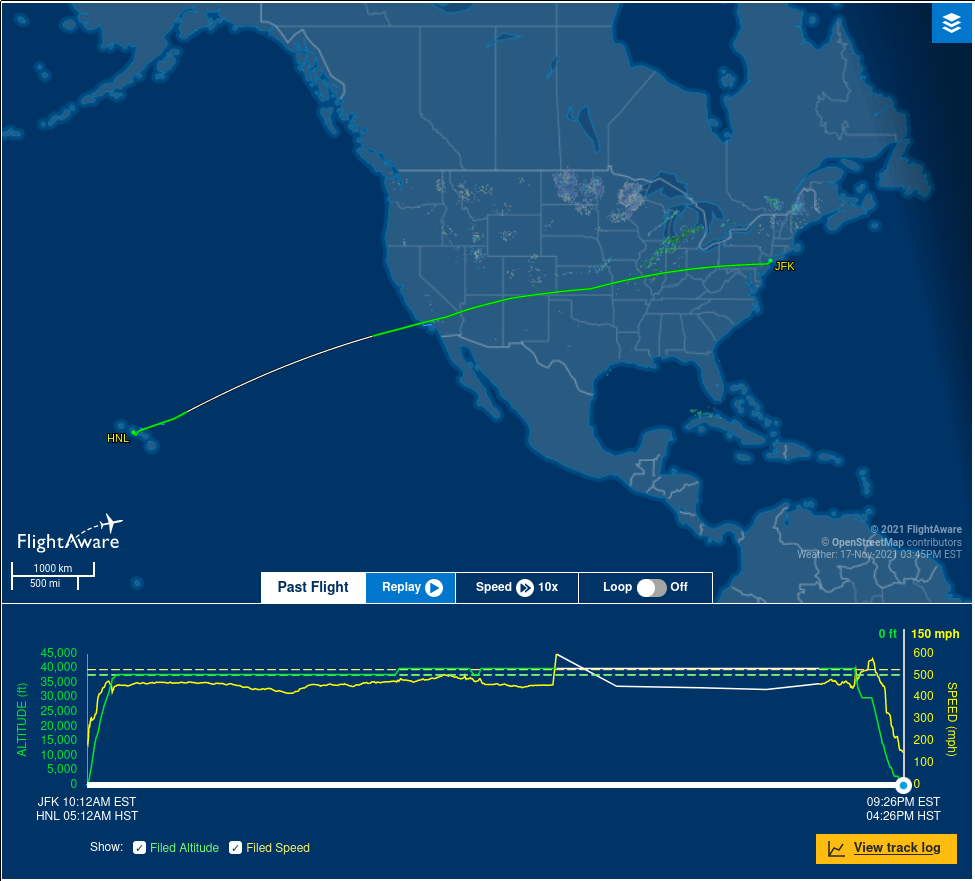
In-flight turbulence affected Hawaiian Air Flight 51 (JFK to HNL) late in the afternoon on 17 November 2021 (Click here for the flight path from the flightaware website. A screen-capture of the flight levels, below (cropped from the FlightAware website), shows turbulence occurring between 0141 and 0145 UTC on 18 November as... Read More
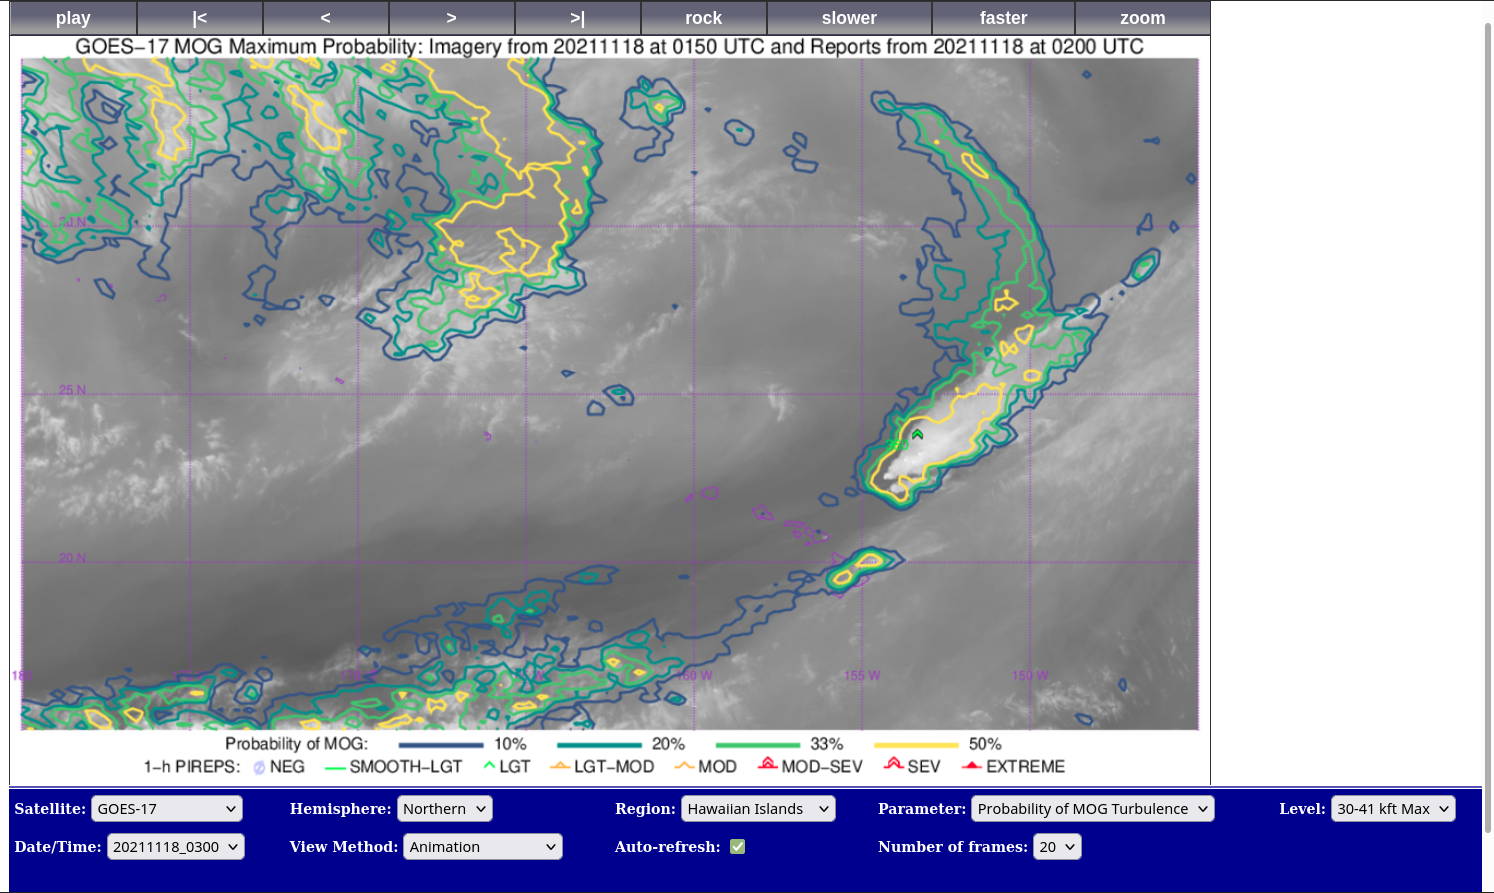
Moderate-or-Greater (MOG) Turbulence Probabilities for the 30000-41000 foot layer, 2340 UTC 17 November – 0220 UTC 18 November 2021 (Click to enlarge)
In-flight turbulence affected Hawaiian Air Flight 51 (JFK to HNL) late in the afternoon on 17 November 2021 (Click here for the flight path from the flightaware website. A screen-capture of the flight levels, below (cropped from the FlightAware website), shows turbulence occurring between 0141 and 0145 UTC on 18 November as the plane was flying at FL400 near 22.5º N, 154º W. That places the storm in the middle of MOG values exceeding 50% in a convective storm to the northeast of Hawaii, a storm in which other planes were also experiencing turbulence, as shown in the animation above (taken from the CIMSS Turbulence website).Here is the image for 0150 UTC, right after the turbulence affected the aircraft.
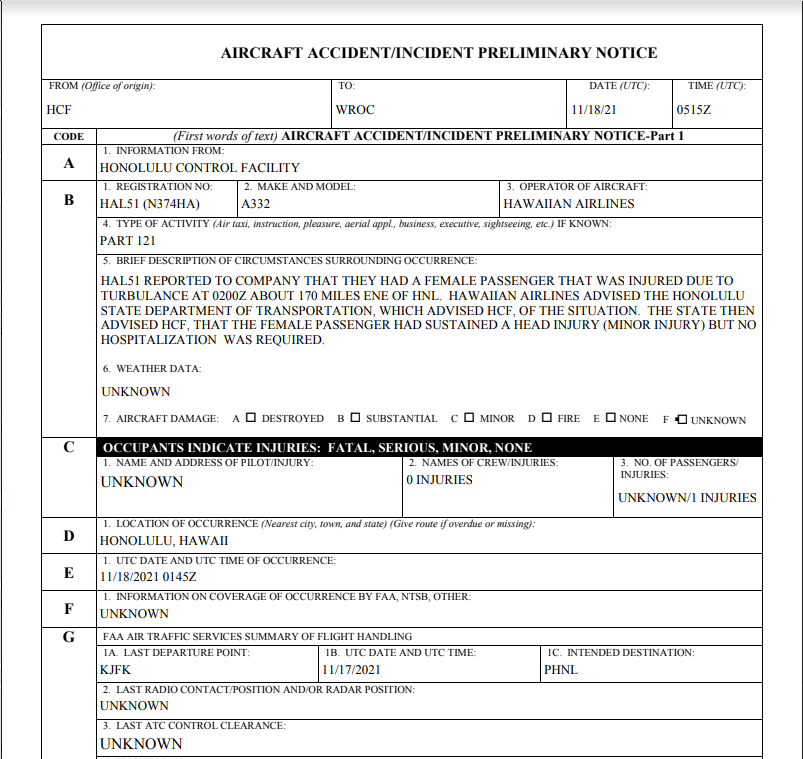
One passenger suffered a minor head injury during this event, and declined treatment. (Link). Training on this product is available at this site (direct link to recording is here).
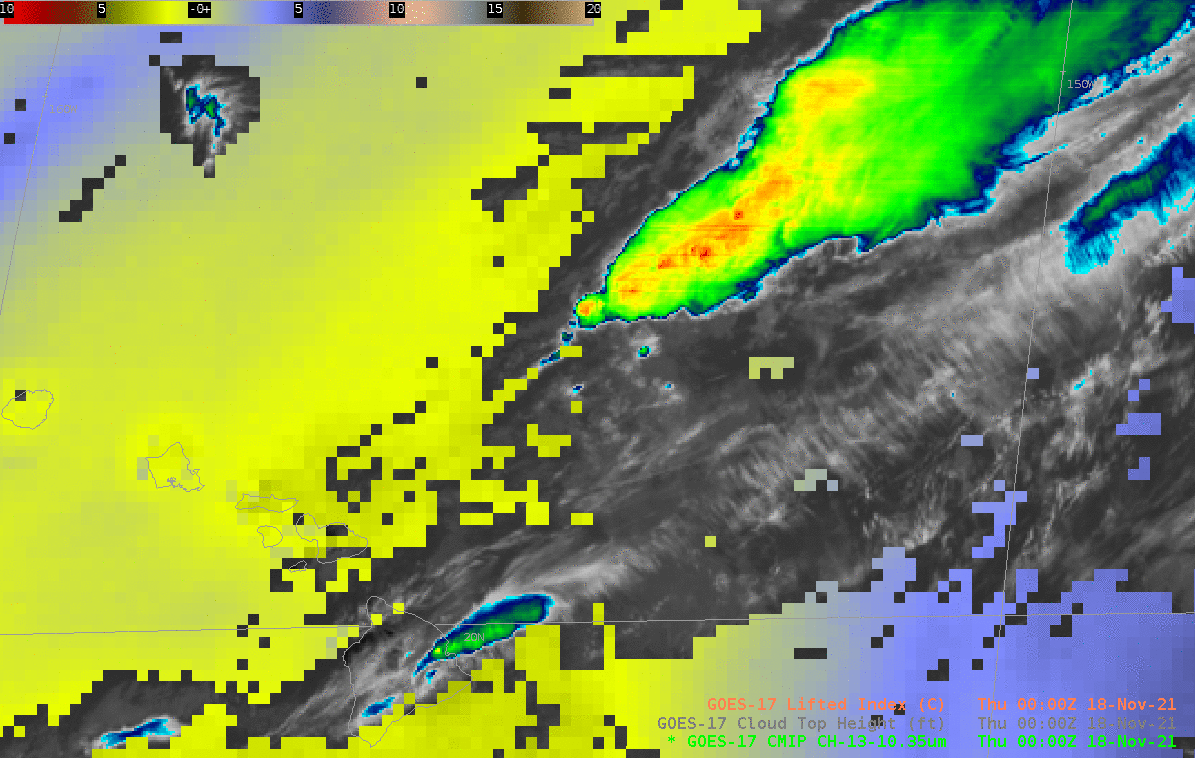
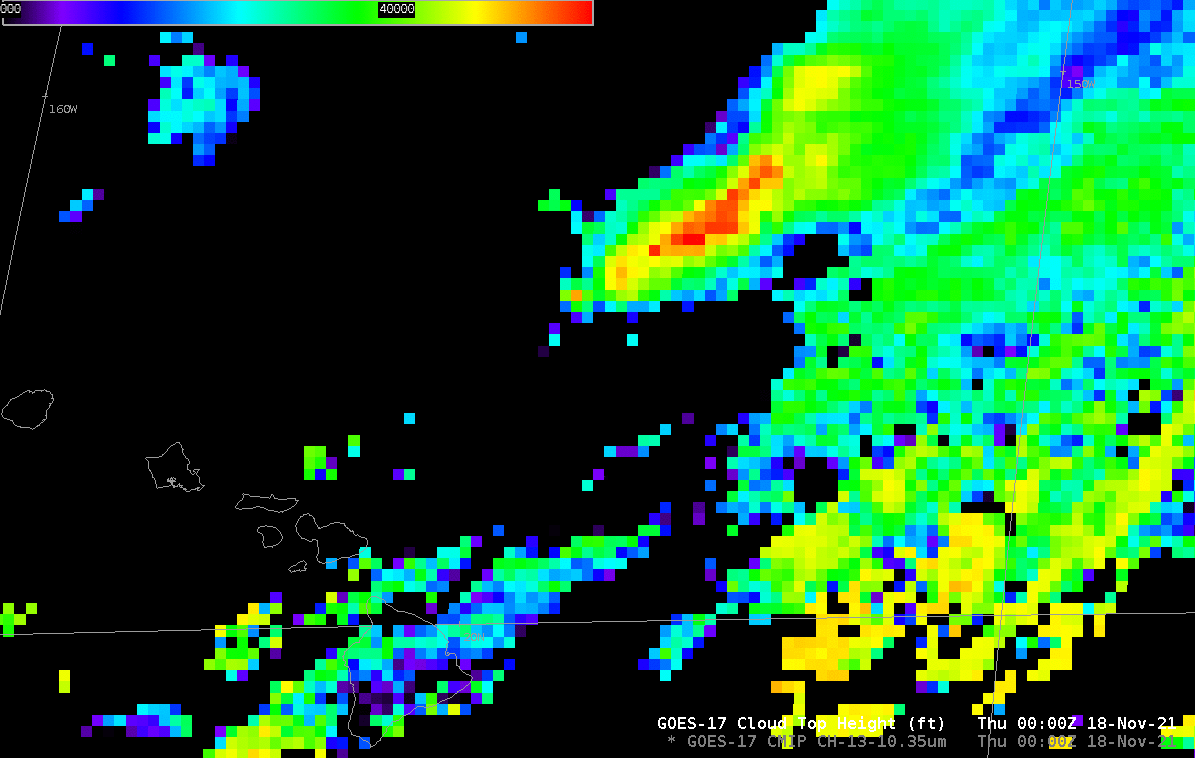
GOES-17 ABI Imagery (and level 2 Products), below, show persistent vigorous convection developing in a region with Lifted Indices around -2. Level 2 Cloud Top Height, at bottom, (the colorbar has been modified from default values to 35000-45000 feet), show persistent development of cloud tops exceeding 40000 feet, the cruising level of HAL51!
GOES-17 Band 13 (10.35 µm) Infrared imagery on top of the Level 2 Clear-sky Lifted Index, 0000 – 0250 UTC on 18 November 2021 (Click to enlarge)GOES-17 Level Cloud Top Height, 0000 – 0250 UTC on 18 November 2021; Colorbar values range from 35000-45000 feet (Click to enlarge)
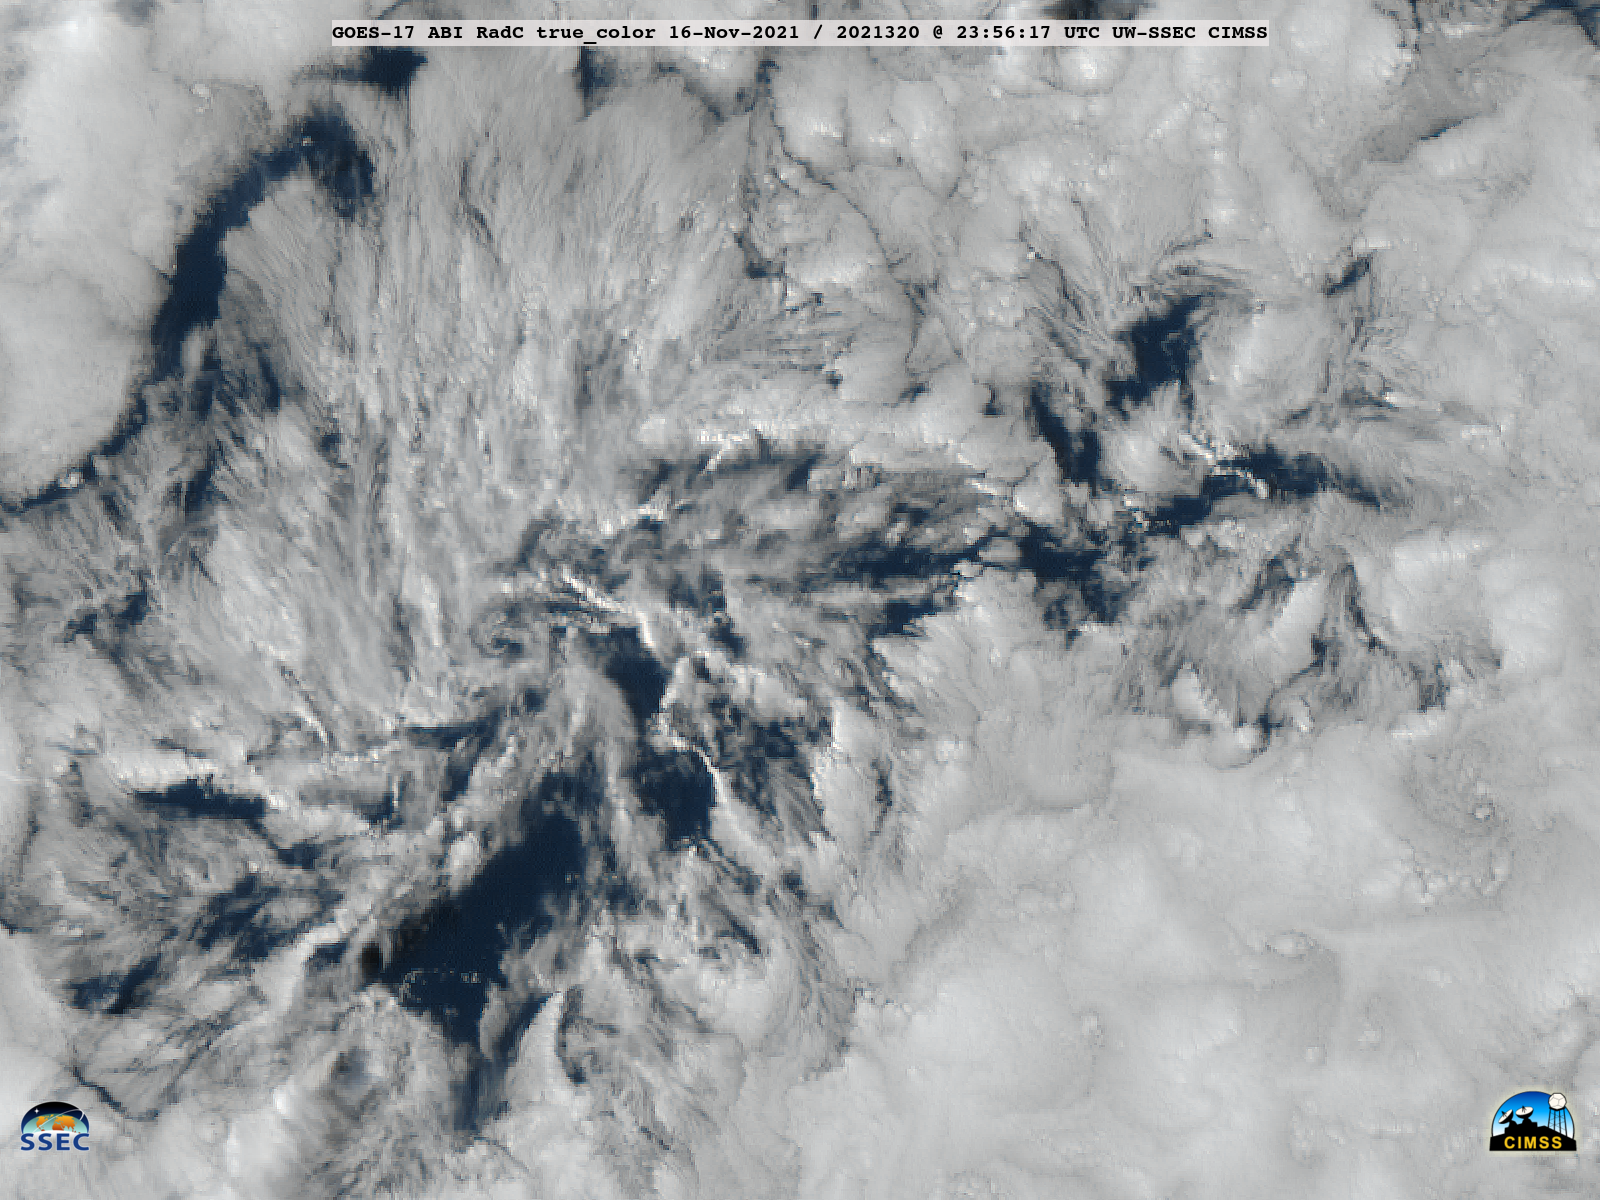
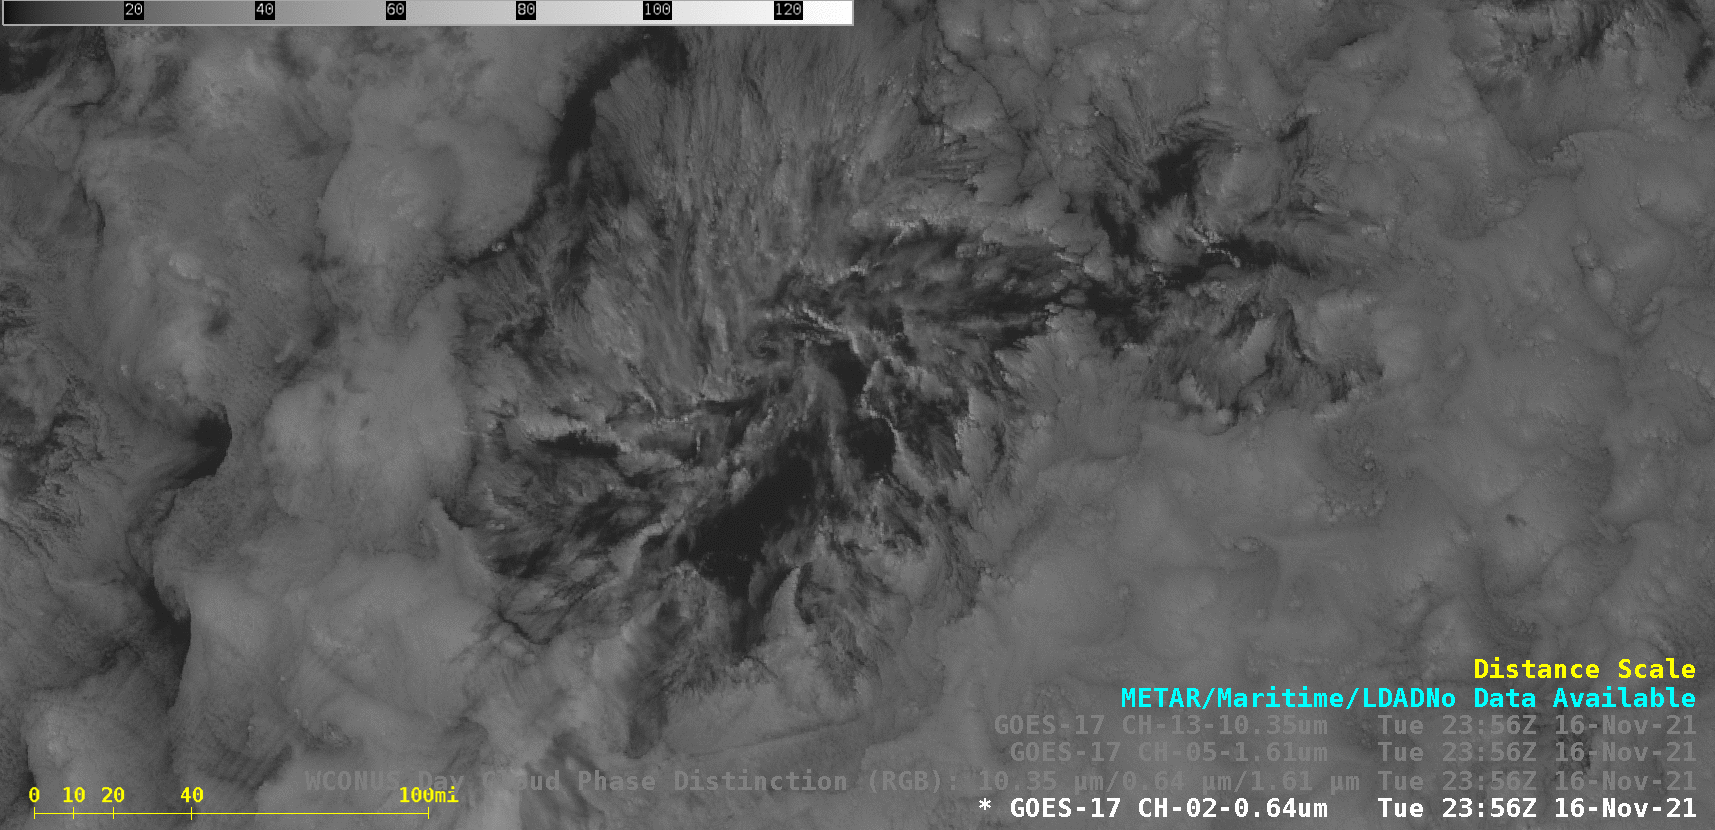
GOES-17 (GOES-West) True Color RGB images created using Geo2Grid (above) showed a cyclonically-rotating actinoform cloud feature that was moving west-southwestward across the East Pacific Ocean (about midway between Hawai’i and California) on 16 November 2021.In GOES-17 Day Cloud Phase Distinction RGB images (below), the increasing shades of green exhibited by the curved bands of... Read More
GOES-17 True Color RGB images [click to play animated GIF | MP4]
GOES-17 (GOES-West) True Color RGB images created using Geo2Grid(above) showed a cyclonically-rotating actinoform cloud feature that was moving west-southwestward across the East Pacific Ocean (about midway between Hawai’i and California) on 16 November 2021.
In GOES-17 Day Cloud Phase Distinction RGB images (below), the increasing shades of green exhibited by the curved bands of shallow convection suggested that those features were likely mixed-phase clouds — composed of a combination of liquid/supercooled water droplets and ice particles.
GOES-17 Day Cloud Phase Distinction RGB images [click to play animated GIF | MP4]
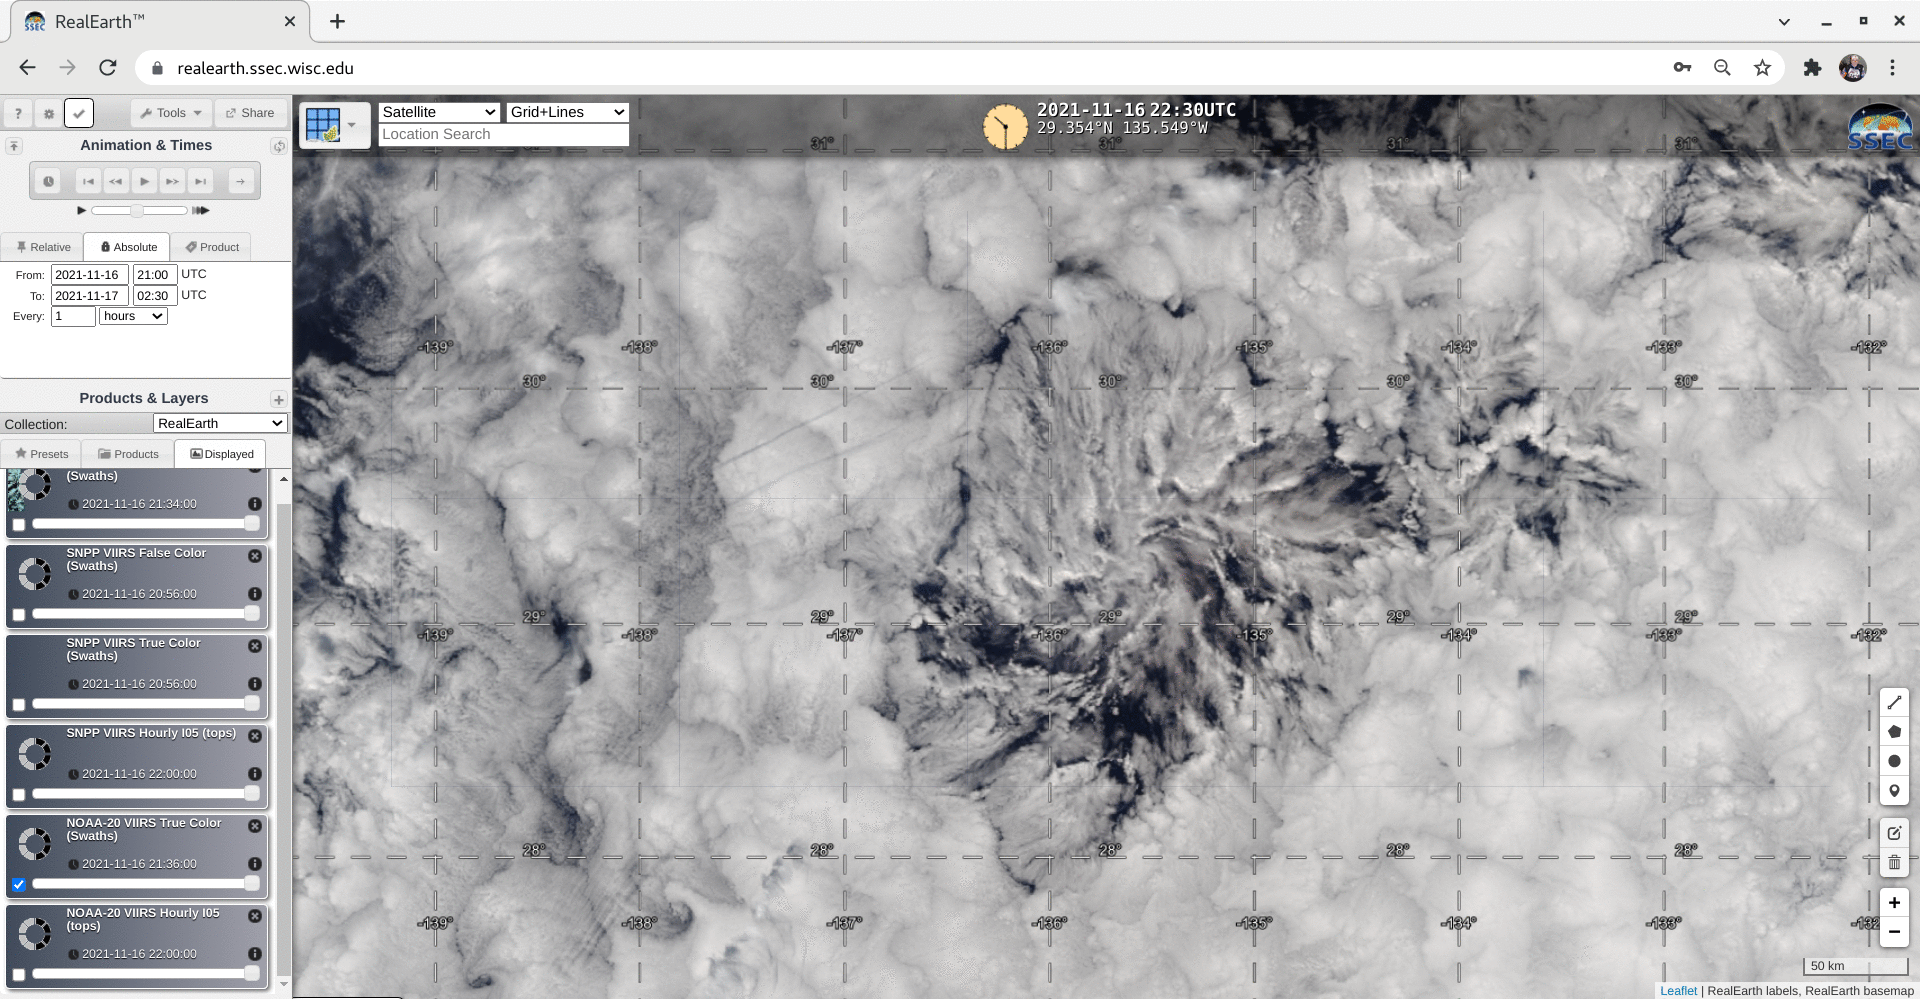
Similarly, in a toggle between NOAA-20 VIIRS True Color and False Color RGB images viewed using RealEarth(below), darker shades of cyan suggested the presence of mixed-phase banded cloud elements within the core of the actinoform feature.
NOAA-20 VIIRS True Color and False Color images at 2218 UTC [click to enlarge]
Other examples of actinoform clouds can be examined by scrolling through this link.


