This website works best with a newer web browser such as Chrome, Firefox, Safari or Microsoft Edge. Internet Explorer is not supported by this website.

Satellite signatures of the SpaceX/NASA Crew-3 launch

On 10 November 2021, SpaceX and NASA launched the Crew-3 mission to the International Space Station from Kennedy Space Center in Florida at 7:03 pm EDT (0203 UTC on 11 November). GOES-16 (GOES-East) Mesoscale Domain Sector 1 provided images at 1-minute intervals (above) — reflectance and/or thermal signatures of the Falcon-9 rocket booster were... Read More

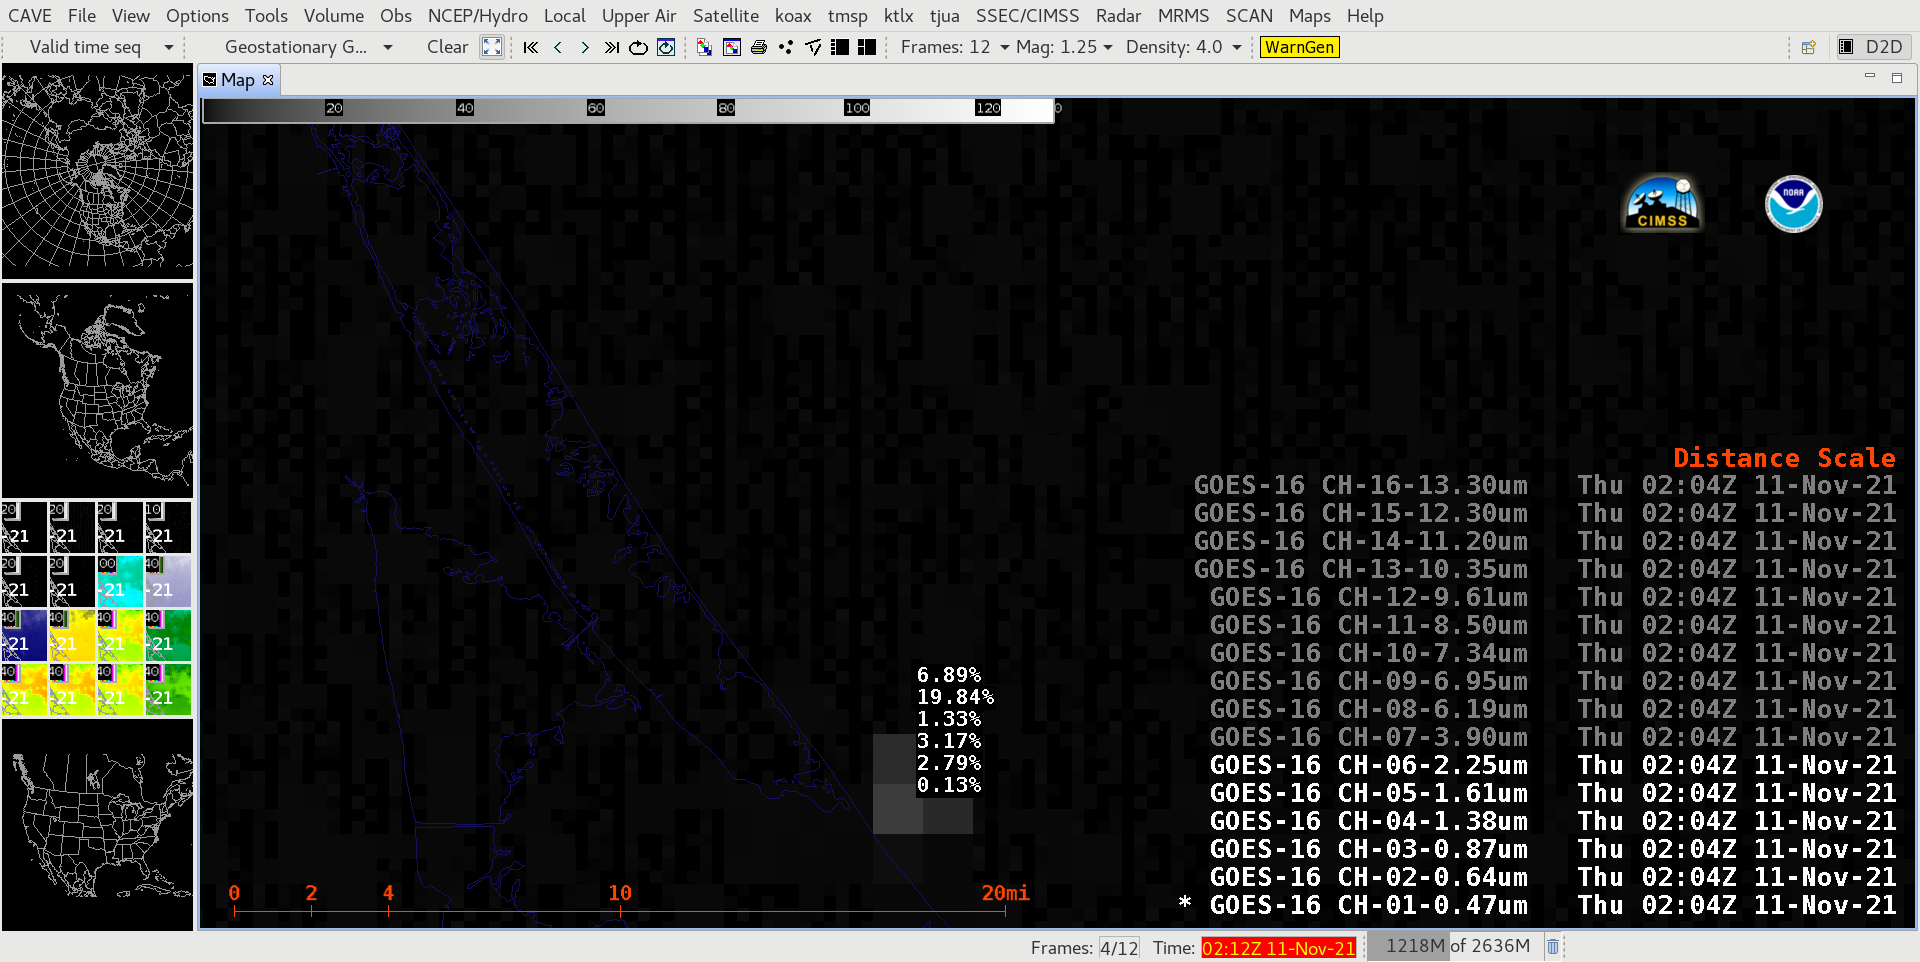
GOES-16 ABI spectral bands 1-16 [click to play animated GIF | MP4]

On 10 November 2021, SpaceX and NASA launched the Crew-3 mission to the International Space Station from Kennedy Space Center in Florida at 7:03 pm EDT (0203 UTC on 11 November). GOES-16 (GOES-East) Mesoscale Domain Sector 1 provided images at 1-minute intervals (above) — reflectance and/or thermal signatures of the Falcon-9 rocket booster were seen in 15 of the 16 ABI spectral bands during the initial portion of its northeastward trajectory. The hottest Shortwave Infrared (3.9 µm) brightness temperature was 70.63ºC at 0205 UTC (which was around the time of Second Stage ignition).

A zoomed-in comparison of GOES-16 Visible and Near-Infrared images at 0204 UTC (below) provided a better view of the signatures just off the coast of Florida — an AWIPS cursor sampling indicated that there was even a 0.13% reflectance signal in the 0.47 µm “Blue” Visible image (but this value was not bright enough to be seen using the default enhancement). 

Comparison of GOES-16 Visible and Near-Infrared images at 0204 UTC [click to enlarge]

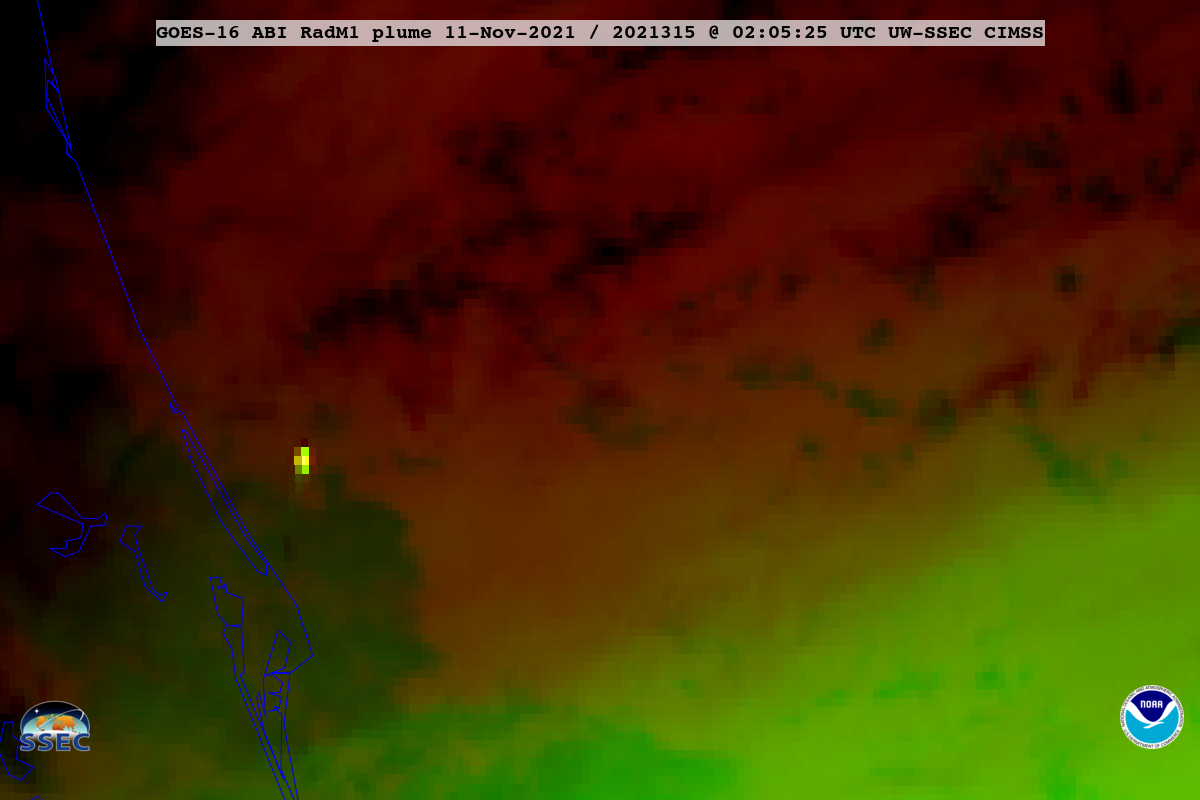
GOES-16 Plume RGB images (below) highlighted a bright thermal signature of the Falcon-9 rocket booster ascent, as well as the darker signature of low-altitude condensation clouds (resulting from the rocket launch) which moved slowly eastward.

GOES-16 Plume RGB (credit: Tim Schmit, NOAA/NESDIS) [click to play animated GIF]

A toggle between Plume RGB images from GOES-16 and GOES-17 at 0205 UTC (below) revealed a significant eastward parallax displacement of the yellow/orange thermal anomaly signature on the GOES-17 image. At that time, the rocket was at an altitude of about 70 km.

Plume RGB images from GOES-16 and GOES-17 at 0205 UTC (credit: Tim Schmit, NOAA/NESDIS) [click to enlarge]

View only this post Read Less

Cyclonic Development in the Indian Ocean

A tropical cyclone has developed in the Bay of Bengal and is moving northwest across the Indian subcontinent. The system is forecast to continue bringing heavy rains to Southern India until Thursday. It has already caused damage, flooding, and loss of life in Sri Lanka and India.Animations showing water vapor... Read More

A tropical cyclone has developed in the Bay of Bengal and is moving northwest across the Indian subcontinent. The system is forecast to continue bringing heavy rains to Southern India until Thursday. It has already caused damage, flooding, and loss of life in Sri Lanka and India.

Animations showing water vapor data from the Himawari-8 satellite’s Advanced Himawari Imager (AHI) can be found below. The first animation highlights cyclonic structure developing over the past two days every hour. In the final frame, a distinct eye is visible. Similar to the ABI aboard GOES-16/17, AHI collects data every ten minutes. The second animation shows the ten-minute temporal resolution of AHI for a shorter time period, zooming to see the ‘eye’ of the storm.

An hourly animation spanning 48 hours visualizing cyclone development using AHI Band 9 data in RealEarth, from 11/8/2021 20:57 UTC to 11/10/2021 20:57 UTC.
A zoomed-in view using the ten-minute data from AHI Band 9 data in RealEarth, on 11/10/2021 from 13:50 UTC to 22:10 UTC.

These animations were made using RealEarth, a free data discovery and visualization platform developed at SSEC/CIMSS at the University of Wisconsin-Madison. It is available to anyone at realearth.ssec.wisc.edu.


RealEarth also contains CMORPH estimates (hourly, daily and weekly) of precipitation. The daily precipitation from 10 November over the Bay of Bengal is shown below. The highest value in the colorbar is 150 mm — but in reality, the heaviest accumulations over the Bay of Bengal exceeded 300 mm!

Accumulated precipitation, estimated from CMORPH, for the 24 hours ending 2359 UTC on 10 November 2021 (Click to enlarge)

View only this post Read Less

Mid-tropospheric vortices over Alaska

GOES-17 (GOES-West) Mid-level (6.9 µm) Water Vapor images (above) revealed a complex pattern of middle-tropospheric vortices moving slowly west-southwestward over Interior Alaska and the Chukchi / Bering Seas on 09 November 2021. Note that the cold (brighter white) peaks of a few of the higher mountain ranges — including Denali — could... Read More

GOES-17 Mid-level Water Vapor (6.9 µm) images [click to play animated GIF | MP4]

GOES-17 (GOES-West) Mid-level (6.9 µm) Water Vapor images (above) revealed a complex pattern of middle-tropospheric vortices moving slowly west-southwestward over Interior Alaska and the Chukchi / Bering Seas on 09 November 2021. Note that the cold (brighter white) peaks of a few of the higher mountain ranges — including Denali — could be seen.

The presence of a relatively dry air mass across those areas allowed the signature of higher terrain to be evident in Water Vapor images — since a dry air mass has the effect of shifting the peaks of Water Vapor weighting functions to lower altitudes. The weighting function of the 6.9 µm spectral band (calculated from rawinsonde data at 12 UTC on 09 November and 00 UTC on 10 November) is plotted in blue for Fairbanks and Anchorage (below).

GOES-17 water vapor weighting functions for Fairbanks, Alaska [click to enlarge]

GOES-17 water vapor weighting functions for Anchorage, Alaska [click to enlarge]

Plots of GOES-17 parallax direction and magnitude for objects at altitudes of 15,000 feet (4.5 km) and 30,000 feet (9.1 km) are shown below (source), and help to explain the slight north-northwestward shift of the brighter white (colder) high-terrain signature in the Water Vapor imagery.

Plots of GOES-17 parallax direction (green arrows) and parallax magnitude (km, red) for objects at altitudes of 15,000 and 30,000 feet (4.5 and 9.1 km) [click to enlarge]

View only this post Read Less

ACSPO SSTs on 9 November

The Advanced Clear Sky Processor for Ocean algorithm is part of the Community Software Processing Package (CSPP), CIMSS-maintained software that can be applied to Direct Broadcast data, such as those data from NOAA-20 and Suomi-NPP (and other satellites) downloaded at two antennae at CIMSS. CSPP will create AWIPS-ready tiles so that SST information can be... Read More

ACSPO SSTs over the northern Gulf of Mexico derived from NOAA-20 VIIRS data, 0800 UTC 09 Nov 2021 (Click to enlarge)

The Advanced Clear Sky Processor for Ocean algorithm is part of the Community Software Processing Package (CSPP), CIMSS-maintained software that can be applied to Direct Broadcast data, such as those data from NOAA-20 and Suomi-NPP (and other satellites) downloaded at two antennae at CIMSS. CSPP will create AWIPS-ready tiles so that SST information can be viewed within AWIPS (as shown above and below) and the AWIPS-ready tiles are available via LDM feed from CIMSS (images — rather large — are also routinely available online: here for the image above, here for the Suomi-NPP-derived image below).

Both SST images show remarkable gradients in sea surface temperature: upper 60s (cyan) to low 80s (yellow) just south of Louisiana in less than 20 miles (above); low 60s (blue) to 80 (chartreuse) to the east of the Outer Banks, also in less than 20 miles (below). The warmest water in the Gulf of Mexico is around 83º F, and shelf water is in the mid-60s. Warmest Gulf Stream waters are around 81º F. Magenta values correspond to temperatures in the 50s.

ACSPO SSTs over the northern Gulf of Mexico derived from Suomi-NPP VIIRS data, 0710 UTC 09 Nov 2021 (Click to enlarge)

View only this post Read Less