This website works best with a newer web browser such as Chrome, Firefox, Safari or Microsoft
Edge. Internet Explorer is not supported by this website.
This NOAA/NESDIS website shows small footprints where SAR observations of ice and wind (from the RADARSAT Constellation Mission — RCM — satellites and from Sentinel) are available. AWIPS-ready data are also available from an ftp site. Consider the animation of GOES-17 Band 13 imagery above, just south to the Equator, and to... Read More
GOES-17 ABI Band 13 (Clean Window Infrared, 10.3 µm), 0400-0510 UTC on 11 July 2022, along with SAR Wind observations at 0513 UTC (Click to enlarge)
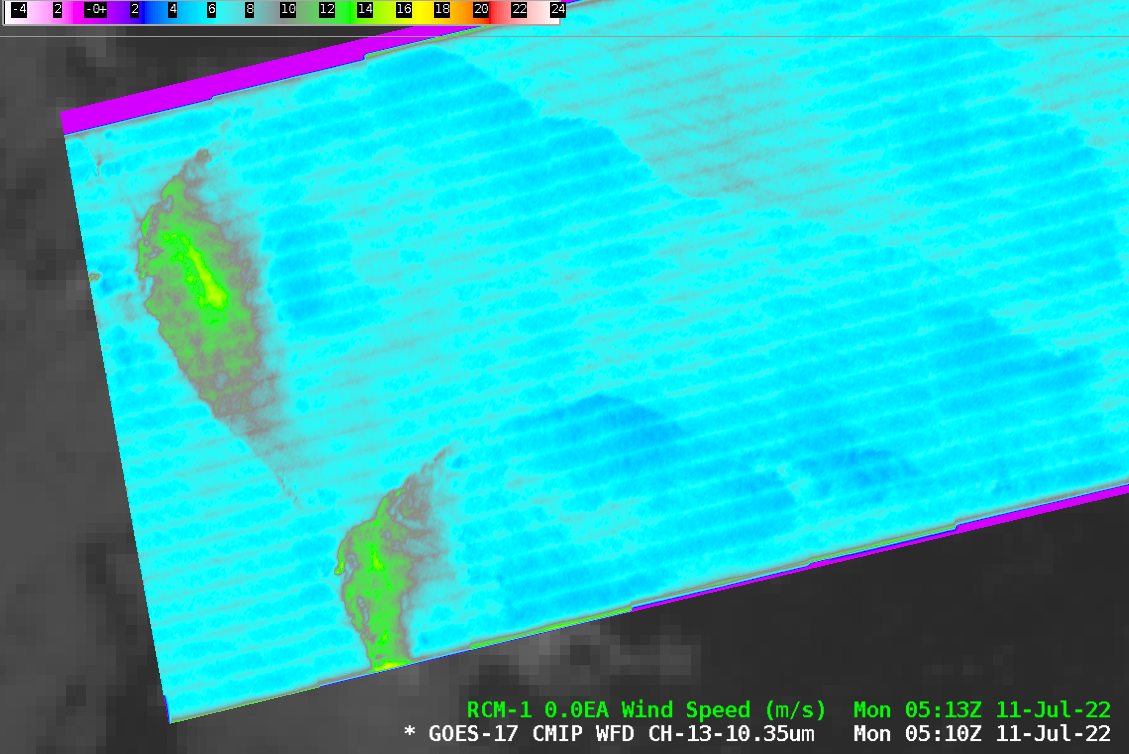
This NOAA/NESDIS website shows small footprints where SAR observations of ice and wind (from the RADARSAT Constellation Mission — RCM — satellites and from Sentinel) are available. AWIPS-ready data are also available from an ftp site. Consider the animation of GOES-17 Band 13 imagery above, just south to the Equator, and to the west of 160oW longitude. The slightly cooler brightness temperatures at the eastern edge of the arc of clouds moving to the west is associated with two patches of strong surface winds. The toggle below zooms in on the region of winds. Surface wind speeds are close to 15 m s-1 with this weak line of tropical convection.
GOES_17 ABI Band 13 (Clean Window infrared, 10.3 µm) at 0510 UTC and RCM1 SAR Winds at 0513 UTC, 11 July 2022 (Click to enlarge)
GOES-18 images in this blog post are preliminary and non-operational Overlapping 1-minute Mesoscale Domain Sectors provided GOES-18 “Red” Visible (0.64 µm) images at 30-second intervals (above), which include time-matched SPC Storm Reports. This imagery showed widespread thunderstorms that moved eastward across Montana on 09 July 2022, which produced damaging straight-line winds as strong as 78... Read More
GOES-18 “Red” Visible (0.64 µm) images, with time-matched SPC Storm Reports plotted in red [click to play animated GIF | MP4]
GOES-18 images in this blog post are preliminary and non-operational
Overlapping 1-minute Mesoscale Domain Sectors provided GOES-18 “Red” Visible (0.64 µm) images at 30-second intervals (above), which include time-matched SPC Storm Reports. This imagery showed widespread thunderstorms that moved eastward across Montana on 09 July 2022, which produced damaging straight-line winds as strong as 78 mph and hail as large as 2.00 inches.
30-second GOES-18 “Clean” Infrared Window (10.35 µm) images (below) extended for several hours past sunset, and indicated that the coldest overshooting tops exhibited infrared brightness temperatures around -70ºC (darker black enhancement). Given that the radar at NWS Glasgow was out of service (due to a lightning strike the previous night), this type of 30-second GOES imagery could have served as a valuable source of information to help monitor thunderstorm evolution.
GOES-18 “Clean” Infrared Window (10.35 µm) images, with time-matched SPC Storm Reports plotted in blue [click to play animated GIF | MP4]
An animation from the CSPP Geosphere site, above (link), shows a quiescent period in/around Samoa and American Samoa. Low clouds (purple and pink) occasionally developed overnight into showers (dark red) that then dissipated.NOAA-20 overflew the Samoan islands at around 1200 UTC on 8 July, as shown in the toggle below... Read More
GOES_17 Night Microphysics RGB, 1030 – 1340 UTC on 8 July 2022
An animation from the CSPP Geosphere site, above (link), shows a quiescent period in/around Samoa and American Samoa. Low clouds (purple and pink) occasionally developed overnight into showers (dark red) that then dissipated.
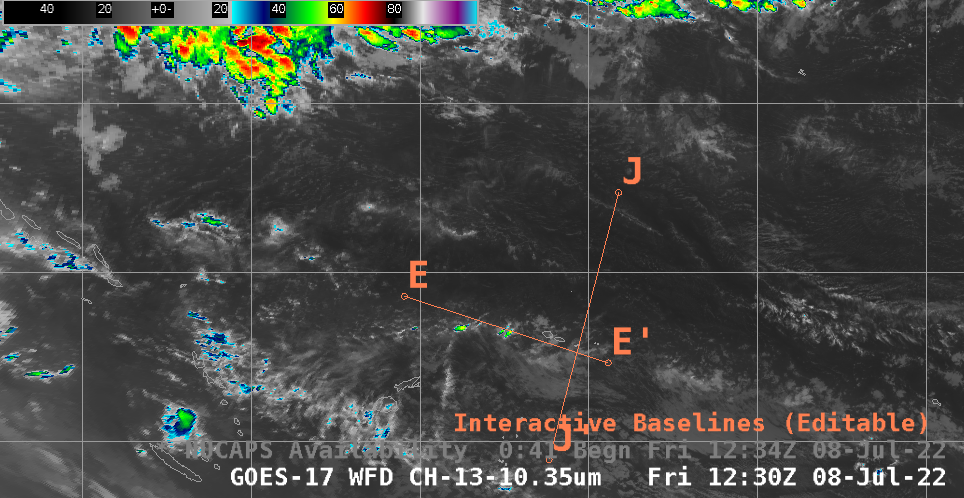
NOAA-20 overflew the Samoan islands at around 1200 UTC on 8 July, as shown in the toggle below with GOES-17’s clean window imagery (10.3 µm). The clean window imagery (as well as NOAA-20’s Day Night Band visible imagery) show no organized or large areas of precipitation, although some cold cloud tops suggest a few showers to the west of Samoa at 1230 UTC. The location of NUCAPS profiles are shown. These profiles can be used to create gridded horizontal fields of thermodynamic variables (available in AWIPS, and also at this site).
GOES-17 Clean Window infrared (10.3 µm) imagery along with NUCAPS Sounding Availability points, all ca. 1230 UTC on 8 July 2022. The location of two cross-sections are shown as well (Click to enlarge)
The Samoan islands are within a narrow band of enhanced total precipitable water, as shown in the MIMIC Total Precipitable Water fields below (current data; archive data). As noted above, no organized shower activity is associated with this moist band.
MIMIC Total Precipitable Water estimates, 1000 – 1400 UTC on 8 July 2022 (Click to enlarge)
The Cross-Section lines J-J’ and E-E’ are represented in the GOES-17 imagery, and cross-sections of equivalent potential temperature from gridded NUCAPS Fields and from the 1-degree Global GFS model are shown below. The J-J’ cross-sections are similar: Strong low-level Potential Instability at the edges with a weaker low-level potential instability in the center of the cross-section. The 1200 UTC Sounding from Pago Pago is shown here, from this site. The atmosphere is moist up to 550 mb.
Cross Section along line J-J’, ca. 1200 UTC on 8 July 2022 (Click to enlarge)Cross Section along line E-E’, ca. 1200 UTC on 8 July 2022 (Click to enlarge)
Use Cross Sections of gridded NUCAPS fields (accessible as shown in this blog post) to make comparisons to numerical models in regions where conventional data are sparse — such as over the Pacific Ocean.
This blog post used imagery from the NOAA/NESDIS TOWR-S cloud instance of AWIPS. Thank you!
GOES-16 infrared (above) and visible (below) imagery late in the afternoon of 5 July 2022 show the development of convection in between Baltimore and the District of Columbia. Tornadoes occurred in both Prince George County, just east and north of the District of Columbia, and over Anne Arundel county, just... Read More
GOES-16 Band 13 infrared (10.3 µm) imagery, 2001 – 2256 UTC, 5 July 2022 (Click to enlarge)
GOES-16 infrared (above) and visible (below) imagery late in the afternoon of 5 July 2022 show the development of convection in between Baltimore and the District of Columbia. Tornadoes occurred in both Prince George County, just east and north of the District of Columbia, and over Anne Arundel county, just south of Baltimore (SPC Storm reports from 5 July). The storms that spawned these tornadoes (between 2130 UTC and 2200 UTC) developed quickly between DC and Baltimore, with tops cooling to about -55oC. Note that a parallax shift (to the south-southeast, towards the GOES-16 sub-satellite point at 0o N, 75.2o W) should be applied to these images to georeference them properly to the Earth’s surface. The repetitive re-development of cooler cloud tops between DC and Baltimore from 2100 – 2300 UTC suggests some kind of boundary to focus development in that region.
GOES-16 Band 2 infrared (0.64 µm) imagery, 2001 – 2256 UTC, 5 July 2022 (Click to enlarge)
NOAA/CIMSS ProbSevere (v. 3) — available at this website (and in AWIPS at select NWS Offices) was useful for this storm in that it showed highest values with the radar object associated with the tornado, thus conveying information to a forecaster (or radar operator) on which cell to investigate most thoroughly. The radar cell that spawned the tornado consistently had ProbSevere values exceeding 40%, compared to values in the 10-20% range for other radar objects.
ProbSevere (v. 3) display at 5-minute time-steps, 2000 – 2200 UTC on 5 July 2022 (Click to enlarge)
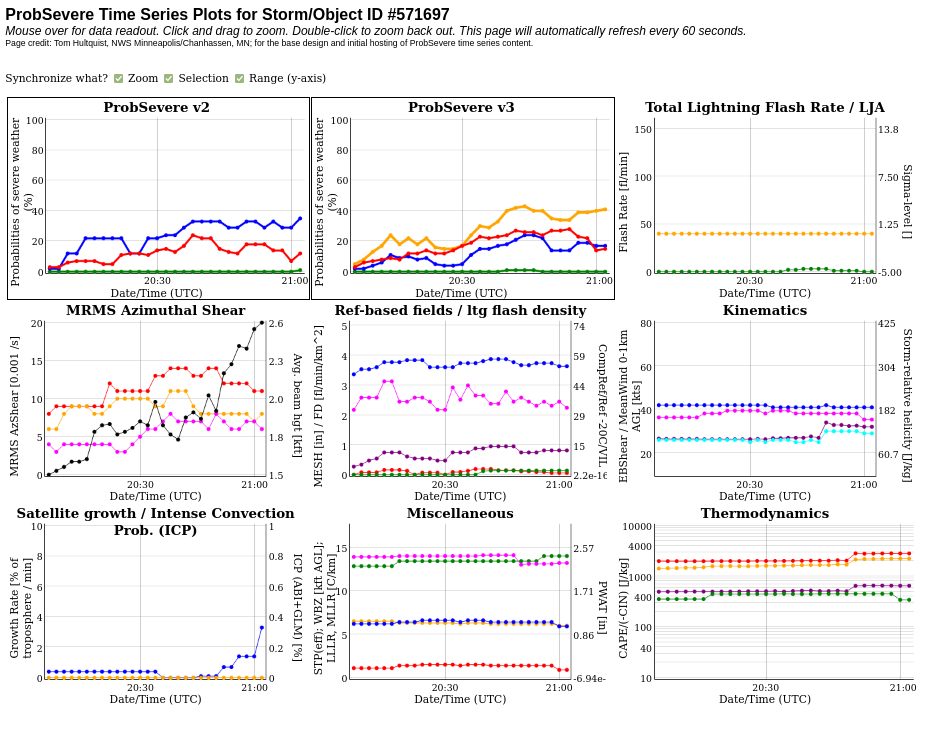
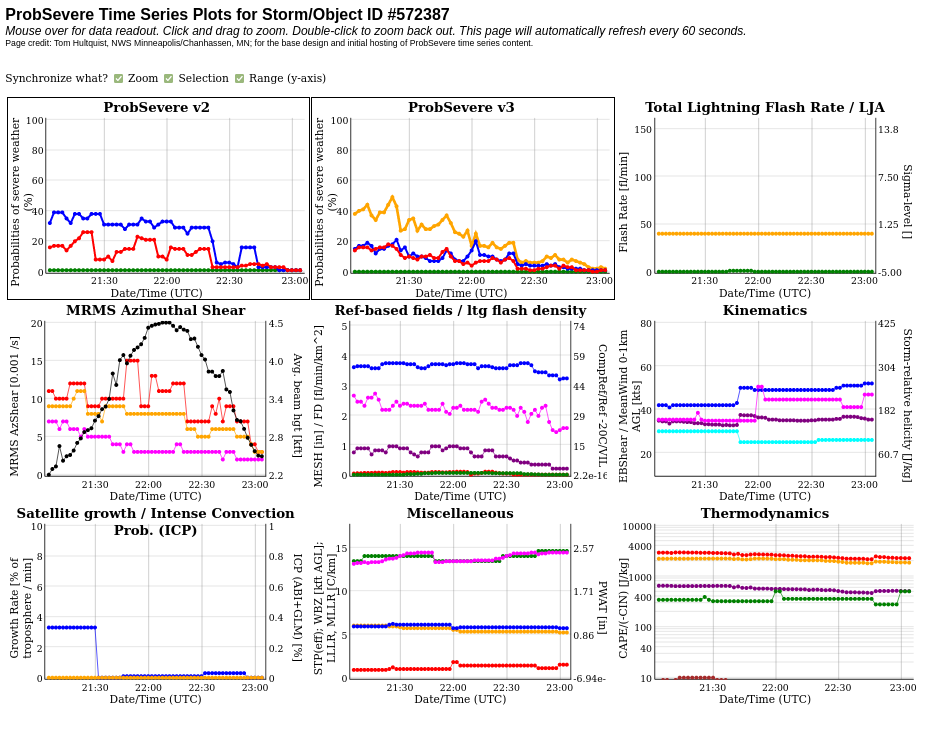
The ProbSevere website includes links to print out time series plots of particular radar objects. For this event, analysis is a bit complicated because the radar object was assigned a new ID value between 2100 and 2105 UTC, perhaps associated with the radar object splitting, as shown in this 2100/2105 UTC toggle, when the radar object was northeast of DC and southwest of Baltimore.
ProbSevere readout for Radar Object #571697, ca. 2000 – 2100 UTC on 5 July 2022 (Click to enlarge)ProbSevere readout for Radar Object #572387, ca. 2100 – 2300 UTC on 5 July 2022 (Click to enlarge)
ProbSevere (v. 3) on this data gave useful information in highlighting the advanced threat with this particular cell compared to surrounding radar cells.
This event was also written up in the Washington Post (link). (Thanks to my sister for sending me the link!) Severe Thunderstorm warnings with the severe cell were issued at 2055 UTC (expiring at 2145 UTC), and at 2118 UTC (expiring at 2215 UTC); the first tornado warning was issued at 2121 UTC (expiring at 2145 UTC). The cell that produced the tornadoes had a long warning history.


