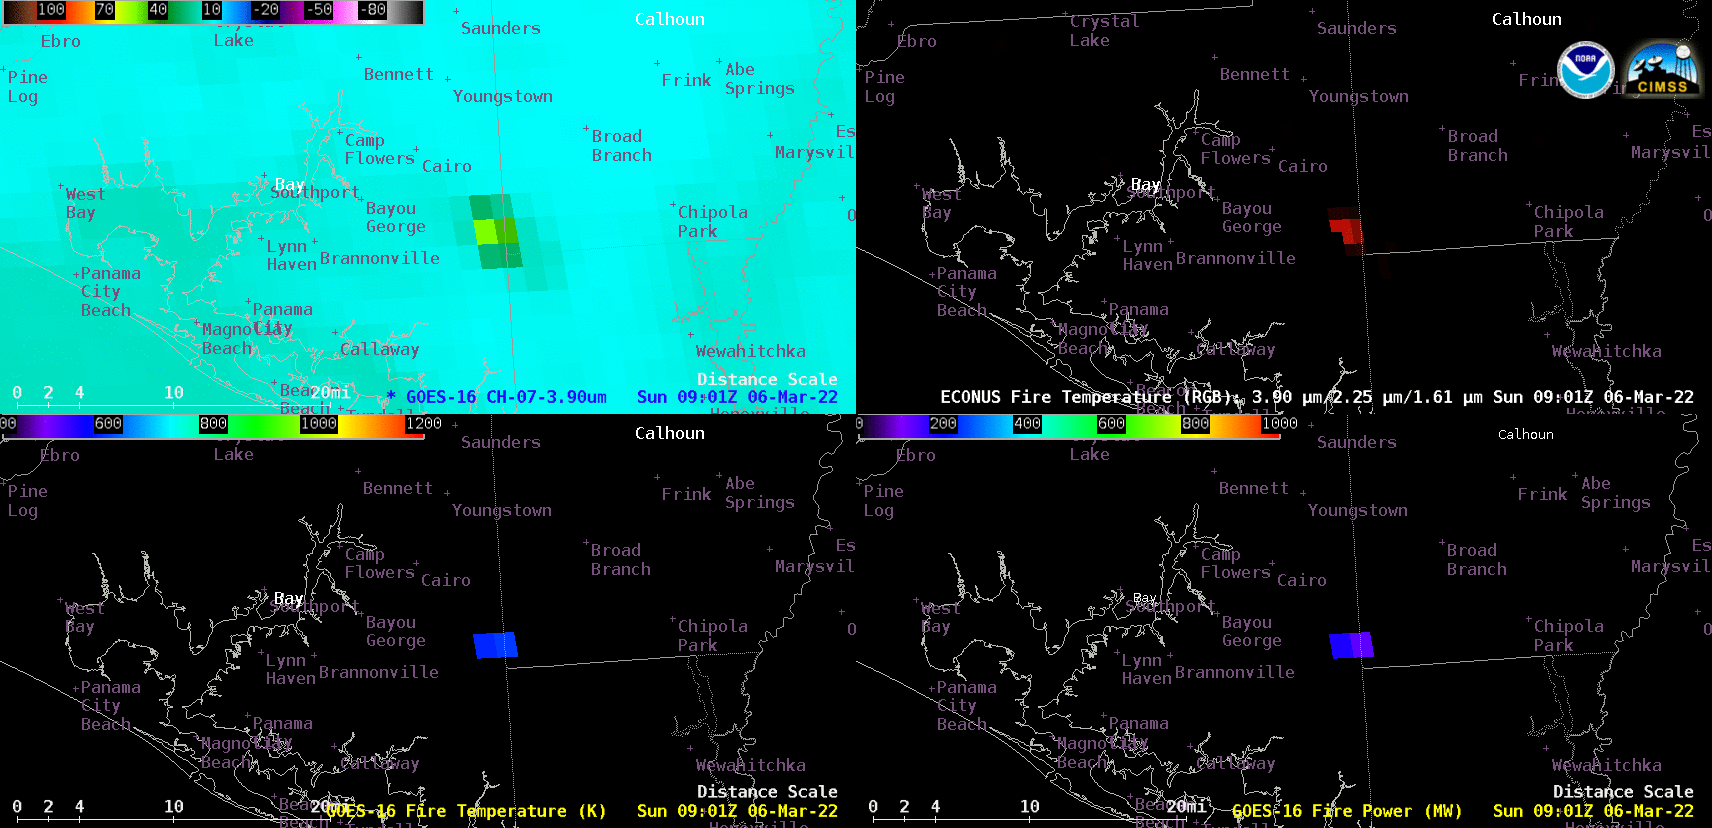
GOES-16 (GOES-East) Shortwave Infrared (3.9 µm), Fire Temperature RGB. Fire Temperature and Fire Power products (above) displayed signatures of the large Bertha Swamp Road Fire and a smaller Adkins Avenue Fire near Panama City in the Florida Panhandle on 06 March 2022. With the Bertha Swamp Road Fire, 3.9 µm Shortwave Infrared brightness temperatures reached 138.71ºC —... Read More

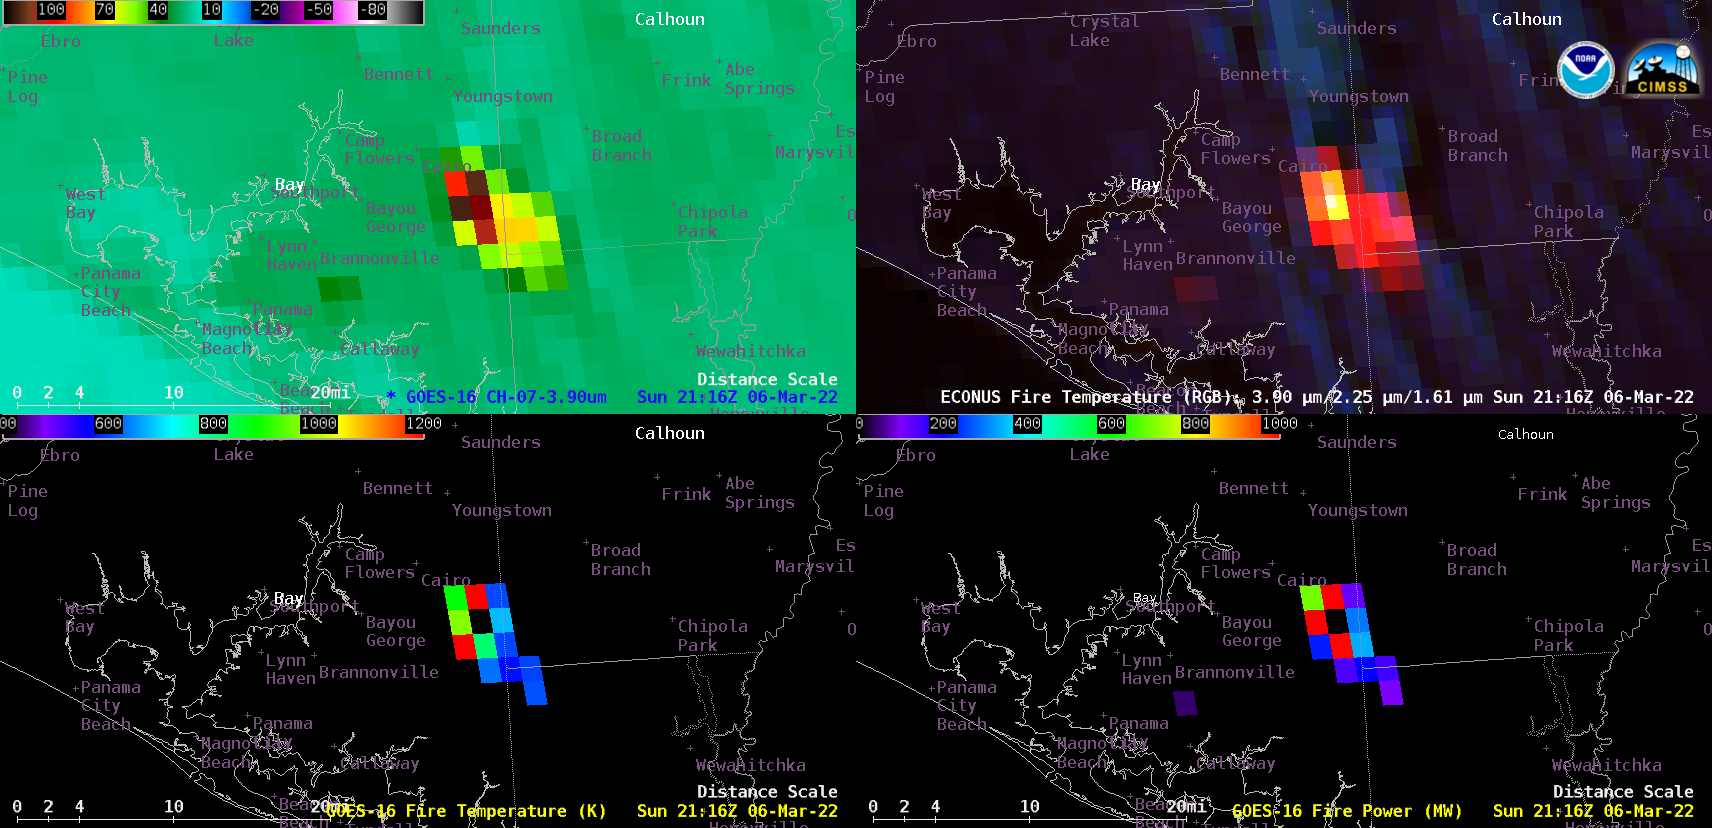
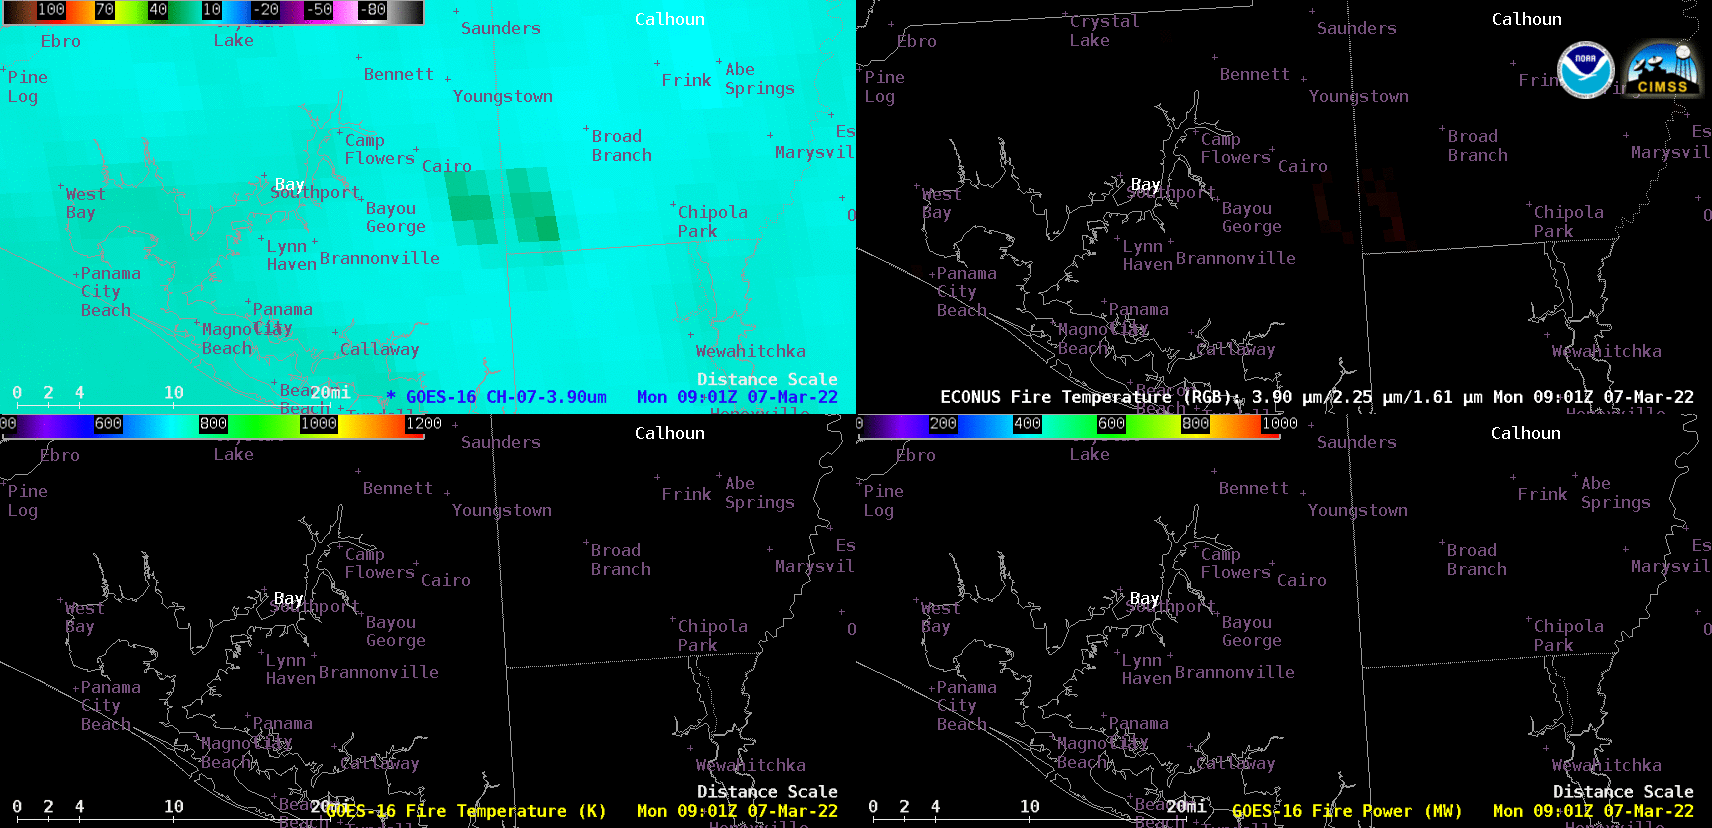
GOES-16 Shortwave Infrared (3.9 µm, top left), Fire Temperature RGB (top right), Fire Temperature (bottom left) and Fire Power (bottom right) products [click to play animated GIF | MP4]
GOES-16 (GOES-East) Shortwave Infrared (3.9 µm), Fire Temperature RGB. Fire Temperature and Fire Power products (above) displayed signatures of the large Bertha Swamp Road Fire and a smaller Adkins Avenue Fire near Panama City in the Florida Panhandle on 06 March 2022. With the Bertha Swamp Road Fire, 3.9 µm Shortwave Infrared brightness temperatures reached 138.71ºC — the saturation temperature of ABI Band 7 detectors — the derived Fire Temperature maximum value was 2287.24 K, and Fire Power values peaked at 1440 MW. The Fire Temperature and Fire Power derived products are components of the GOES Fire Detection and Characterization Algorithm FDCA.
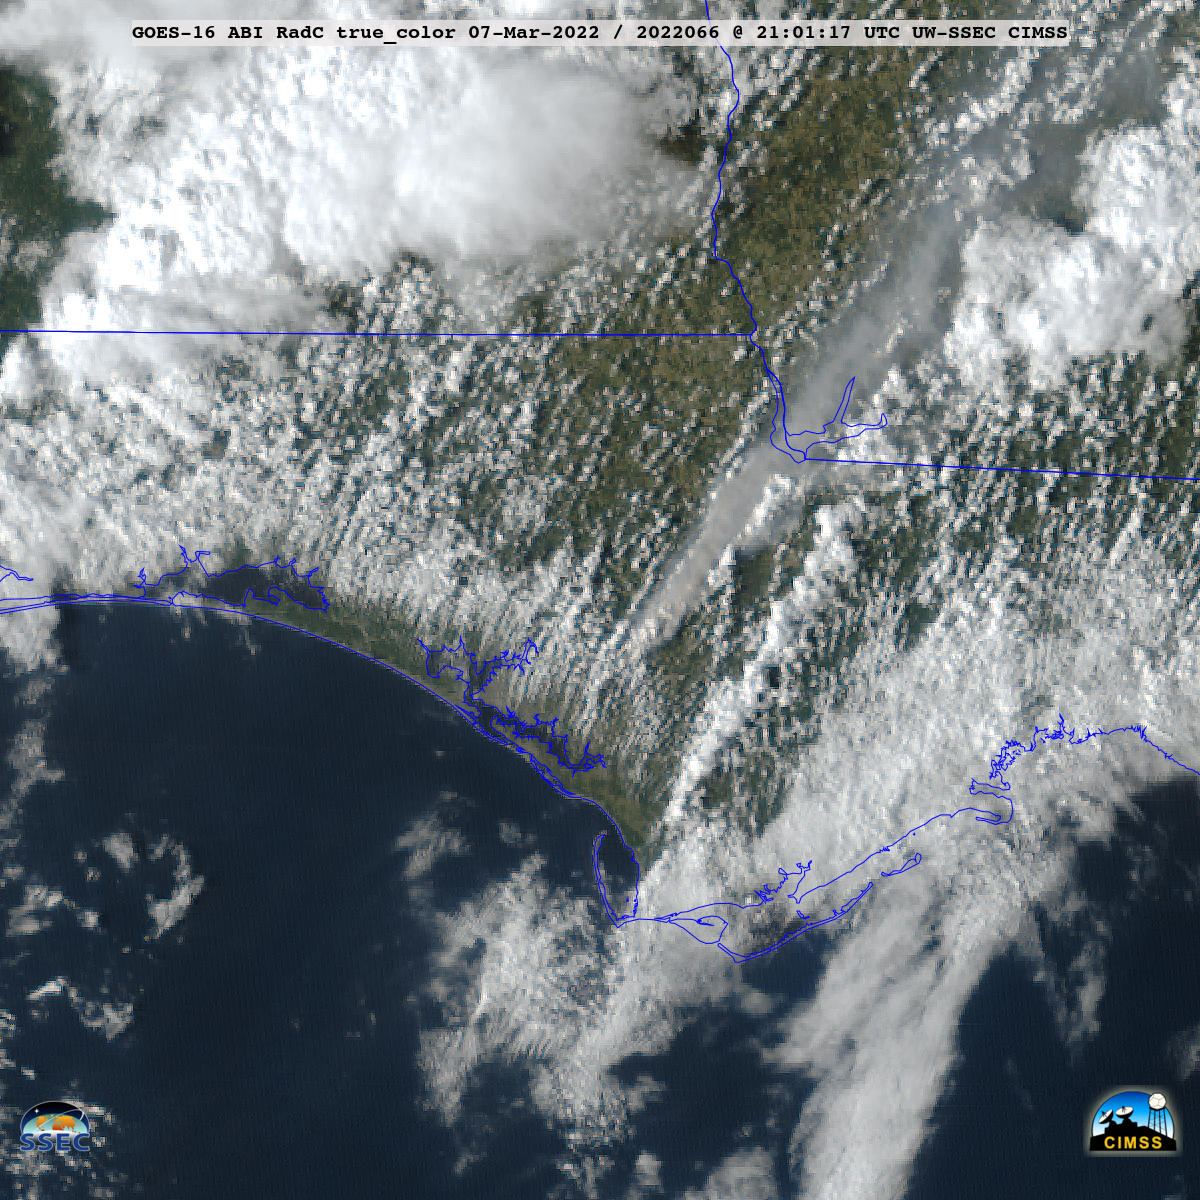
GOES-16 True Color RGB images created using Geo2Grid (below) showed smoke-laden pyrocumulus clouds (created by the very hot Bertha Swamp Road Fire), which rose above the level of boundary layer cumulus cloud streets that were moving inland across the area.
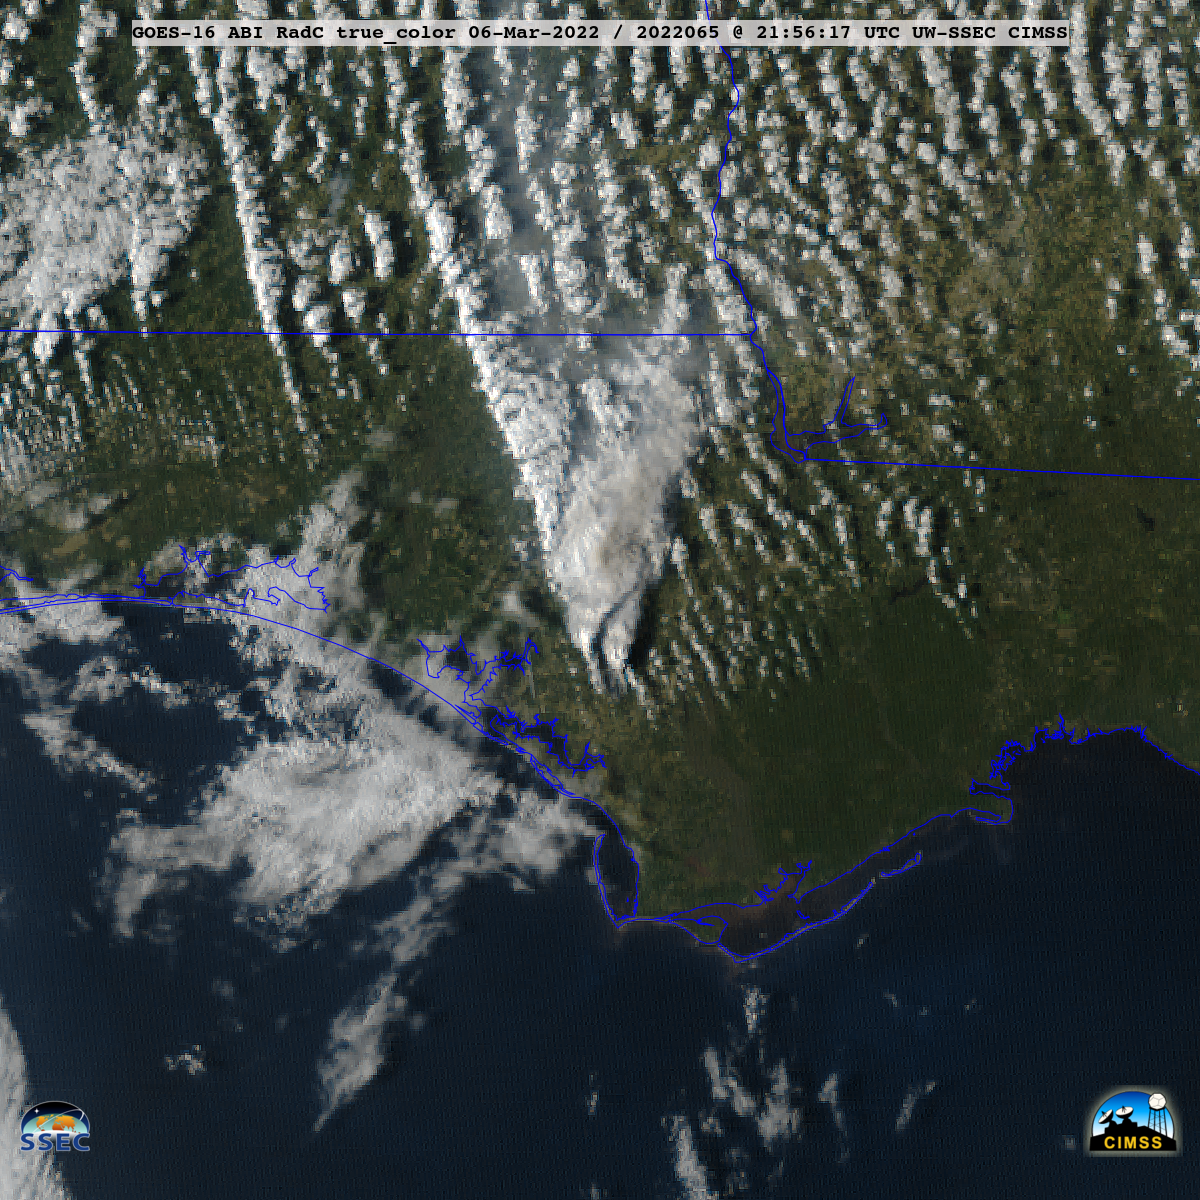
GOES-16 True Color RGB images [click to play animated GIF | MP4]
These fires were occurring in an area affected by the landfall of Hurricane Michael in 2018 — where a large amount of downed trees (within the shades of tan to light brown shown below on 18 October 2018) still remained. Both fires were located near the center of the MODIS images.
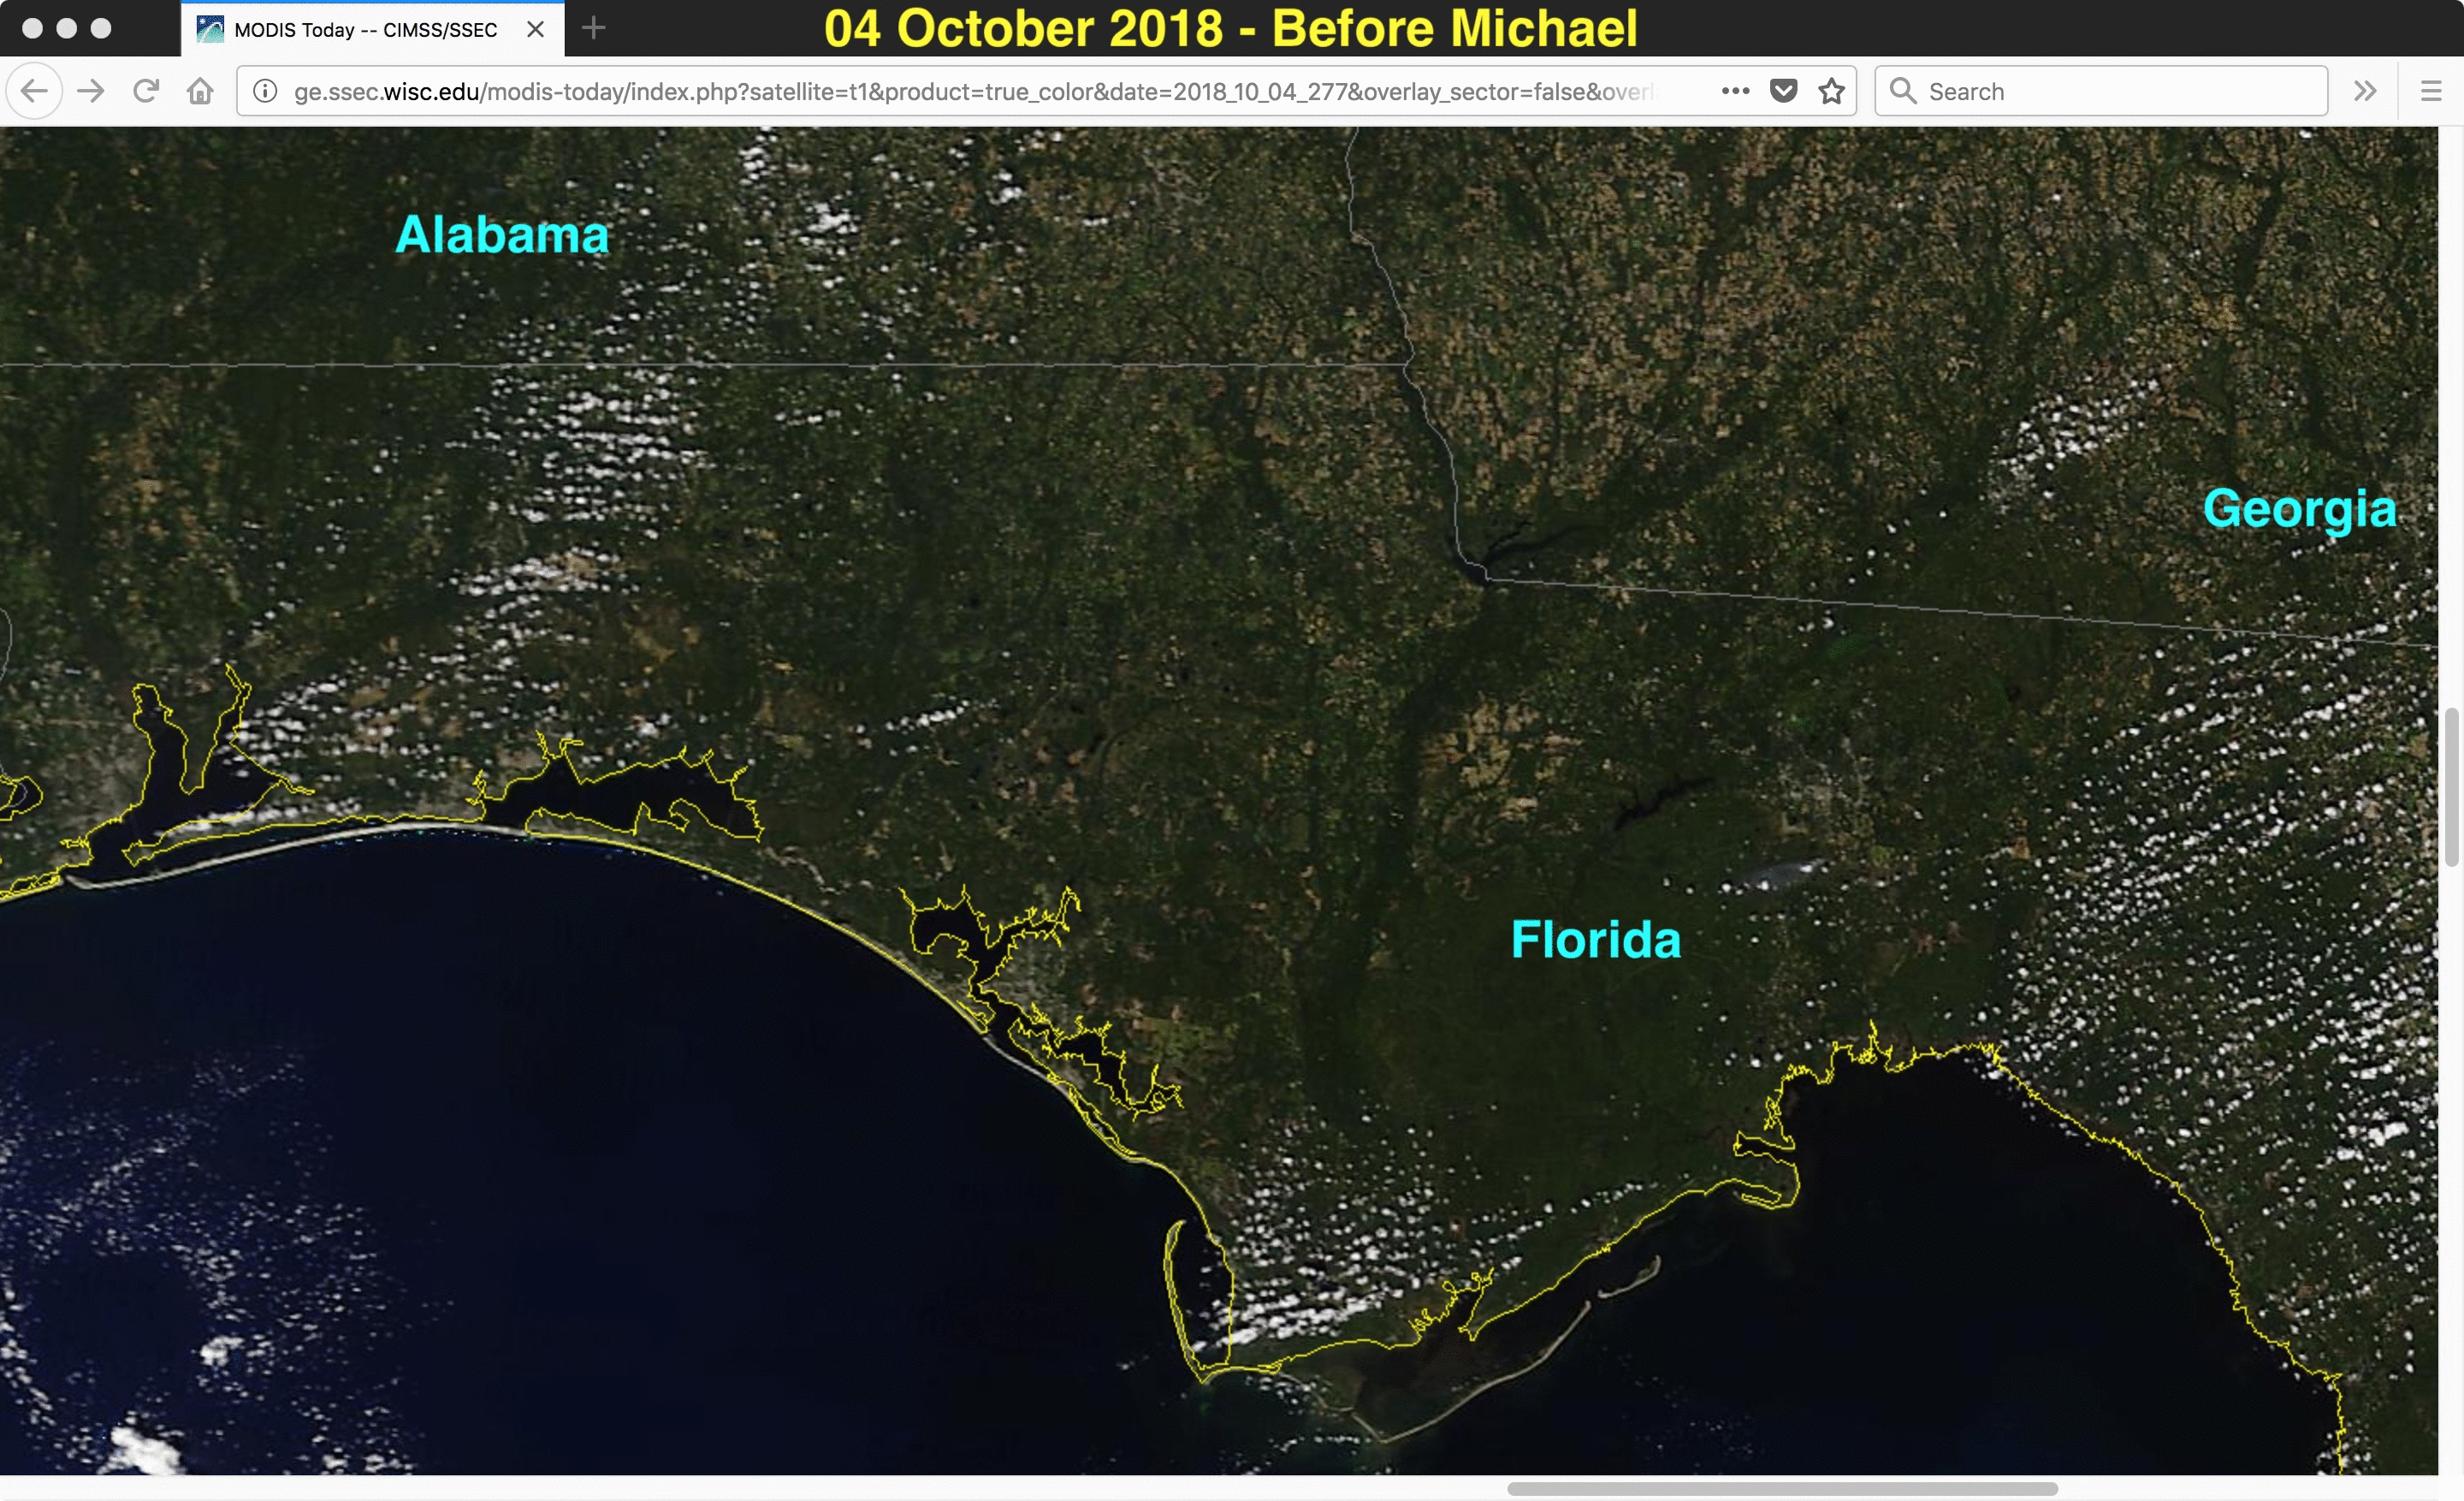
Terra MODIS True Color RGB images, before/after the landfall of Hurricane Michael [click to enlarge]
===== 07 March Update =====
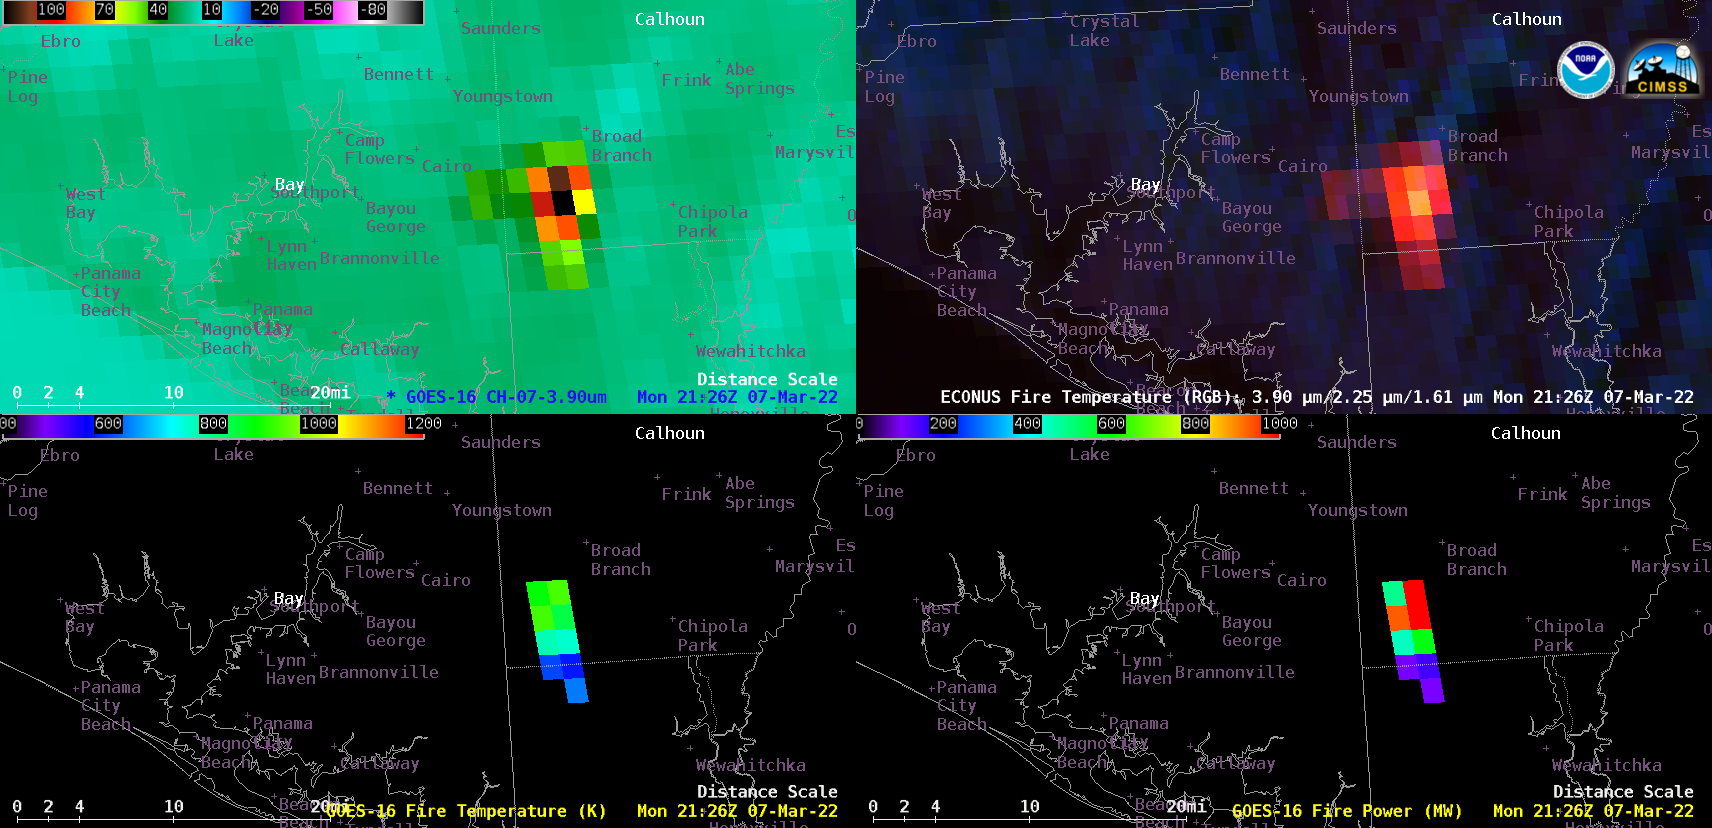
GOES-16 Shortwave Infrared (3.9 µm, top left), Fire Temperature RGB (top right), Fire Temperature (bottom left) and Fire Power (bottom right) products [click to play animated GIF | MP4]
On 08 March, increasing surface wind speeds led to a consolidation of fires to form the Chipola Complex — and GOES-16 Shortwave Infrared, Fire Temperature RGB, Fire Temperature and Fire Power (above) indicated that this fire complex was centered in far southwestern Calhoun County, Florida. Clouds often partially obscured a clear view of the entire fire, but the 3.9 µm Shortwave Infrared brightness temperatures reached 135.91ºC, the derived Fire Temperature maximum value was 1649 K, and Fire Power values peaked at 2121 MW.
GOES-16 True Color RGB images (below) again showed some pyrocumulus clouds near the fire source, with a larger smoke plume that extended well into southwestern Georgia.
GOES-16 True Color RGB images [click to play animated GIF | MP4]
View only this post
Read Less


