This website works best with a newer web browser such as Chrome, Firefox, Safari or Microsoft
Edge. Internet Explorer is not supported by this website.
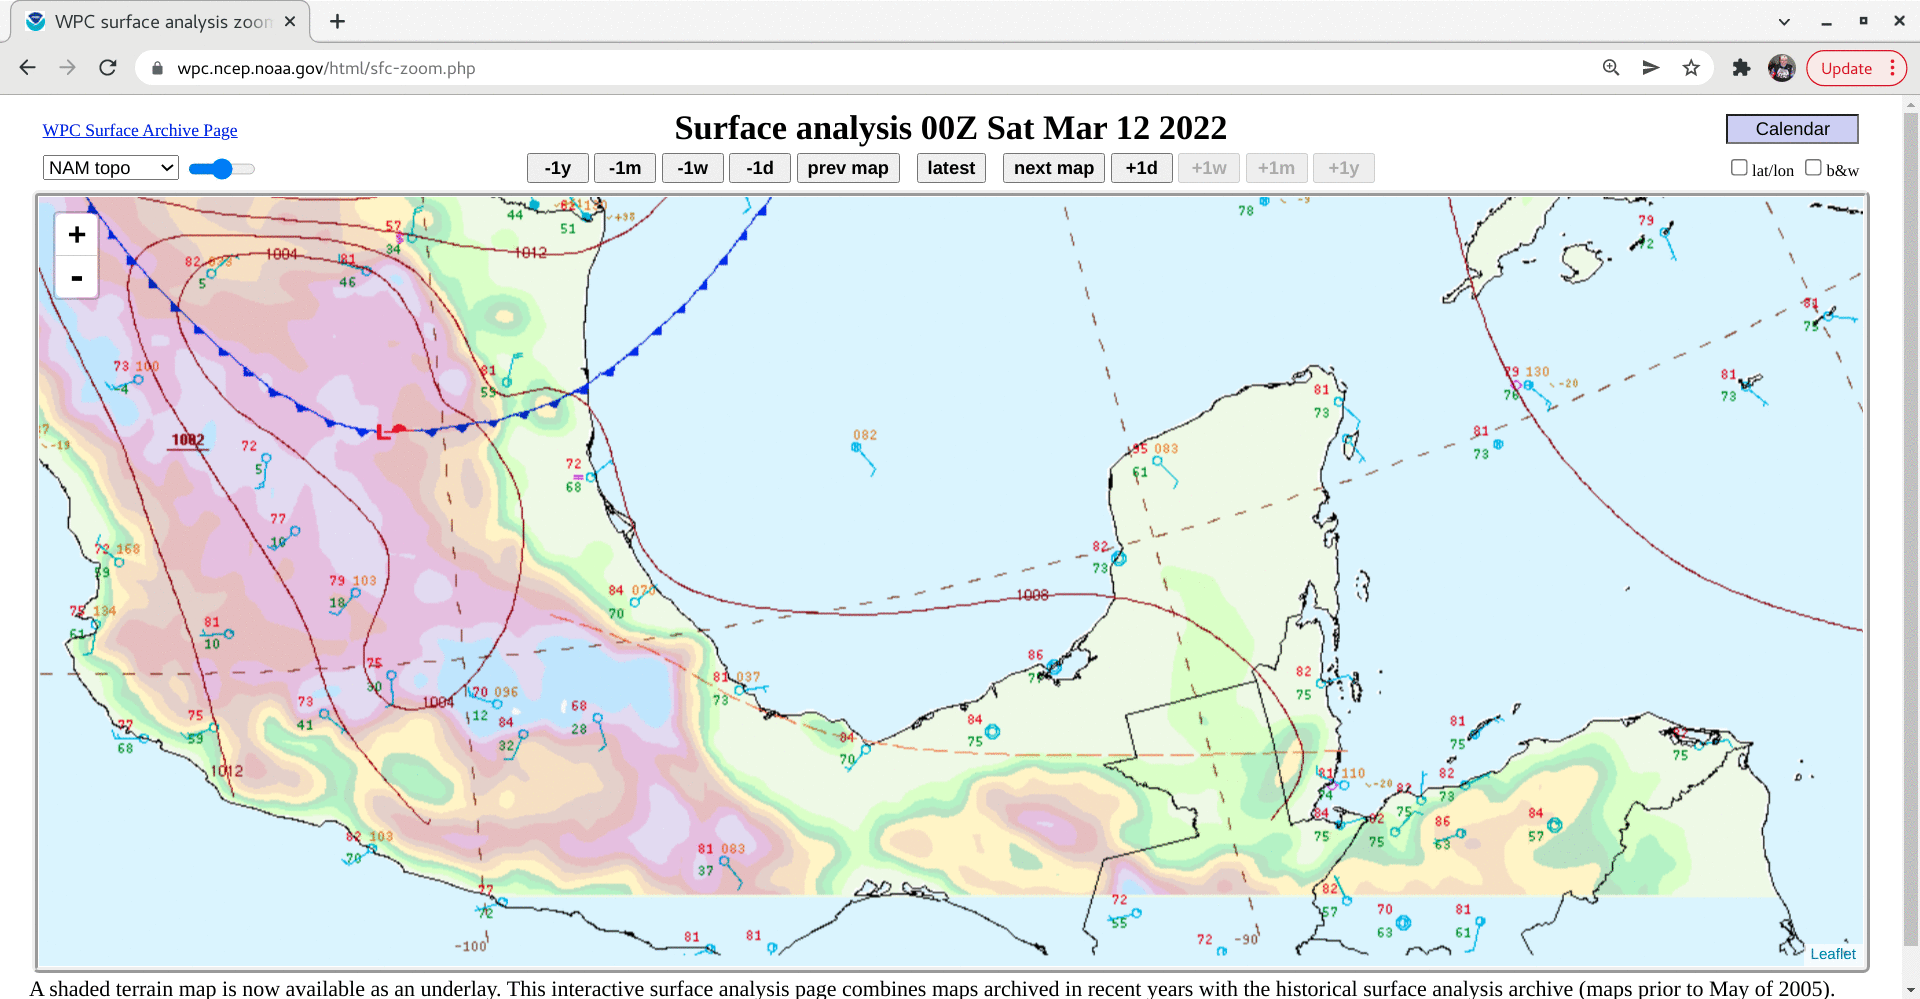
As a strong arctic cold front moved southward across the Gulf of Mexico and southern Mexico (surface analyses) on 12 March 2022, the cold air passed through the Chivela Pass and emerged as a Tehuano (or “Tehuantepecer“) gap wind that fanned outward across the Gulf of Tehuantepec. Visible images from GOES-17... Read More
Visible images from GOES-17 (left) and GOES-16 (right) [click to play animated GIF | MP4]
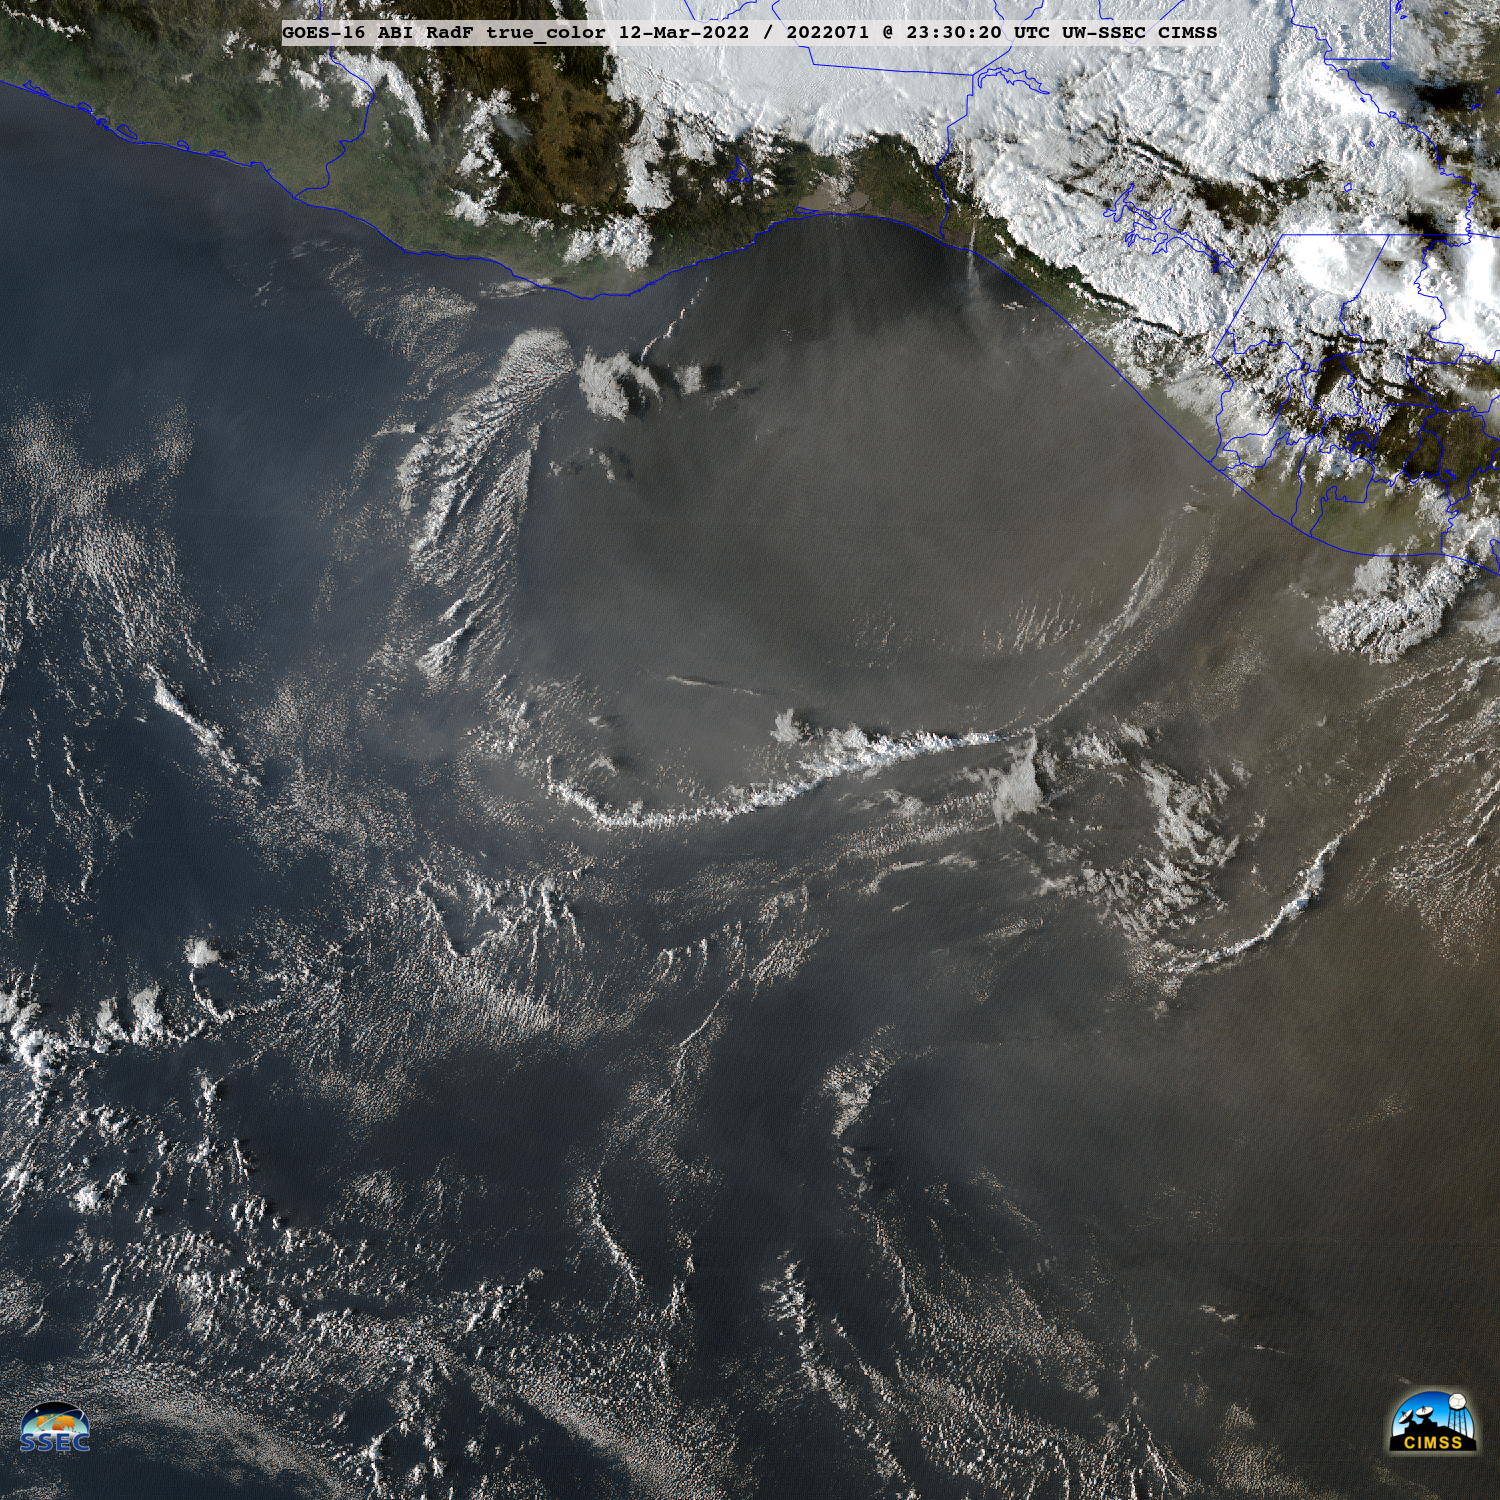
As a strong arctic cold front moved southward across the Gulf of Mexico and southern Mexico (surface analyses) on 12 March 2022, the cold air passed through the Chivela Pass and emerged as a Tehuano (or “Tehuantepecer“) gap wind that fanned outward across the Gulf of Tehuantepec. Visible images from GOES-17 (GOES-West) and GOES-16 (GOES-East) showed the narrow arc cloud that marked the leading edge of this gap flow (above).
GOES-16 True Color RGB images [click to play animated GIF | MP4]
True Color RGB images created using Geo2Grid from GOES-16 (above) and GOES-17 (below)showed the hazy signature of blowing dust/sand as it was transported off the south coast of Mexico and spread out across the Gulf of Tehuantepec.
GOES-17 True Color RGB images [click to play animated GIF | MP4]
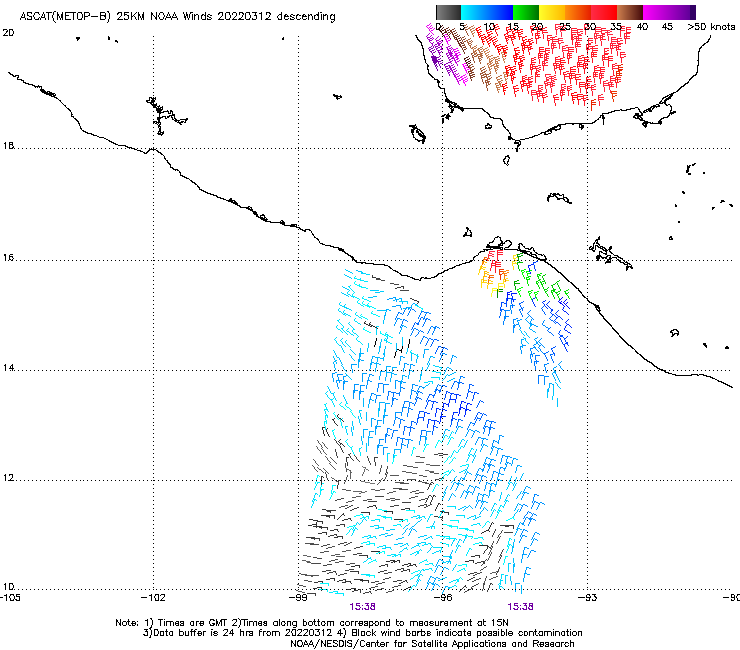
ASCAT surface scatterometer winds from Metop-B and Metop-C (source) are shown below; gap winds emerging from the coast were in the 35-40 knot range at 1631 UTC.
ASCAT winds from Metop-B and Metop-C [click to enlarge]
GOES-16 (GOES-East) True Color RGB images created using Geo2Grid (above) showed (1) Kármán vortex streets extending downwind (to the north) of Isla Alejandro Selkirk and Robinson Crusoe — part of the Juan Fernández Islands off the coast of Chile, and (2) an actinoform cloud feature farther to the west (which was also moving northward) on... Read More
GOES-16 True Color RGB images [click to play animated GIF | MP4]
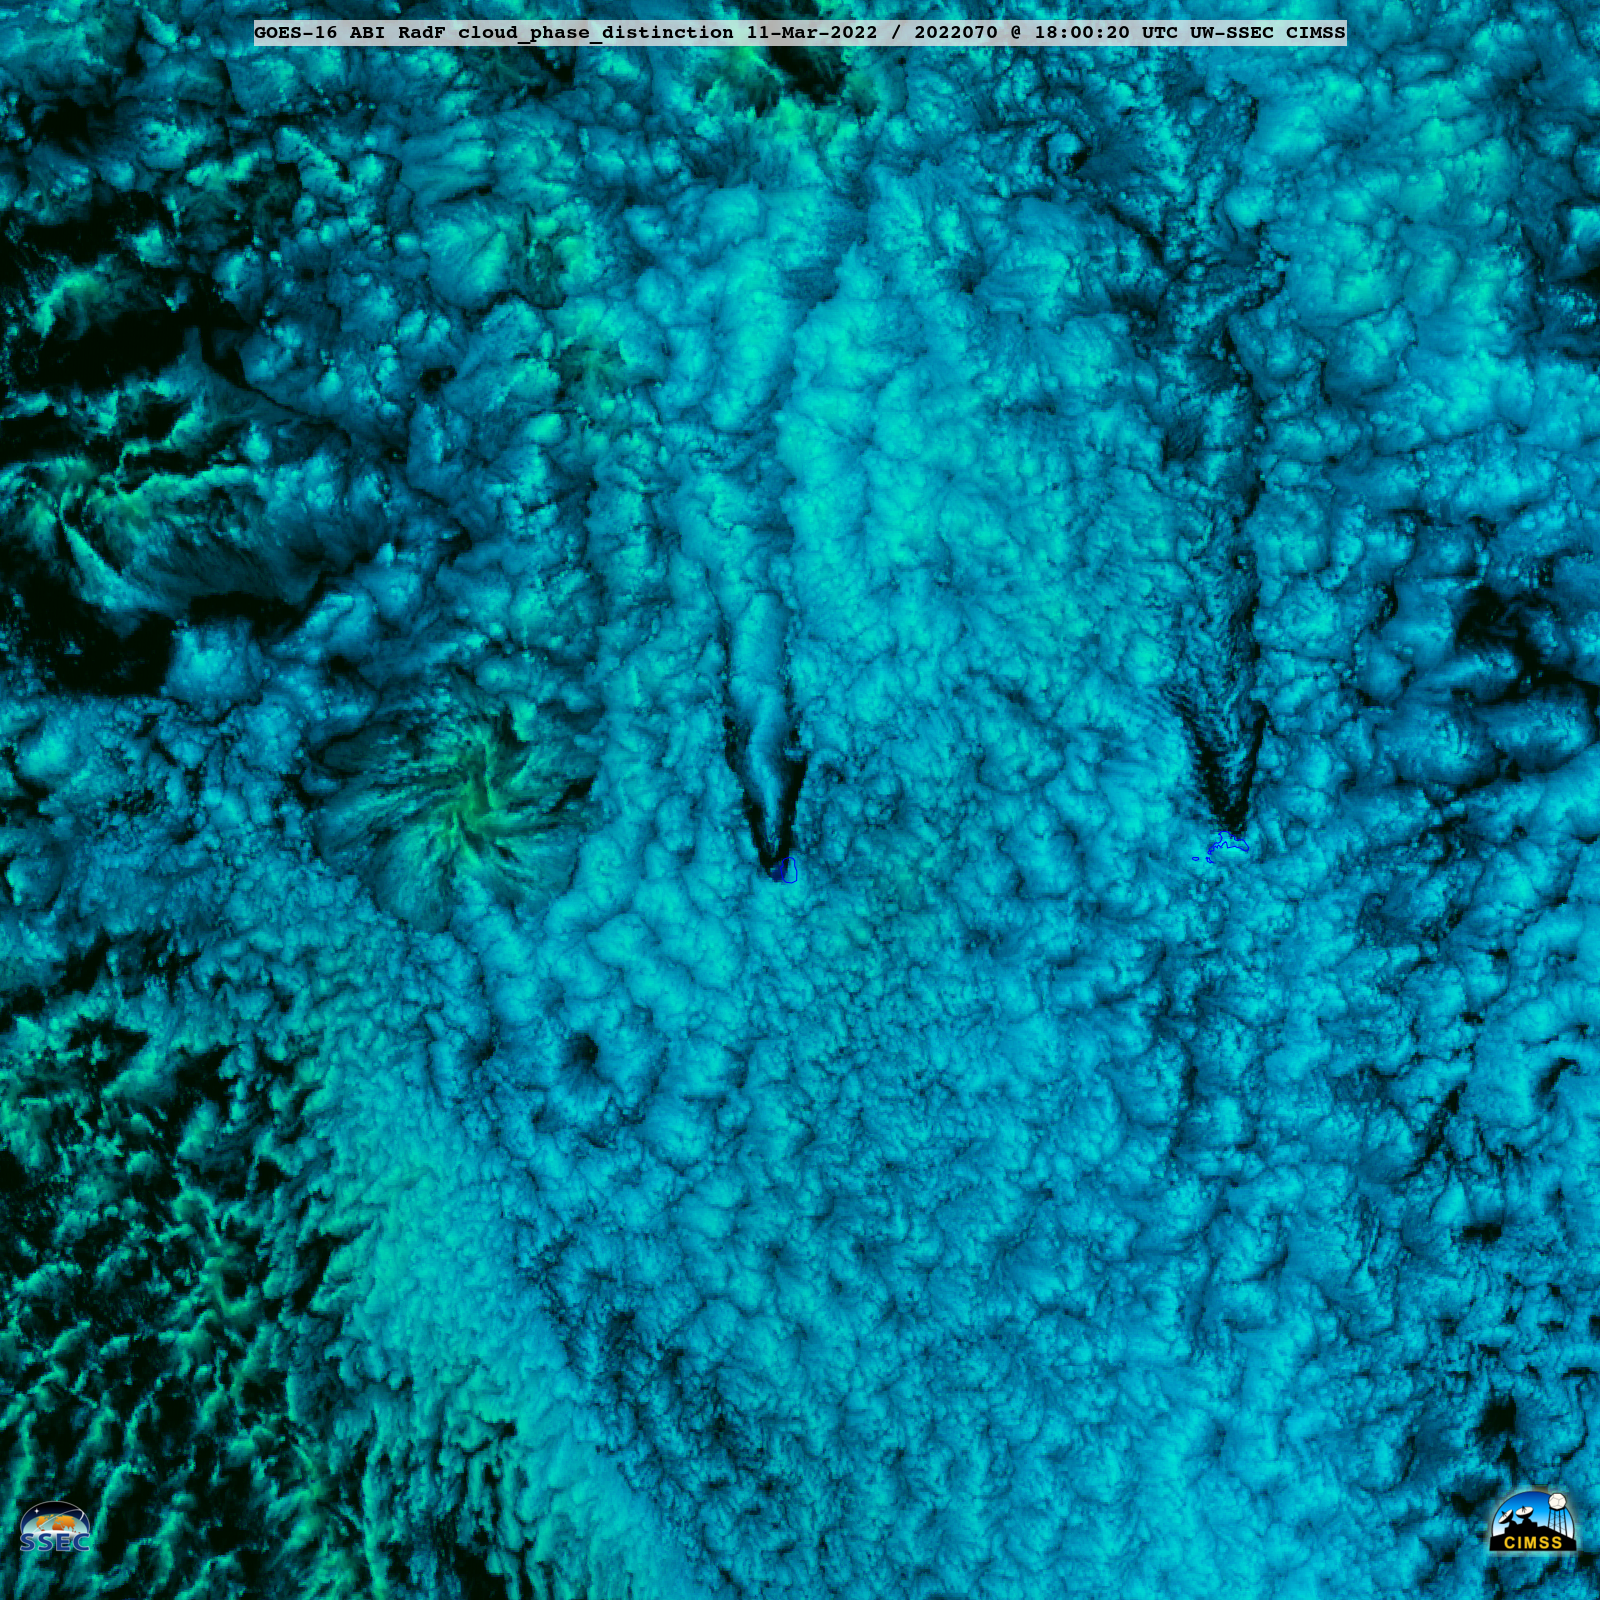
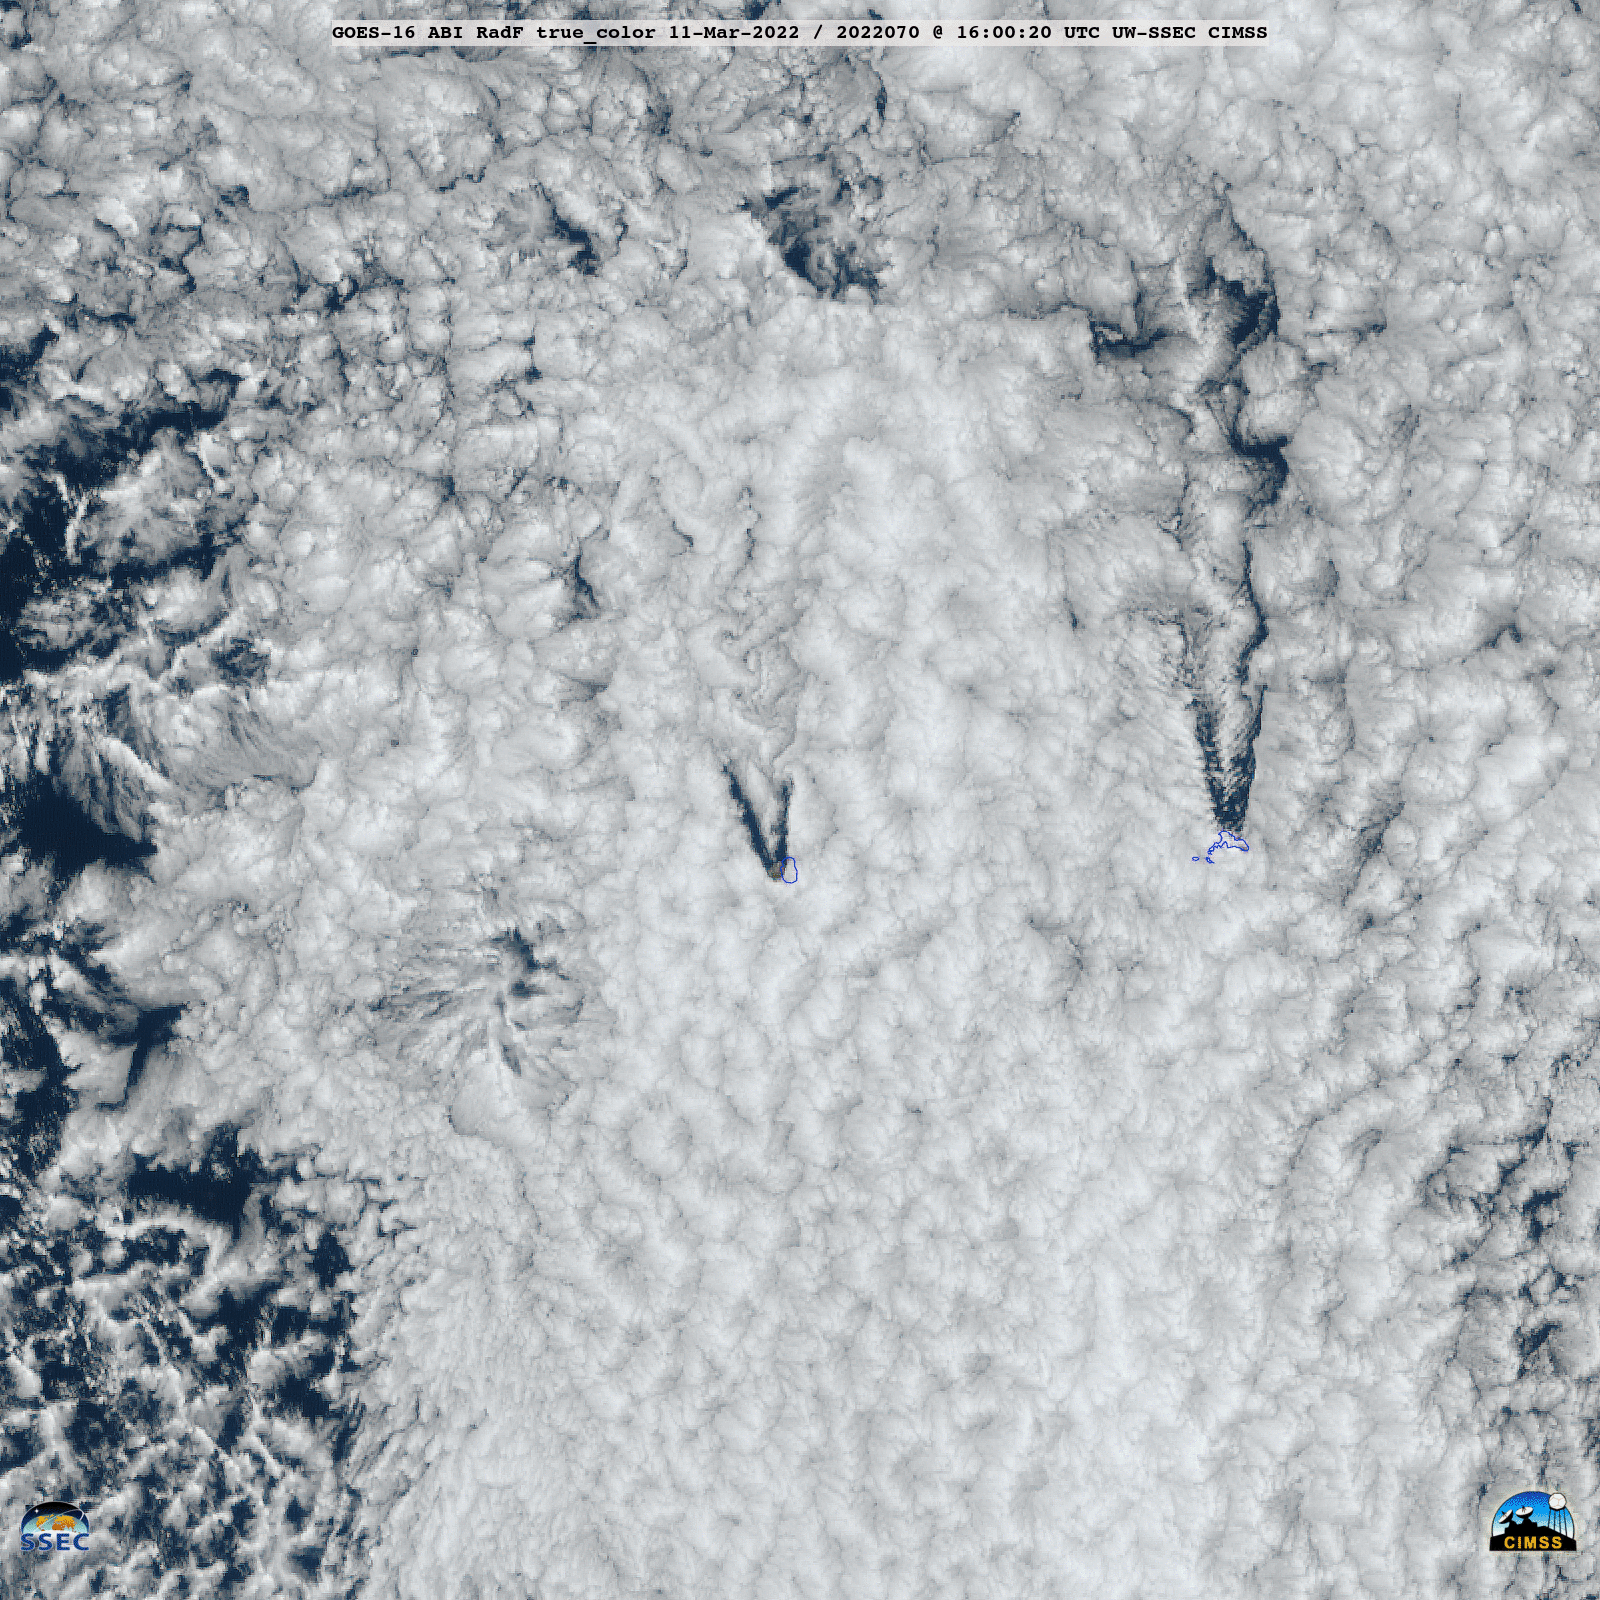
GOES-16 (GOES-East) True Color RGB images created using Geo2Grid(above) showed (1) Kármán vortex streets extending downwind (to the north) of Isla Alejandro Selkirk and Robinson Crusoe — part of the Juan Fernández Islands off the coast of Chile, and (2) an actinoform cloud feature farther to the west (which was also moving northward) on 11 March 2022.
In the corresponding Day Cloud Phase Distinction RGB images (below), the light shades of green exhibited by the narrow cloud bands within the actinoform feature suggested that they were beginning to glaciate — similar to what was observed in this example.
GOES-16 Day Cloud Phase Distinction RGB images [click to play animated GIF | MP4]
A toggle between GOES-16 True Color RGB and Day Cloud Phase Distinction RGB images at 1600 UTC is show below.
GOES-16 True Color RGB and Day Cloud Phase Distinction RGB images at 1600 UTC [click to enlarge]
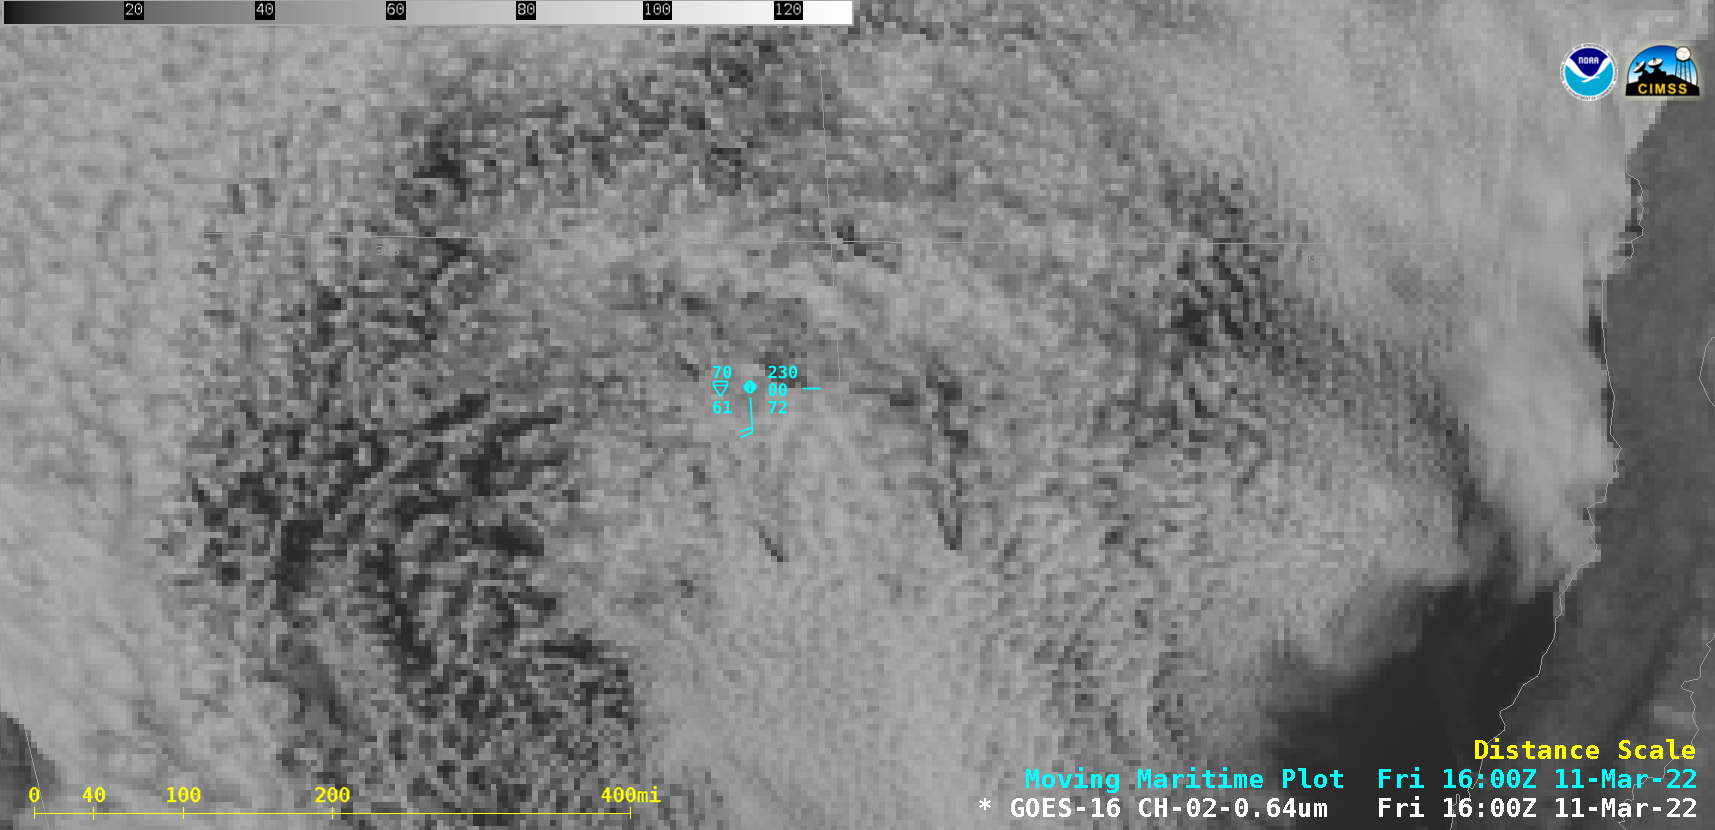
It is interesting to note that as a ship was passing through the northern portion of the Kármán vortex street about 100 miles north of Isla Alejandro Selkirk at 16 UTC, it reported moderate showers (below) — which would not be expected from a typical field of marine stratocumulus clouds.
GOES-16 “Red” Visible (0.64 µm) images, with ship reports plotted in cyan [click to play animated GIF | MP4]
Kudos to the NWS Spaceflight Meteorology Group and UW-CIMSS for bringing these phenomena to our attention:
#ISS Flight Director on shift today noticed interesting clouds from ISS video downlink. Von Karman vortices from Robinson Crusoe and Alexander Selkirk Islands in the South Pacific. Closer pass later today! pic.twitter.com/ht2vM93V4f
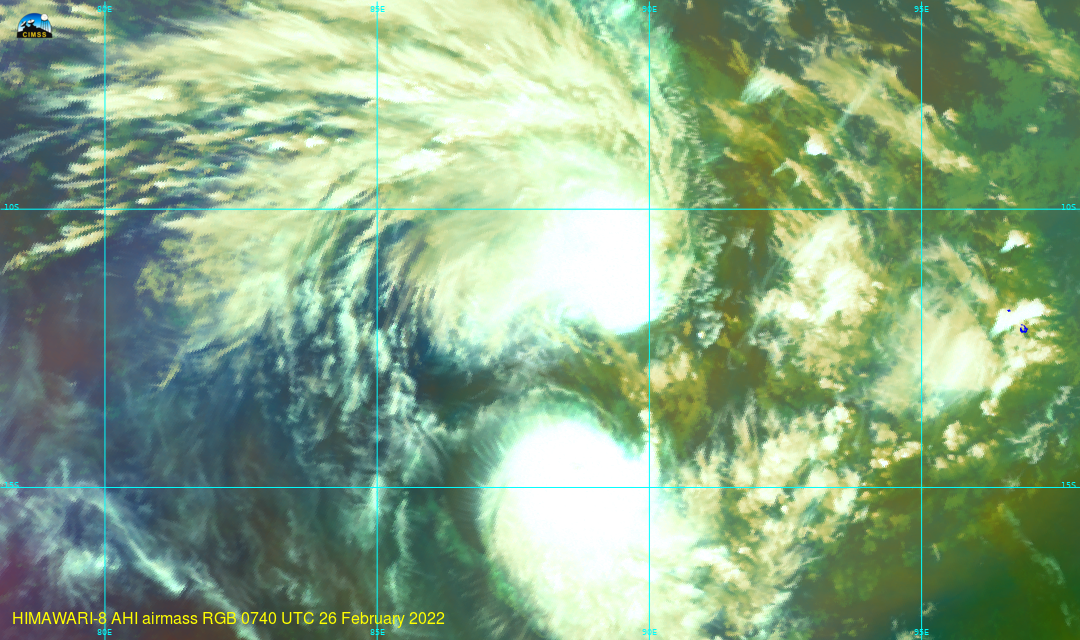
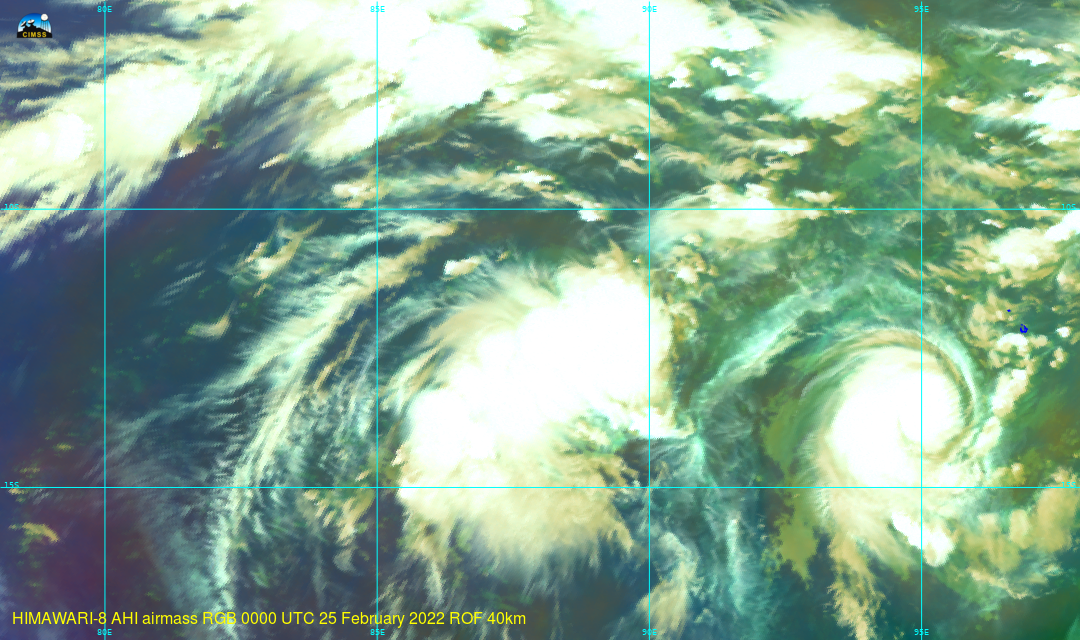
CIMSS scientists have been working on an update (and improvement) on Geo2Grid software (v 1.1) that can be expected within a couple months. (Beta-testing is ongoing at CIMSS) The animation above shows the Airmass RGB from Himawari-8 (data courtesy JMA) and the Fujiwhara interaction (also discussed on the CIMSS blog here)... Read More
Himawari-8 airmass RGB, 0000 UTC 24 February – 0000 UTC 28 February 2022
CIMSS scientists have been working on an update (and improvement) on Geo2Grid software (v 1.1) that can be expected within a couple months. (Beta-testing is ongoing at CIMSS) The animation above shows the Airmass RGB from Himawari-8 (data courtesy JMA) and the Fujiwhara interaction (also discussed on the CIMSS blog here) between southern Indian Ocean tropical cyclone Vernon and invest area 93S. The animation stretches from 0000 UTC on 24 March to 0000 UTC on 28 March.
Because the animation includes data near the limb, the remapping was changed from the default. That is, the geo2grid invocation includes the following specification:
Remapping is done using a nearest-neighbor approach (the default in geo2grid when a non-native projection is used), and points within 40 km (40000 m) are considered. Note also that the full-disk AHI imagery is reprojected onto a grid named ‘Fujiwhara’; the components required by geo2grid are within the file Fujiwhara.yaml (as created by a call to the p2g_grid_helper.sh script):
What was the series of unix-based commands that produced the imagery above? Those are outlined below in a shell script. This uses the beta version of geo2grid v1.1; similar commands will work in v1.0. Before this shell script can be invoked, the compressed package must be expanded, creating a directory with many sub-directories, such as /bin, /share, /colormaps, /etc, and so on. This directory is the GEOGRID_HOME directory, and you can specify it, as shown below.
cd /directory/where/geo2gridpkg/sits/
export GEO2GRID_HOME=$PWD
cd bin
#
# The command below will create a grid (named 'Fujiwhara')
#   centered at 88 E, 12 S (geo2grid assumes east/north positive)
# The grid has 2 km resolution in the x- and y- directions, and
#   its size is 1080x640 (so it's wider than it is high)
# Place the multi-line output from p2g_grid_helper.sh in the file
#   named $GEO2GRID_HOME/Fujiwhara.yaml
../p2g_grid_helper.sh Fujiwhara 88.0 -12.0 2000 2000 1080 640   > $GEO2GRID_HOME/Fujiwhara.yaml
#
# Now, call geo2grid, reading (the -r flag) AHI HSD format files
#   Write out (the -w flag) geotiff files of (the -p flag) the product
#   airmass RGB.  Regrid (the -g flag) the data to the 'Fujiwhara'
#   grid defined above, and tell geo2grid where the grid definitions sit
#   (the --grid-configs filename flag).  Regridding uses nearest-
#   neighbor (--method nearest) and it looks within 40000 m of each grid
#   point (--radius-of-influence 40000)  (Note that geo2grid v1.0 did
#   not include --radius-of-influence!)
##
##
../geo2grid.sh -r ahi_hsd -w geotiff -p airmass  -g Fujiwhara --grid-configs $GEO2GRID_HOME/Fujiwhara.yaml --method nearest --radius-of-influence 40000 -f /directory/holding/Himawari-8/HSDFILES/for/ONE/time/only/*FLDK*.DAT
#  The command above will create a geotiff file with a name like this:
#  HIMAWARI-8_AHI_airmass_20220223_0000??_Fujiwhara.tif
#  The command below adds coastlines (in blue) and lat/lon line
#  (--add-grid) colored in the default (cyan).  The output is a
#  .png
../add_coastlines.sh --add-coastlines --coastlines-resolution h --coastlines-level=5 --coastlines-outline='blue' --add-grid --grid-text-size 8 --grid-D 5.0 5.0 --grid-d 5.0 5.0    HIMAWARI-8_AHI_airmass_20220223_0000??_Fujiwhara.tif
#  I use ImageMagick commands to annotate the imagery, as shown below
convert HIMAWARI-8_AHI_airmass_20220223_0000??_Fujiwhara.png   -gravity Southwest -fill yellow -pointsize 16 -annotate +12+16 "HIMAWARI-8 AHI airmass RGB 0000 UTC 23 February 2022"  HIMAWARI-8_AHI_airmass_20220223_0000_Fujiwhara.png
#  Gotta add a logo too!
convert HIMAWARI-8_AHI_airmass_20220223_0000_Fujiwhara.png ~scottl/smalllogo.png   -gravity northwest -geometry +12+8 -composite HIMAWARI-8_AHI_airmass_20220223_0000_FujiwharaL.png
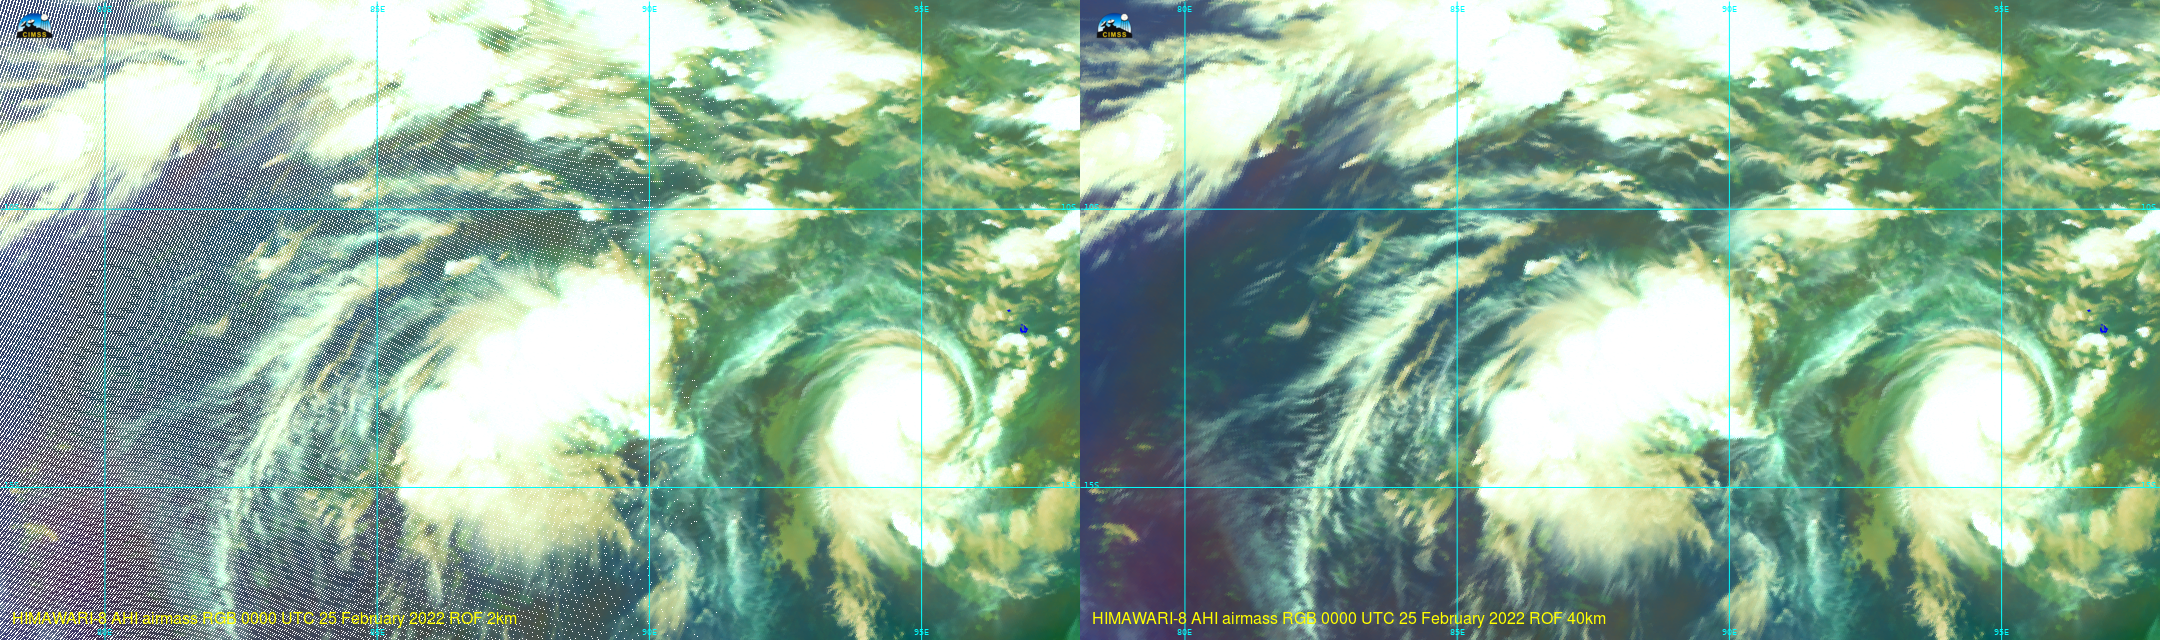
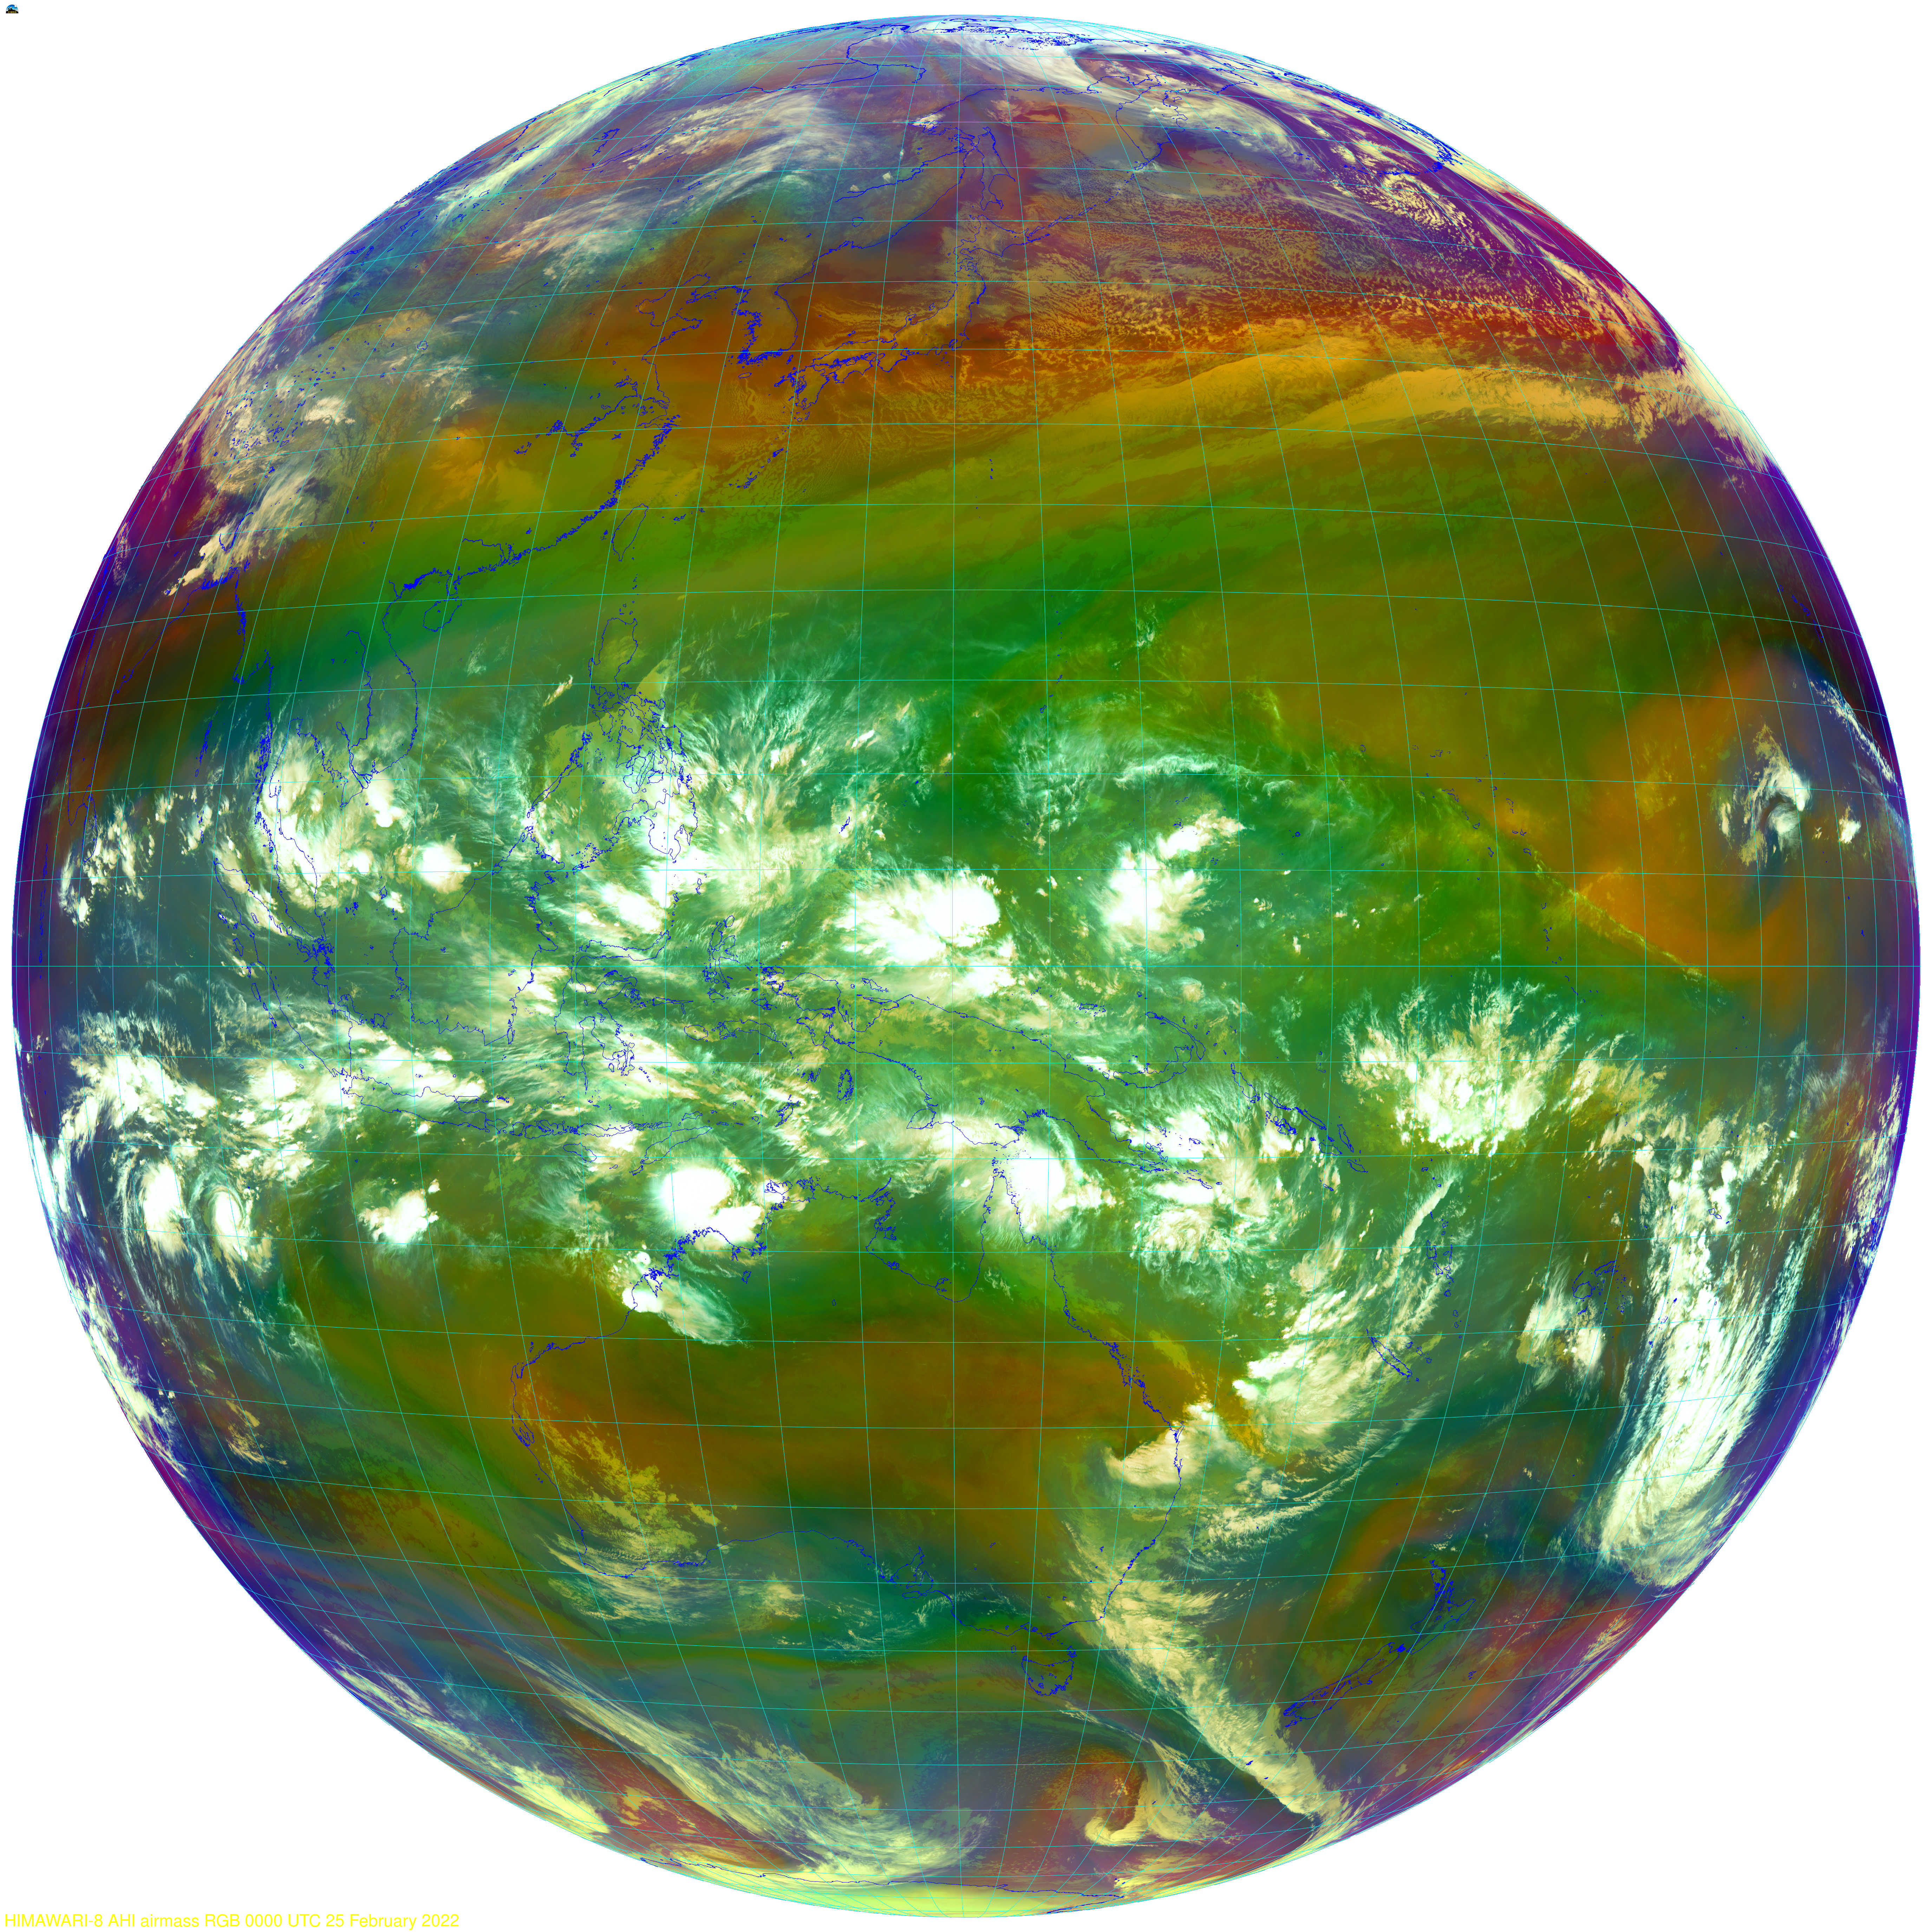
How does a change in –radius-of-influence affect the created image? If you’re near the limb, and the radius of influence is too small, data gaps can appear. The image below compares an image with radius of influence of 2km (the native resolution at the sub-satellite point for infrared imagery) with an image with a radius of influence of 40 km.
A Full-disk image at this time is here so you can judge how close to the edge this event it.
Himawari-8 airmass RGB at 0000 UTC on 25 February 2022 created with regridding using a radius of influence of 2 km (left) vs. 40 km (right) (Click to enlarge)
A non-satellite of the Fujiwhara interaction is shown below.
Two tropical systems merging via the Fujiwhara effect in the Indian Ocean.
Tropical Cyclone Vernon & Invest 93S, shown in terms of hourly 700 hPa relative vorticity in ERA5 data.
Animation made with ParaView, vorticity shown as both color shading and elevation of the surface. pic.twitter.com/REHyioXXzB
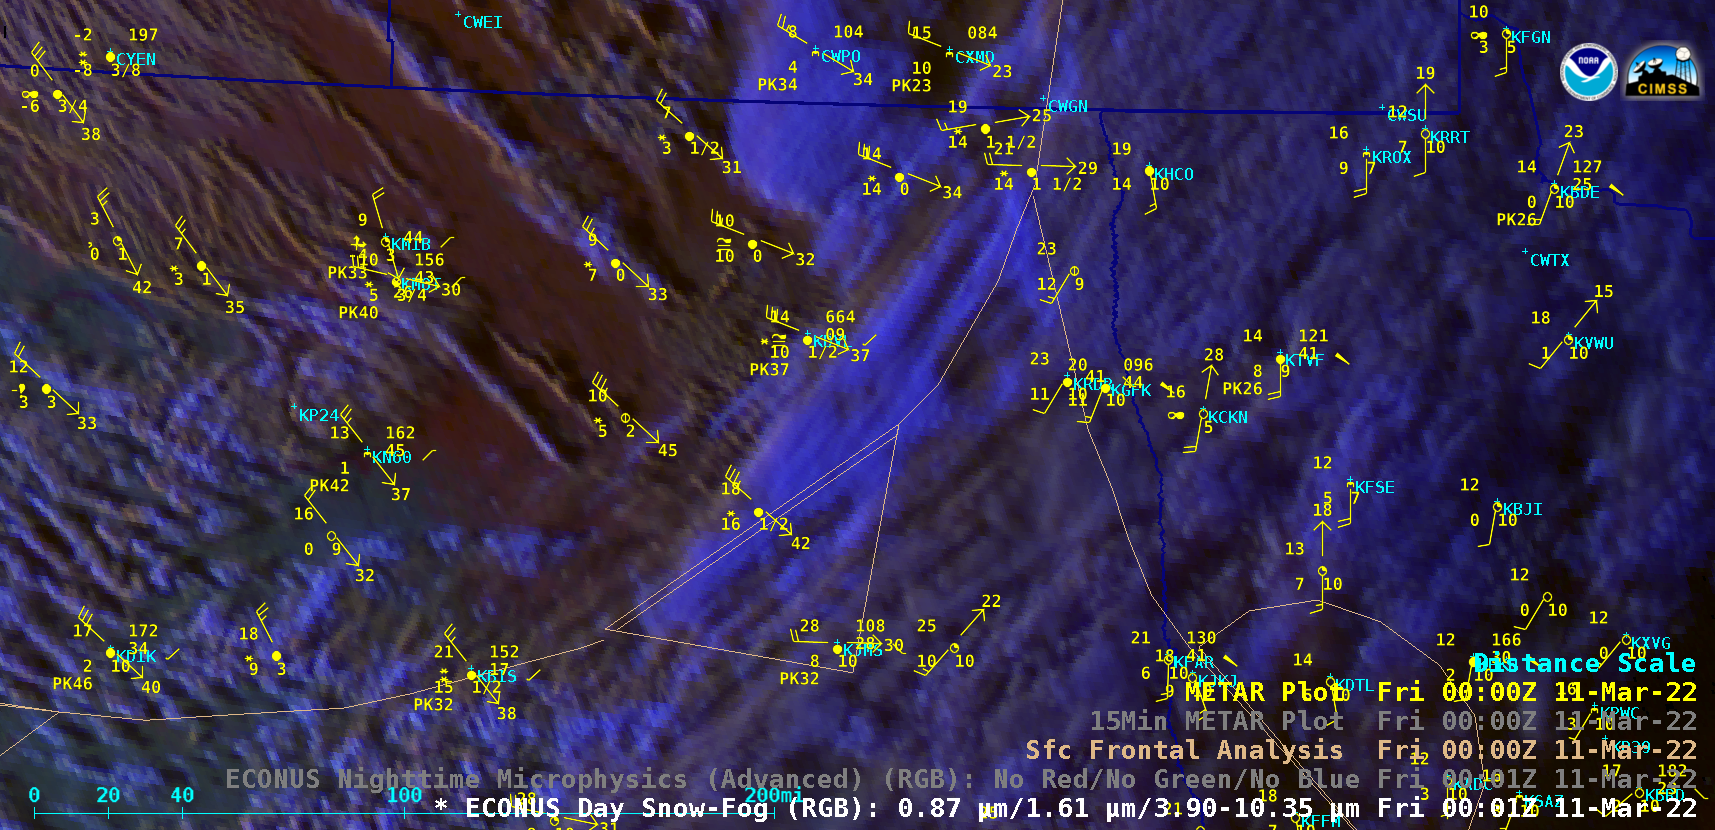
GOES-16 (GOES-East) Day Snow-Fog RGB and Nighttime Microphysics RGB images (above) showed a narrow band of clouds along the leading edge of an arctic cold front that was moving southeastward across North Dakota and Minnesota late in the day on 10 March 2022. Strong winds combined with snowfall from this narrow band produced snow squall... Read More
GOES-16 Day Snow-Fog RGB and Nighttime Microphysics RGB images [click to play animated GIF | MP4]
GOES-16 (GOES-East)Day Snow-Fog RGB and Nighttime Microphysics RGB images (above) showed a narrow band of clouds along the leading edge of an arctic cold front that was moving southeastward across North Dakota and Minnesota late in the day on 10 March 2022. Strong winds combined with snowfall from this narrow band produced snow squall conditions at many locations, with visibility reduced to near zero at times. The Day Snow-Fog RGB images also helped to highlight narrow bands of blowing snow behind the cold front across parts of northern North Dakota.
This event warranted the first Snow Squall Warning to be issued by the NWS Grand Forks forecast office.
A snow squall warning is in effect until 7:15 PM CST for I-29, US-2, US-81 near Grand Forks, ND–MN and US-2, US-75 near Crookston, MN. pic.twitter.com/Tbrhm963dq


