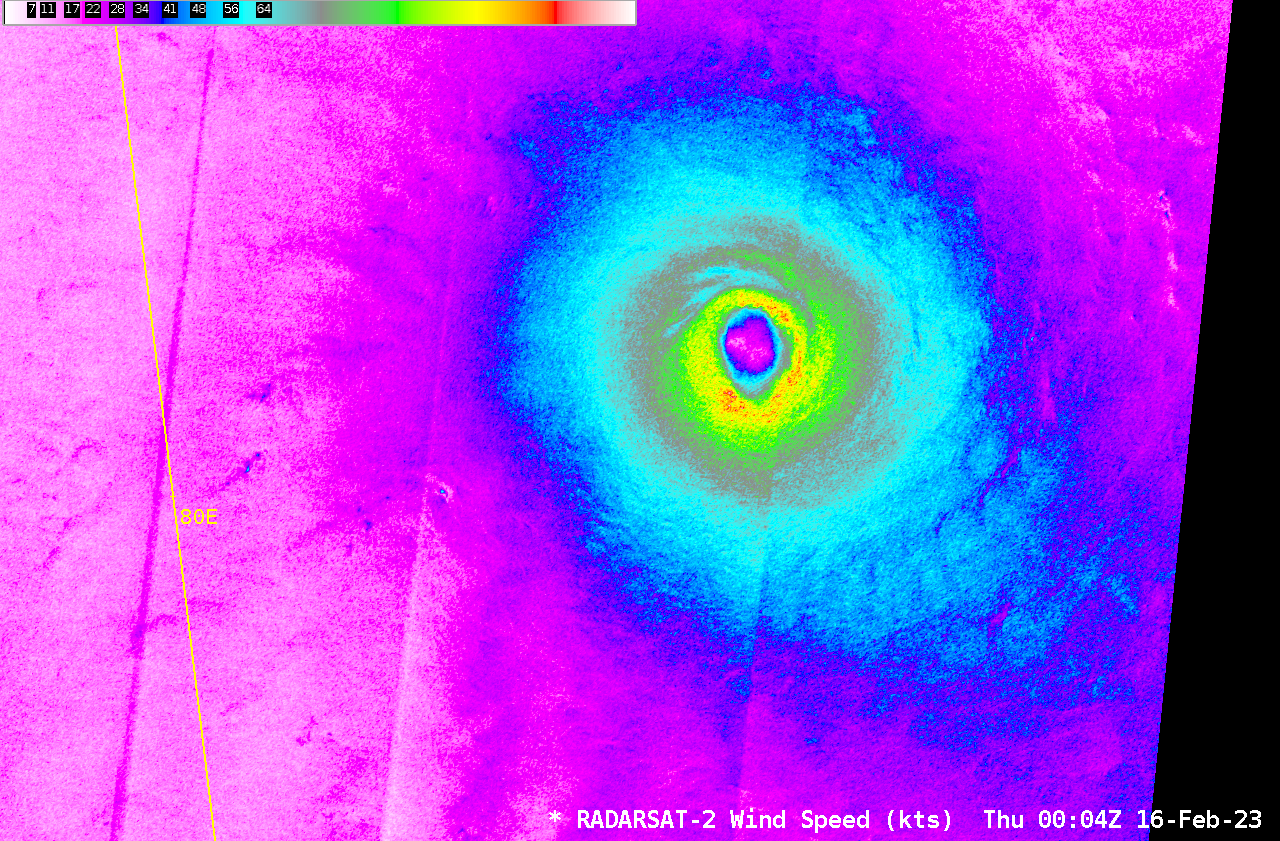
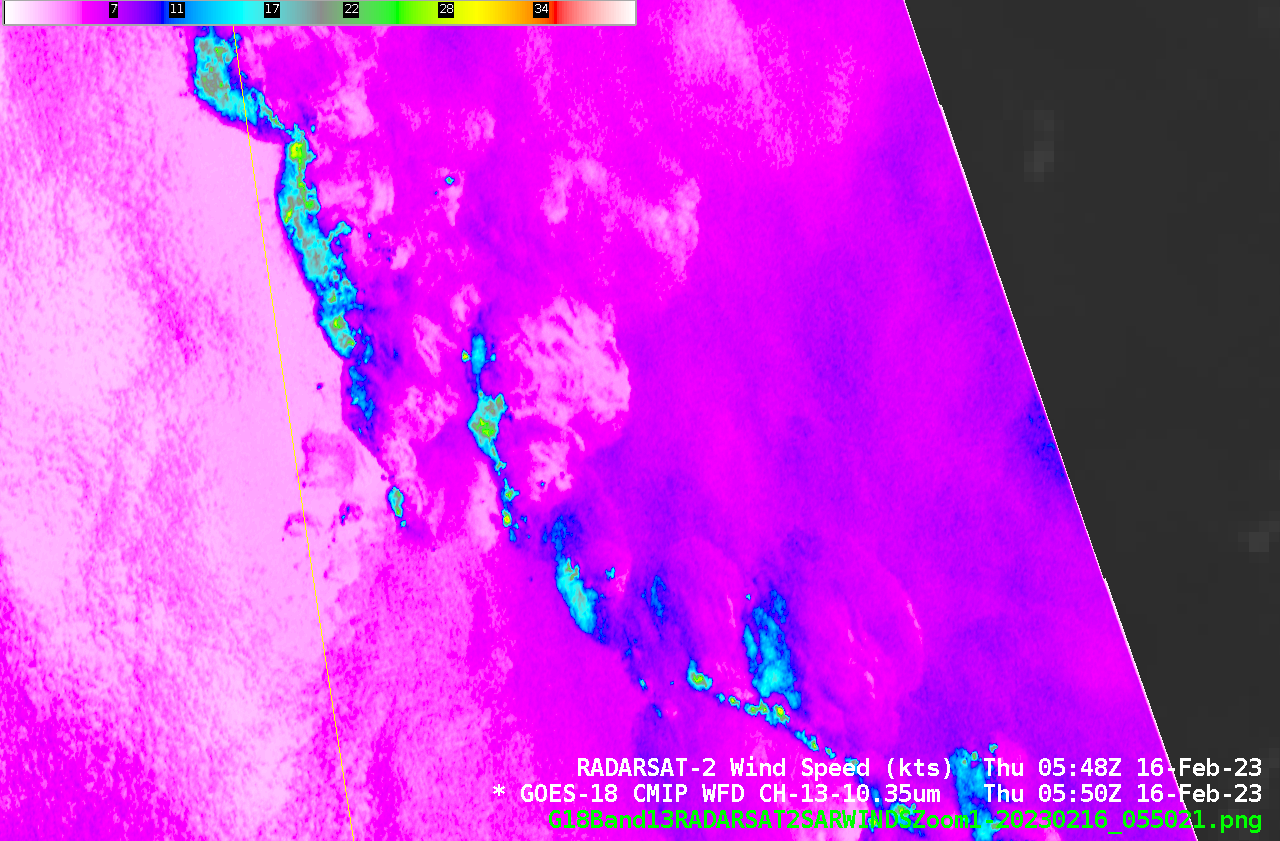
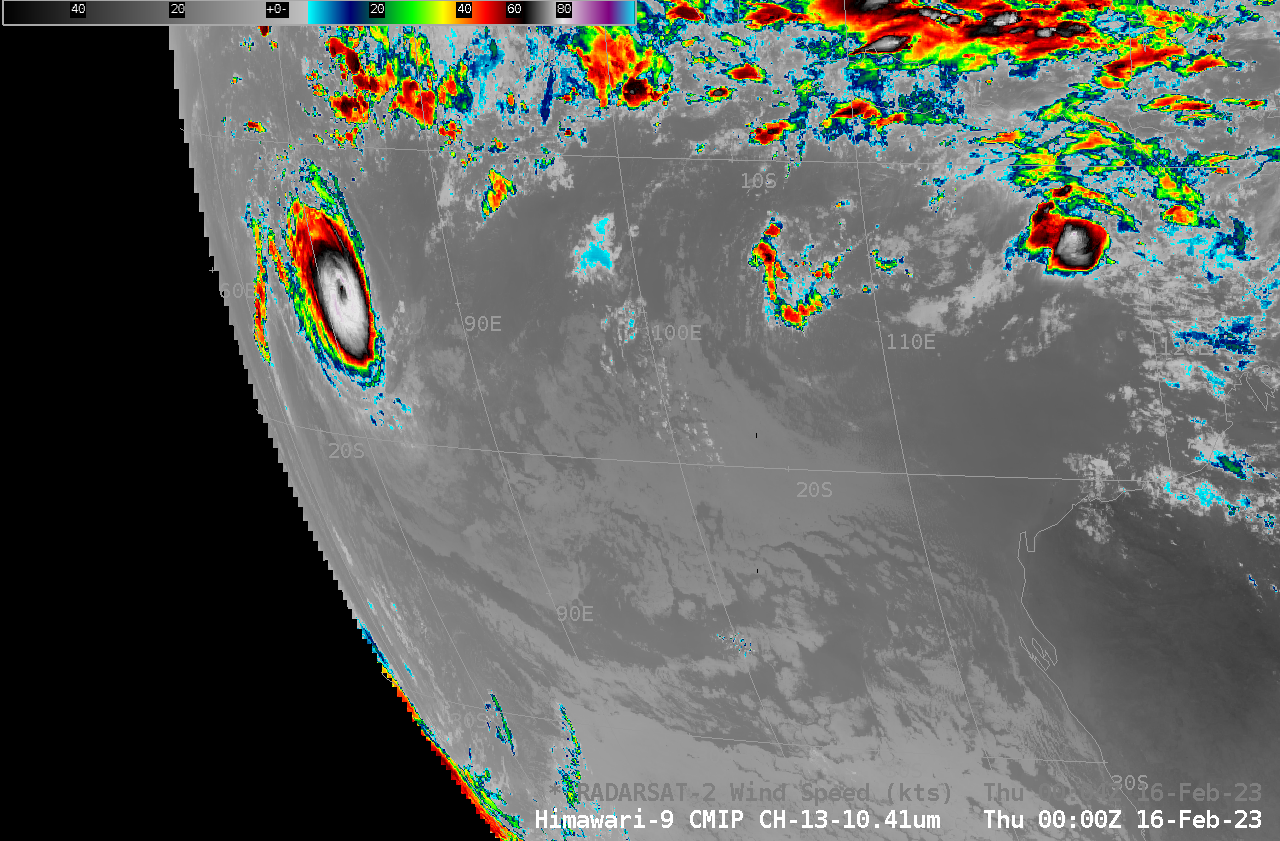
RADARSAT-2 and RCM-1 had two closely-spaced overpasses over Cyclone Freddy in the Indian Ocean early on 16 February 2023, as shown above. Eyewall speeds exceed 130 knots in the RCM-1 data! (Imagery and data are available here). The quadrant analyses for RCM-1 and for RADARSAT-2 show hurricane-force winds extending out about 40 nautical miles from the storm center. The toggle below shows 0000 UTC Himawari-9 clean window imagery overlain with the 0004 UTC RADARSAT-2 SAR Winds. Because Freddy now is almost at the limb of the Himawari-9 imagery (as shown here), there is a noticeable parallax shift in the Himawari-9 clouds — away from the sub-satellite point (for Himawari-9, that’s at 140.7o E longitude; Freddy was at 82.2o E Longitude!)
The toggle below compares 0000 UTC Clean Window imagery from Himawari-9 (AHI data) and from GEOKOMPSAT-2 (over the Equator at 128.2o E) (AMI data). The parallax shift in the AMI data is smaller than with AHI because Freddy is closer to GEOKOMPSAT-2’s subsatellite point. (Himawari HSD and Geokompsat-2 Level 1b files were processed with geo2grid software for these images). However, both satellites show an eye to the west of its SAR-derived location. Note also the degradation in Himawari-9 image acuity over the western part of the domain; brightness temperatures are also cooler over the western quarter of the domain, likely due to limb cooling (also discussed in this blog post): radiation from the edge of a Full-Disk scan (compared to radiation from the sub-satellite point) will pass through more of the colder upper troposphere (because of the much more slanted path towards the satellite) before reaching the satellite detectors, and a cooler temperature will be perceived.
Earlier SAR captures of Freddy’s eye with comparisons to Himawari-9 imagery are available here. Thanks to JMA and KMAs for the data!
The toggle below compares EWS-G1 infrared imagery (4-km resolution) with AHI data remapped to the EWS-G1 projection. Both satellites were sampling the eye near 0000 UTC on 16 February. EWS-G1 is over the equator near 66oE, so any eye displacement due to parallax will be to the east of the eye, i.e. in the opposite direction of the Himawari-9 parallax displacement.
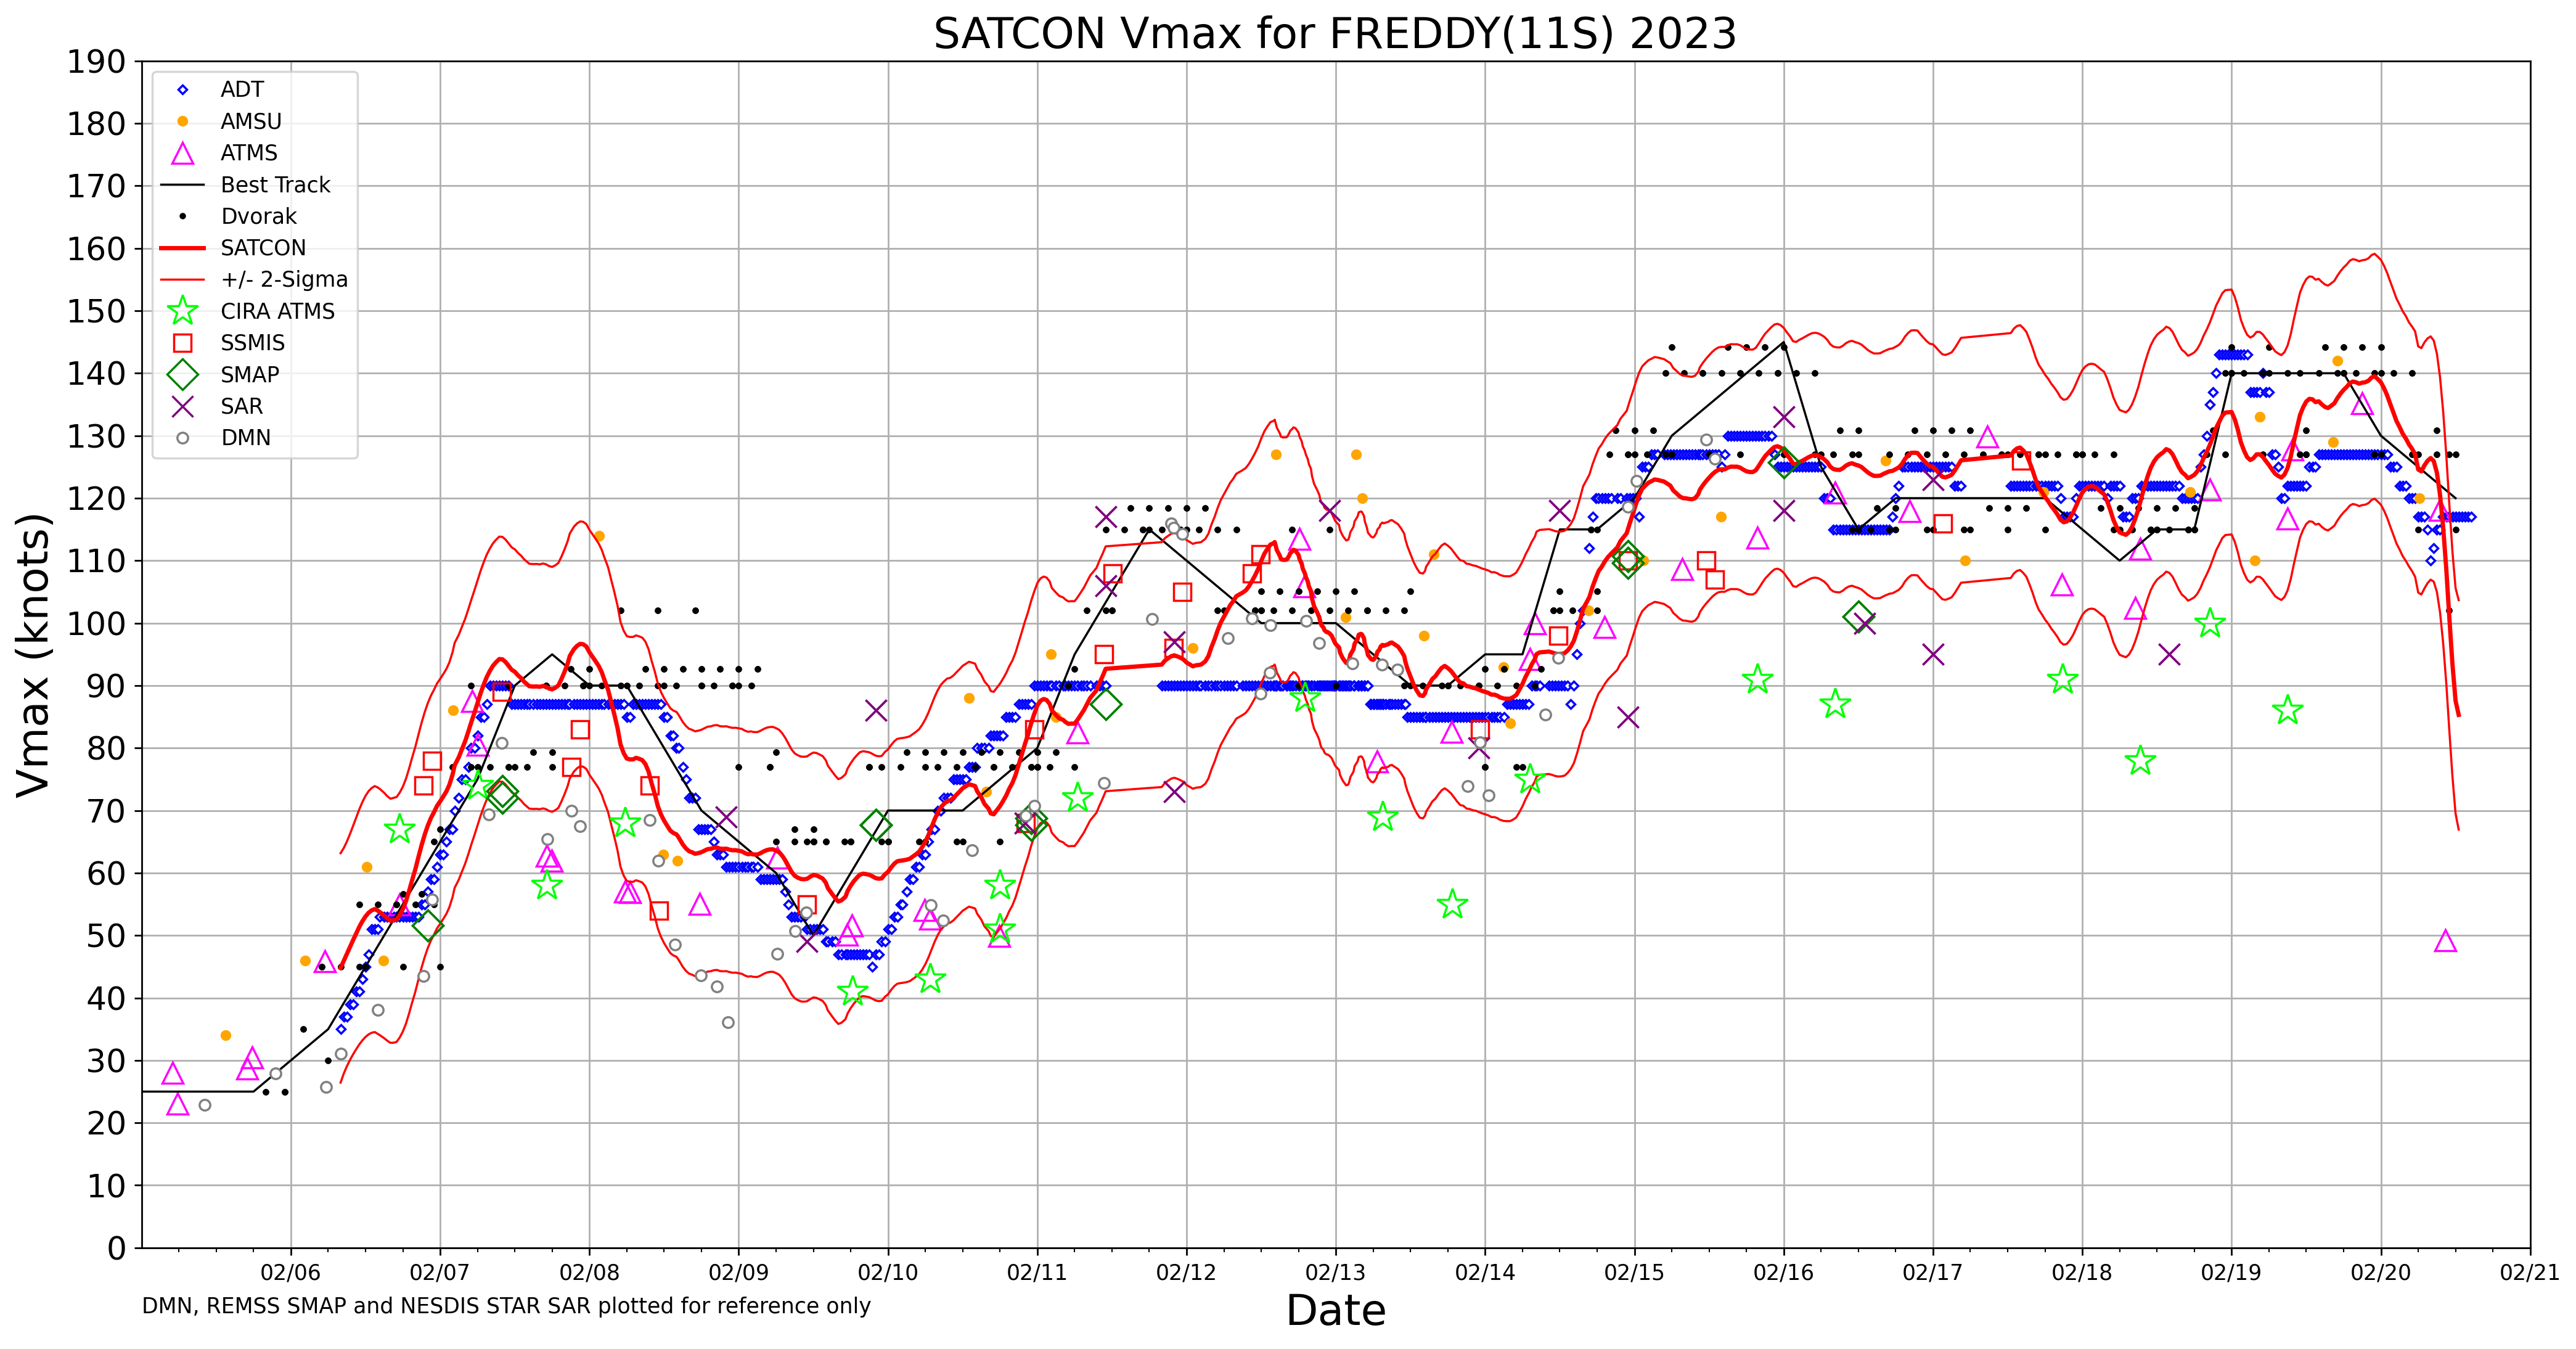
Cyclone Freddy was at its strongest at around 0000 UTC on 16 February, as noted here.
View only this post Read Less


