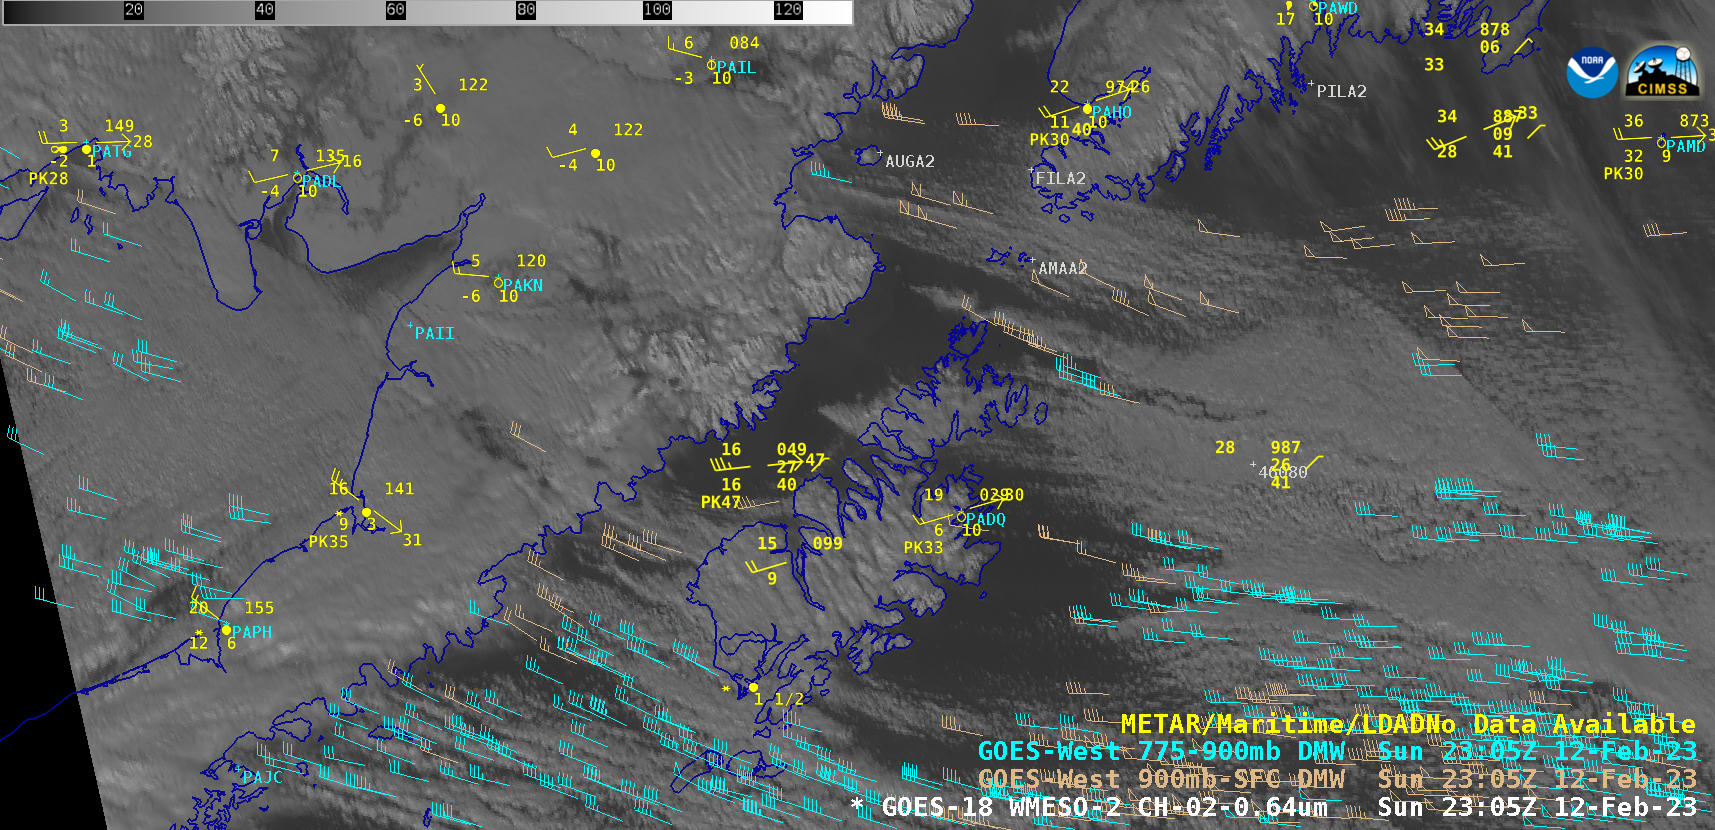
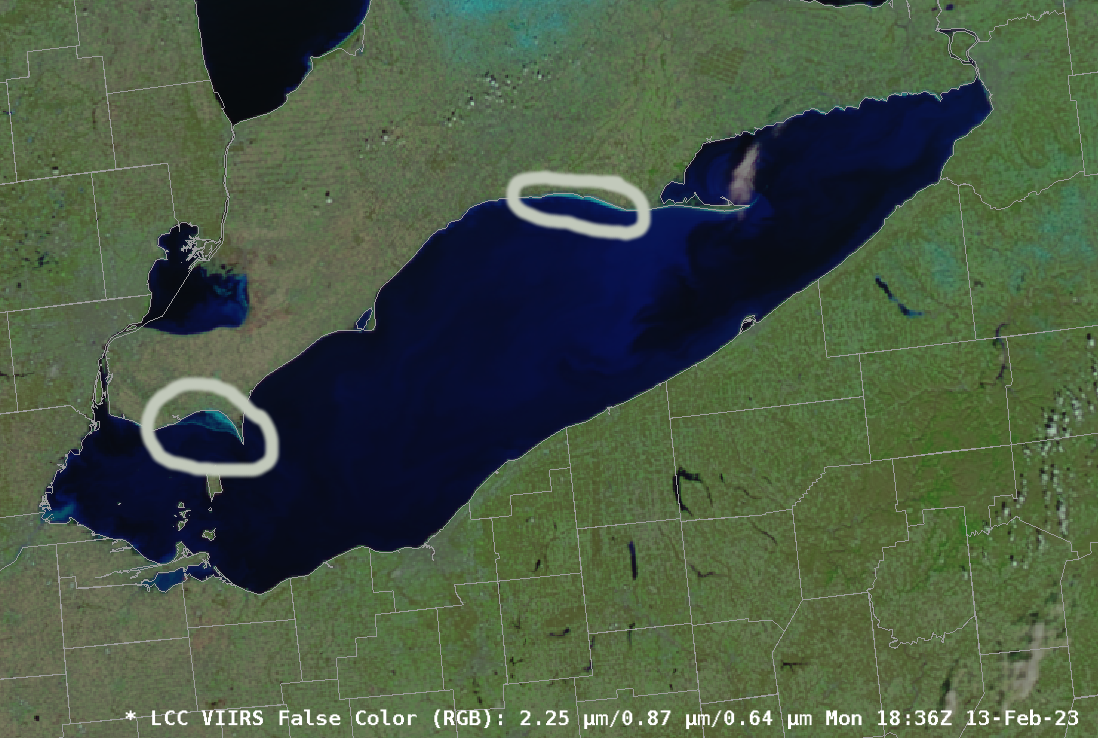
1-minute Mesoscale Domain Sector GOES-18 (GOES-West) “Red” Visible (0.64 µm) images (above) include plots of Derived Motion Winds (DMW) — and showed the rapid offshore transport of cold arctic air across the southern Cook Inlet, Shelikof Strait and northwestern Gulf of Alaska on 12 February 2023. The fastest low-level (Surface – 900 hPa) DMW speed was... Read More

GOES-18 “Red” Visible (0.64 µm) images, with and without plots of Derived Motion Winds [click to play animated GIF | MP4]
1-minute Mesoscale Domain Sector GOES-18
(GOES-West) “Red” Visible (0.64 µm) images
(above) include plots of
Derived Motion Winds (DMW) — and showed the rapid offshore transport of cold arctic air across the southern
Cook Inlet,
Shelikof Strait and northwestern
Gulf of Alaska on 12 February 2023. The fastest low-level (Surface – 900 hPa) DMW speed was 64 knots in the far southern portion of Cook Inlet at 2305 UTC
(below).
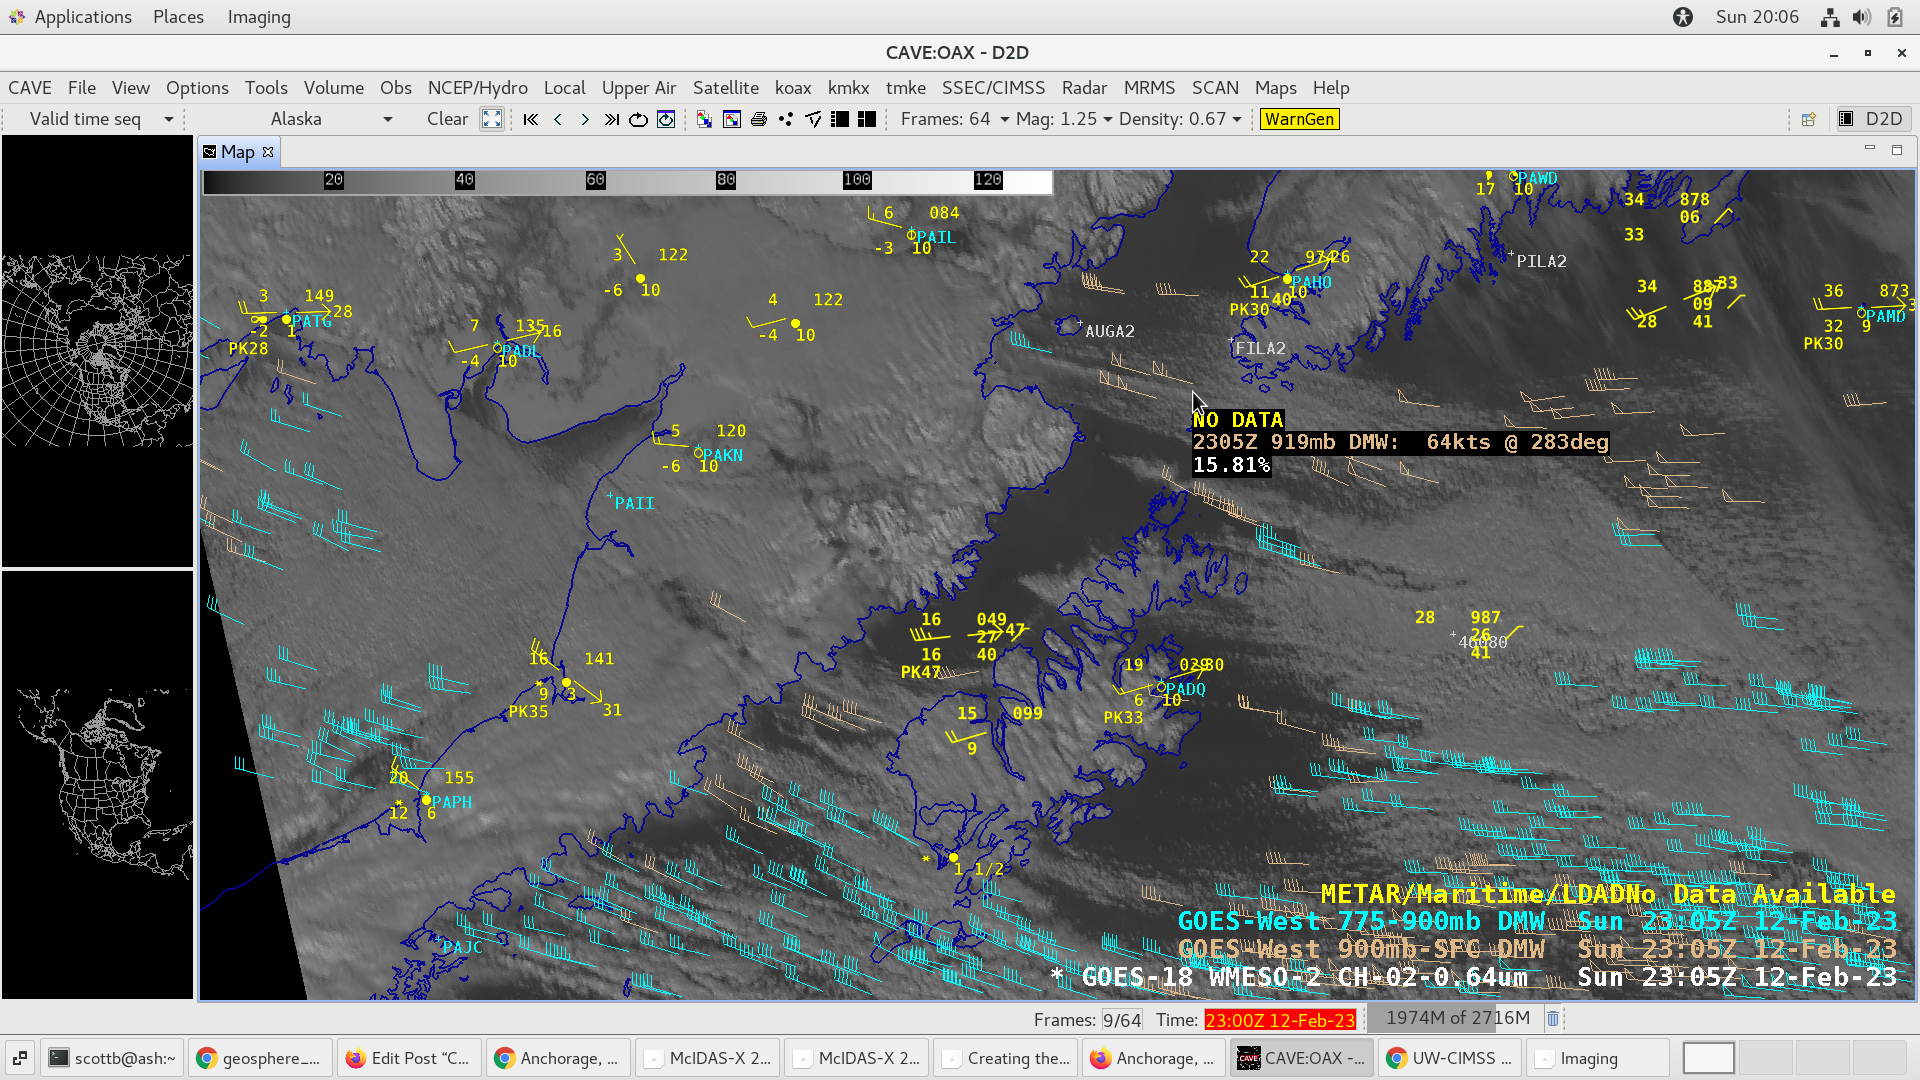
GOES-18 “Red” Visible (0.64 µm) image at 2305 UTC, with plots of Derived Motion Winds (DWM) and a cursor readout showing a 64-knot DMW wind speed [click to enlarge]
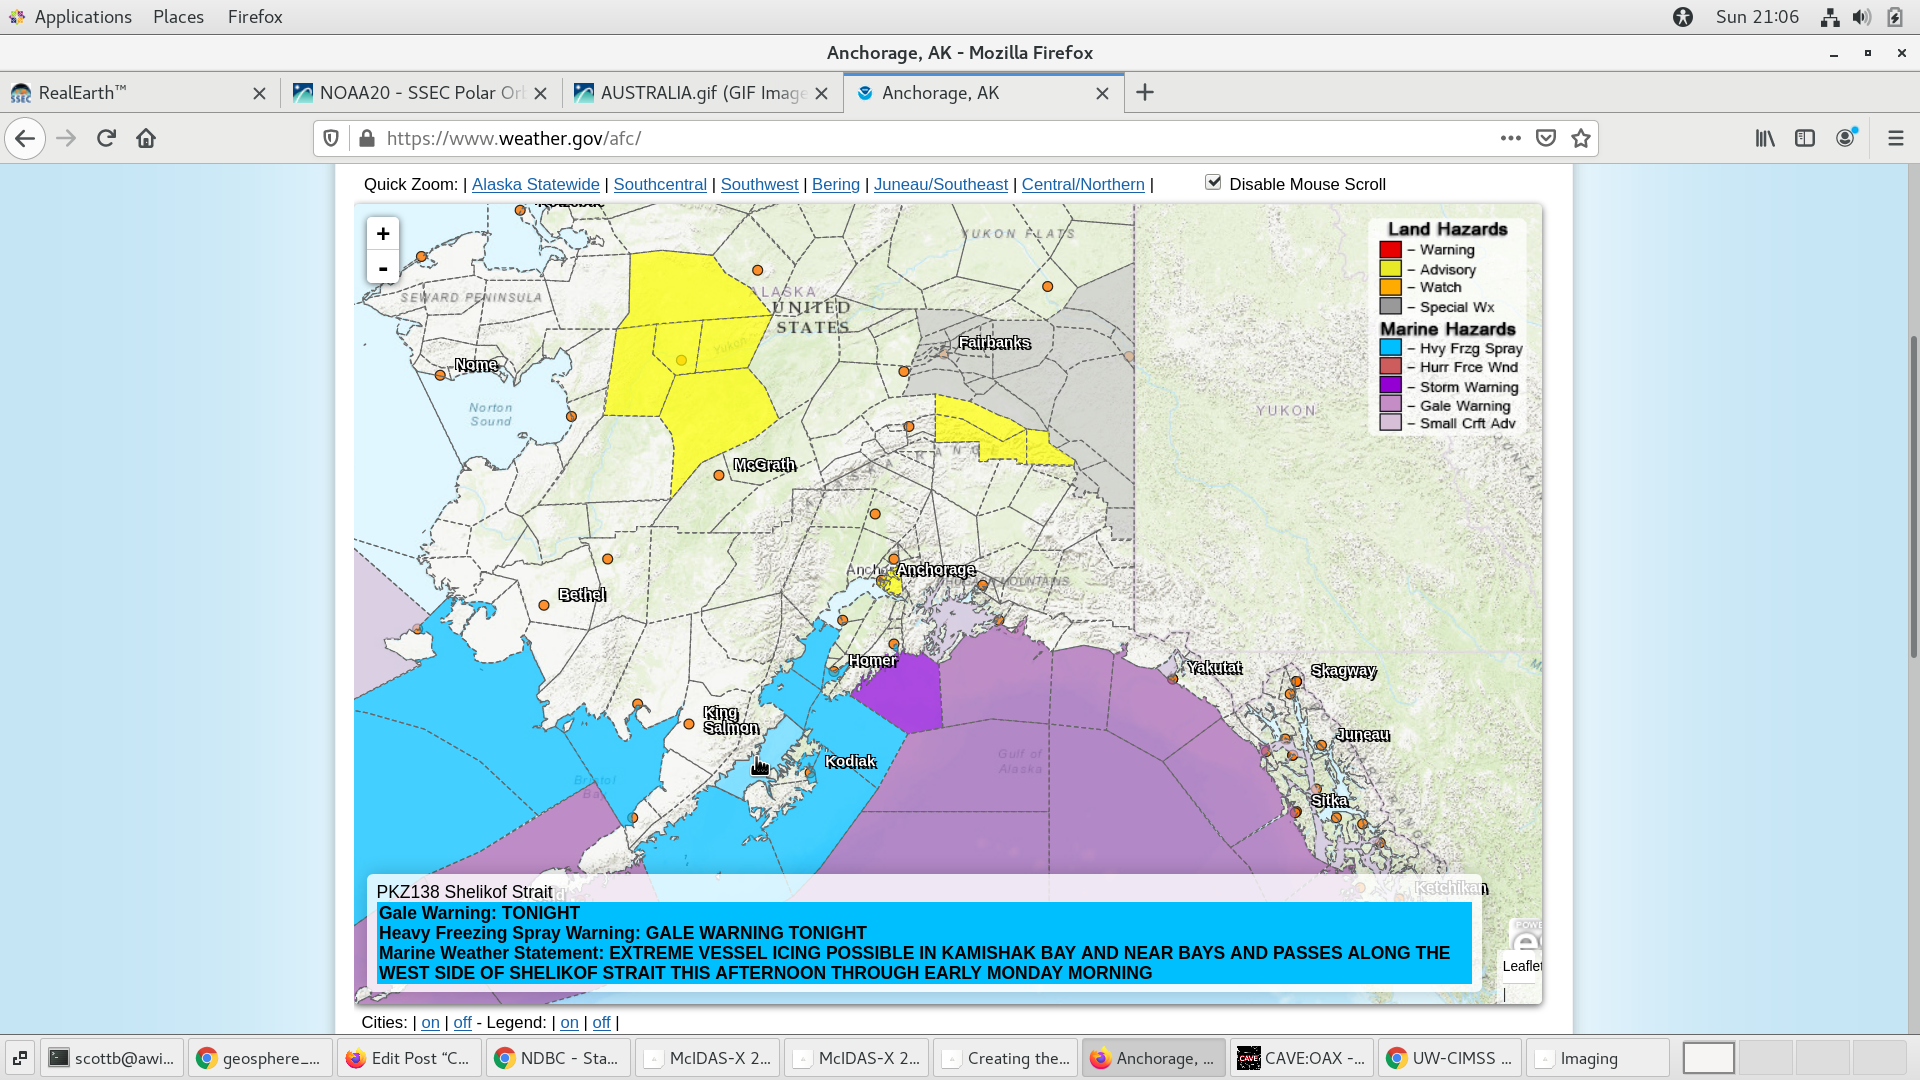
Heavy Freezing Spray Warning issued for the Shelikof Strait [click to enlarge]
A Heavy Freezing Spray Warning had been issued for that entire offshore region (light blue), including the Shelikof Strait
(above) — and
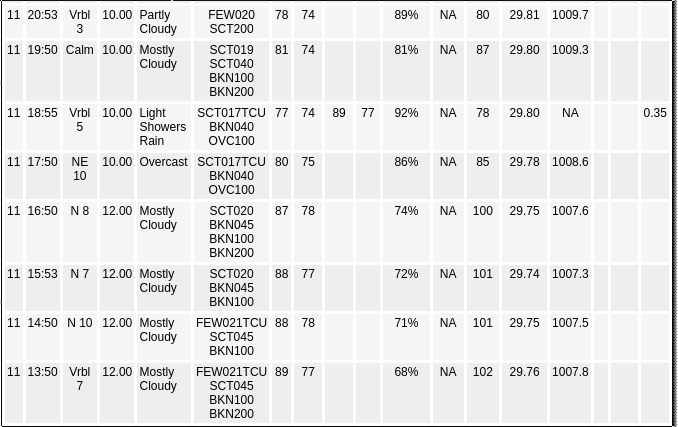
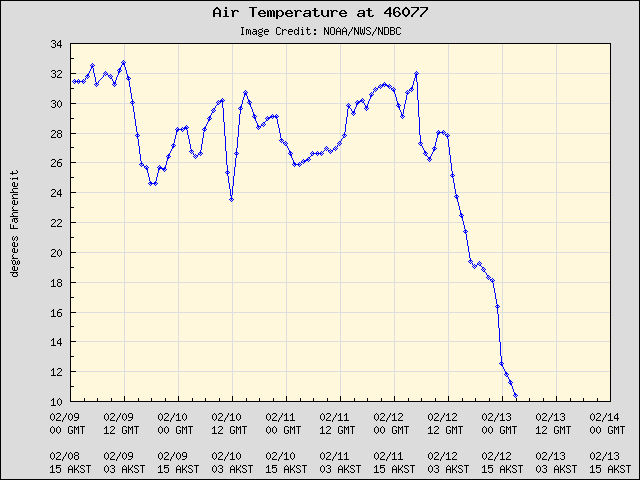
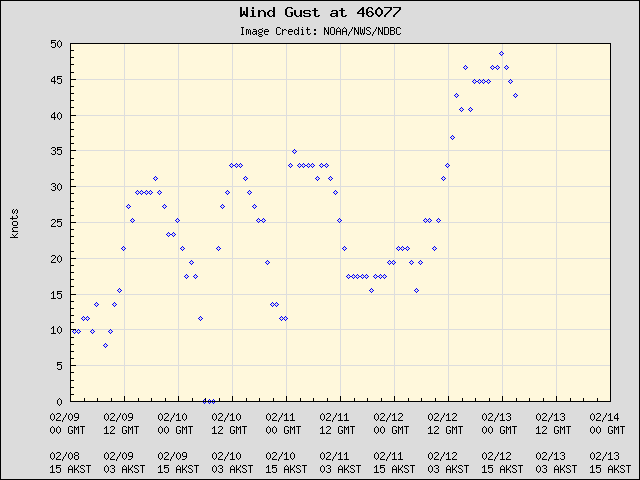
Buoy 46077 in the Shelikof Strait was recording Ice Accretion rates in excess of 1.0 inches per hour
(below). Buoy
air temperatures had fallen into the 10-12F range during that time, with
wind gusts of 40-50 knots — providing ideal conditions for rapid ice accretion.
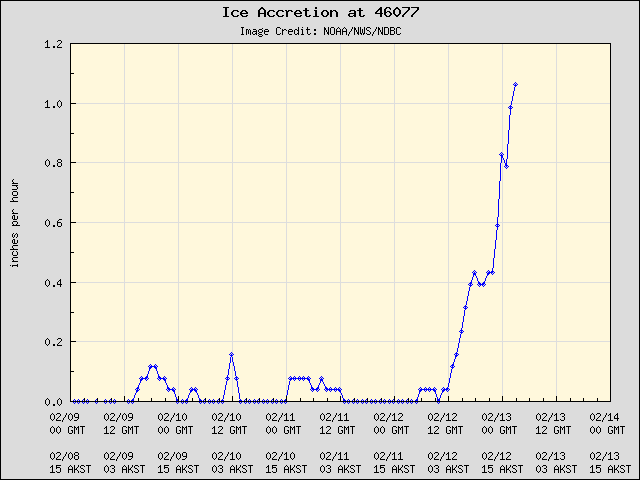
Plot of Buoy 46077 Ice Accretion Rates
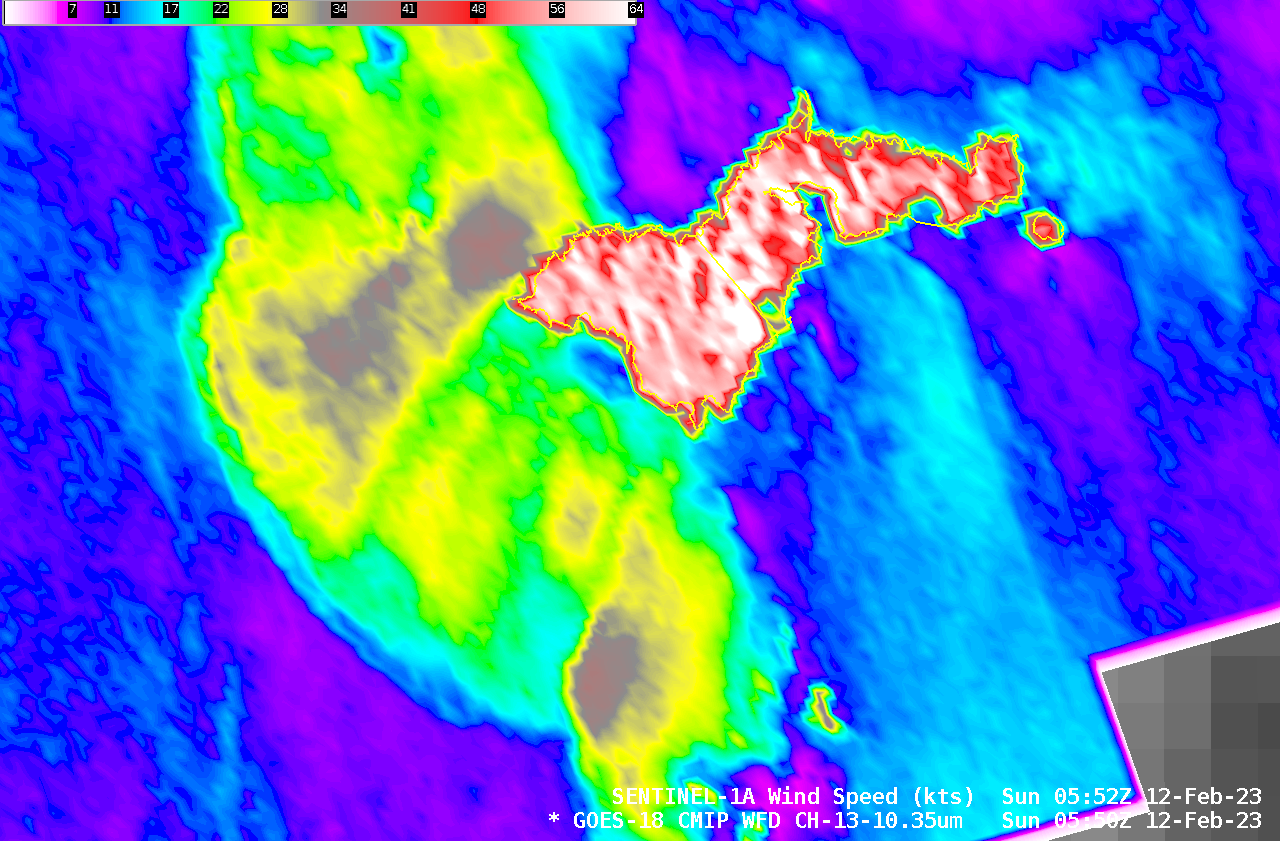
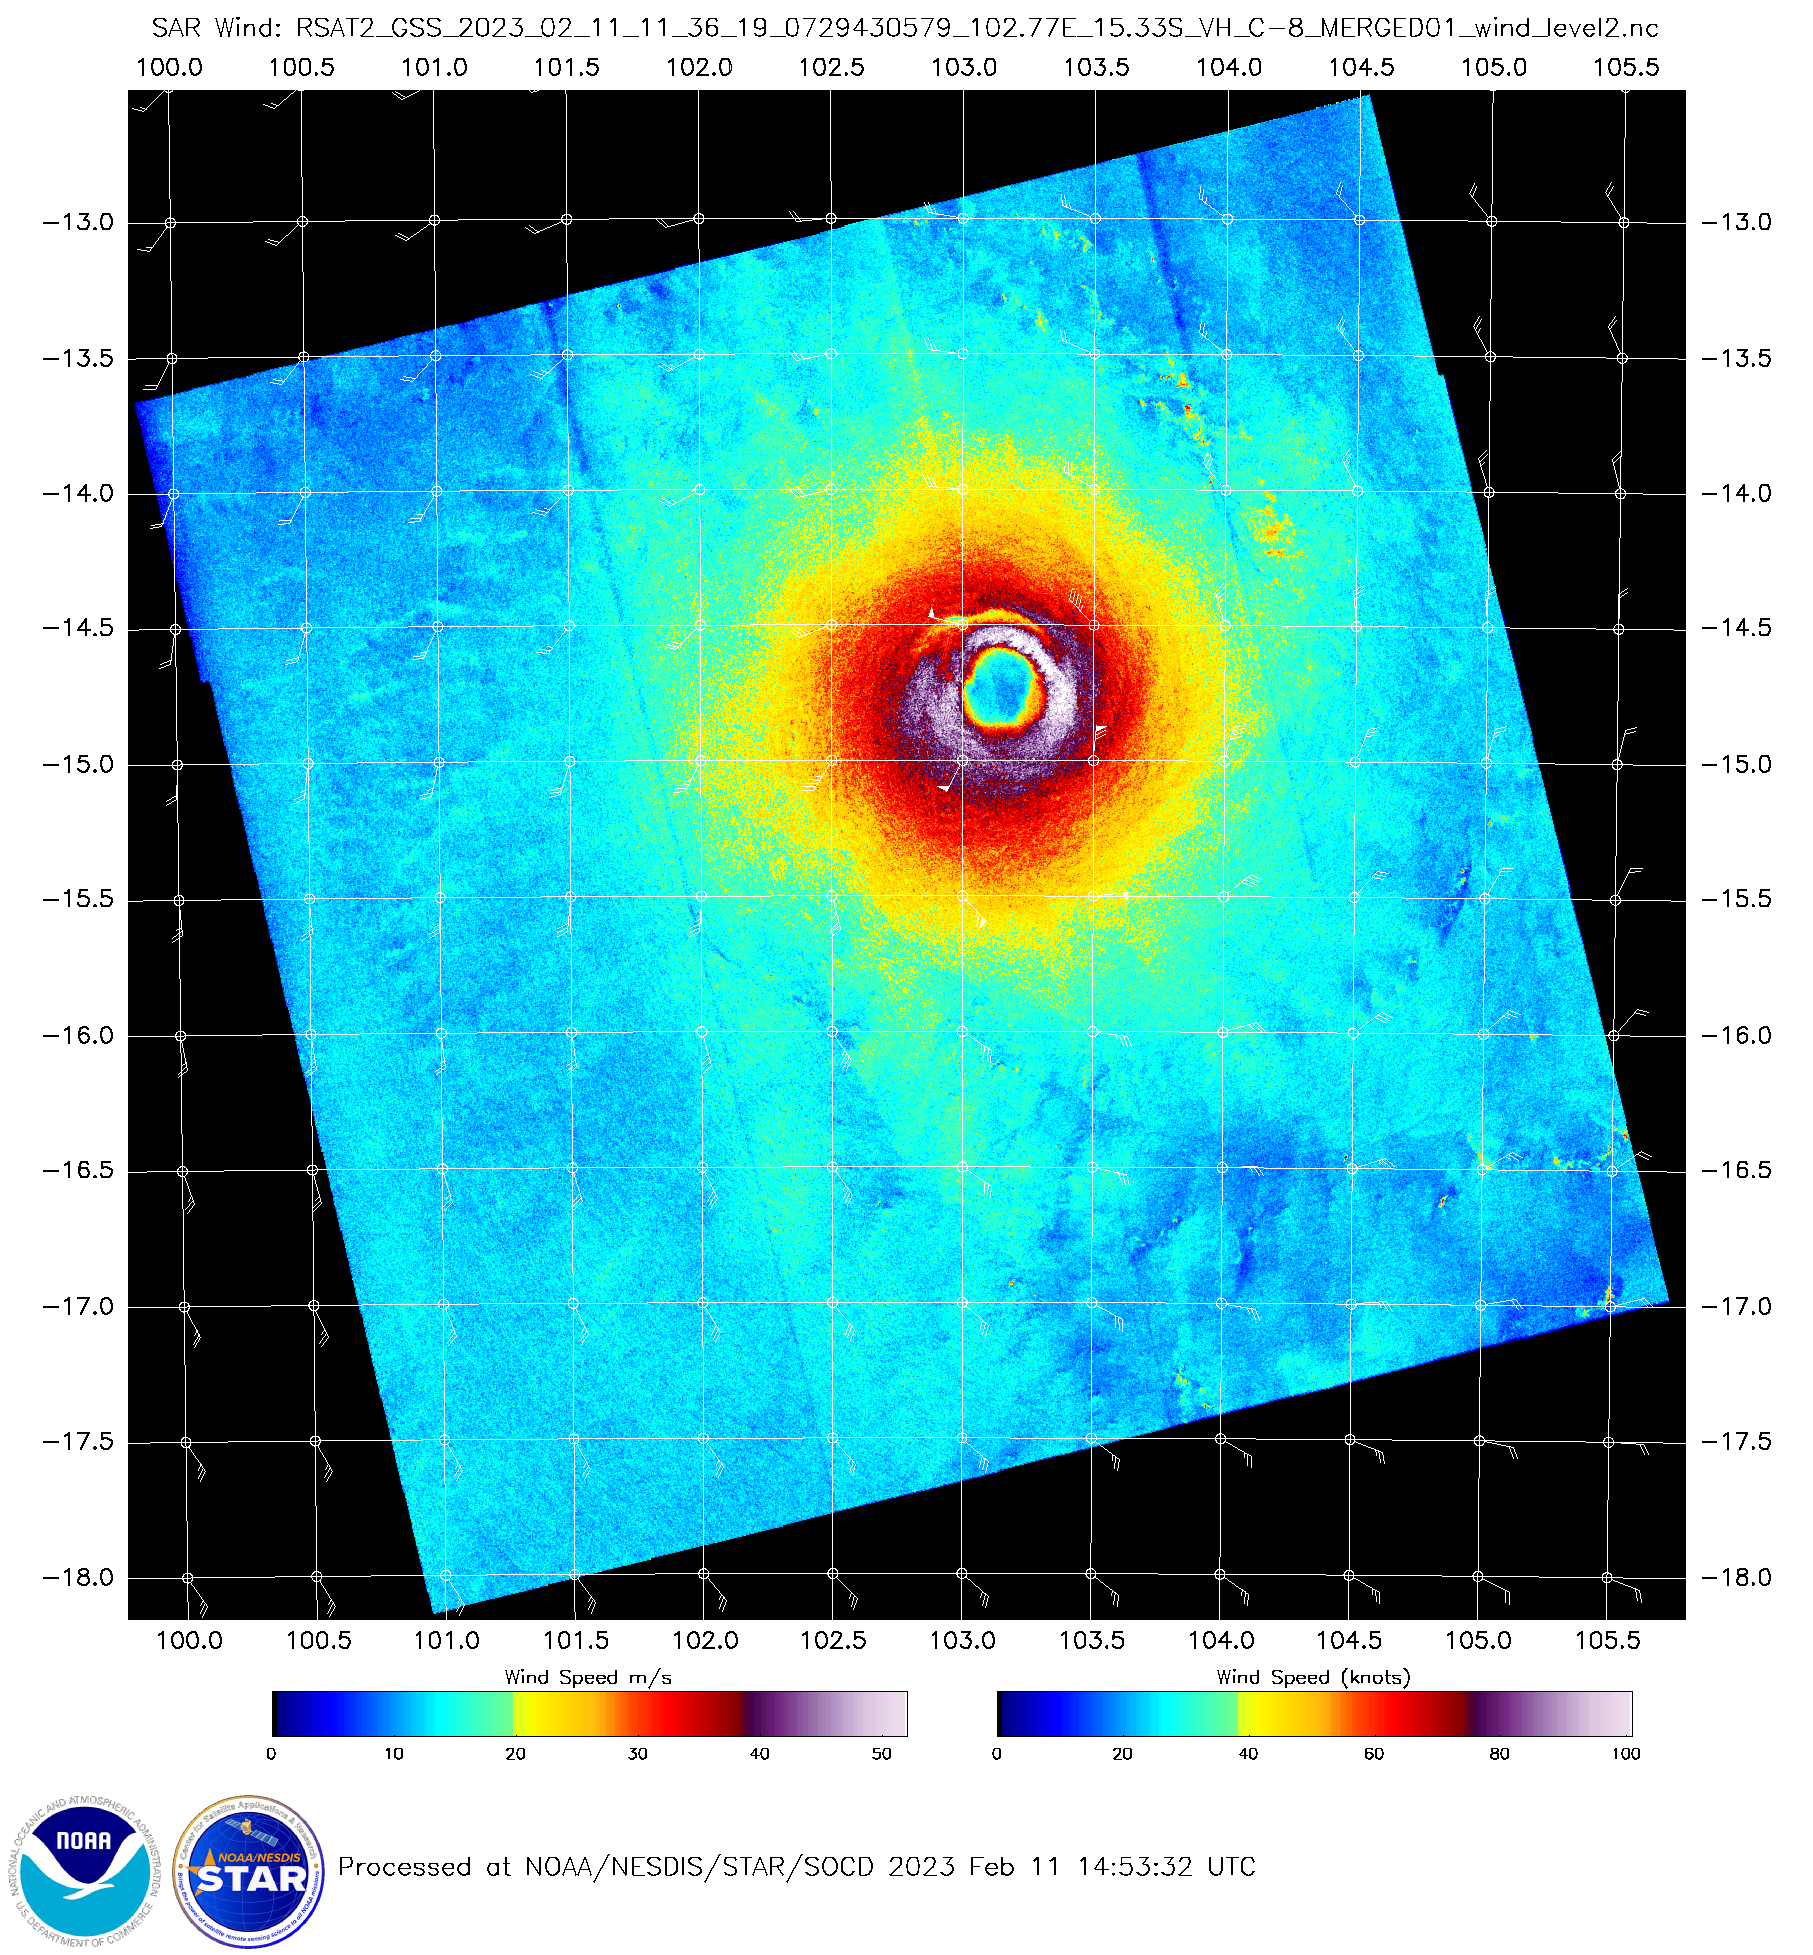
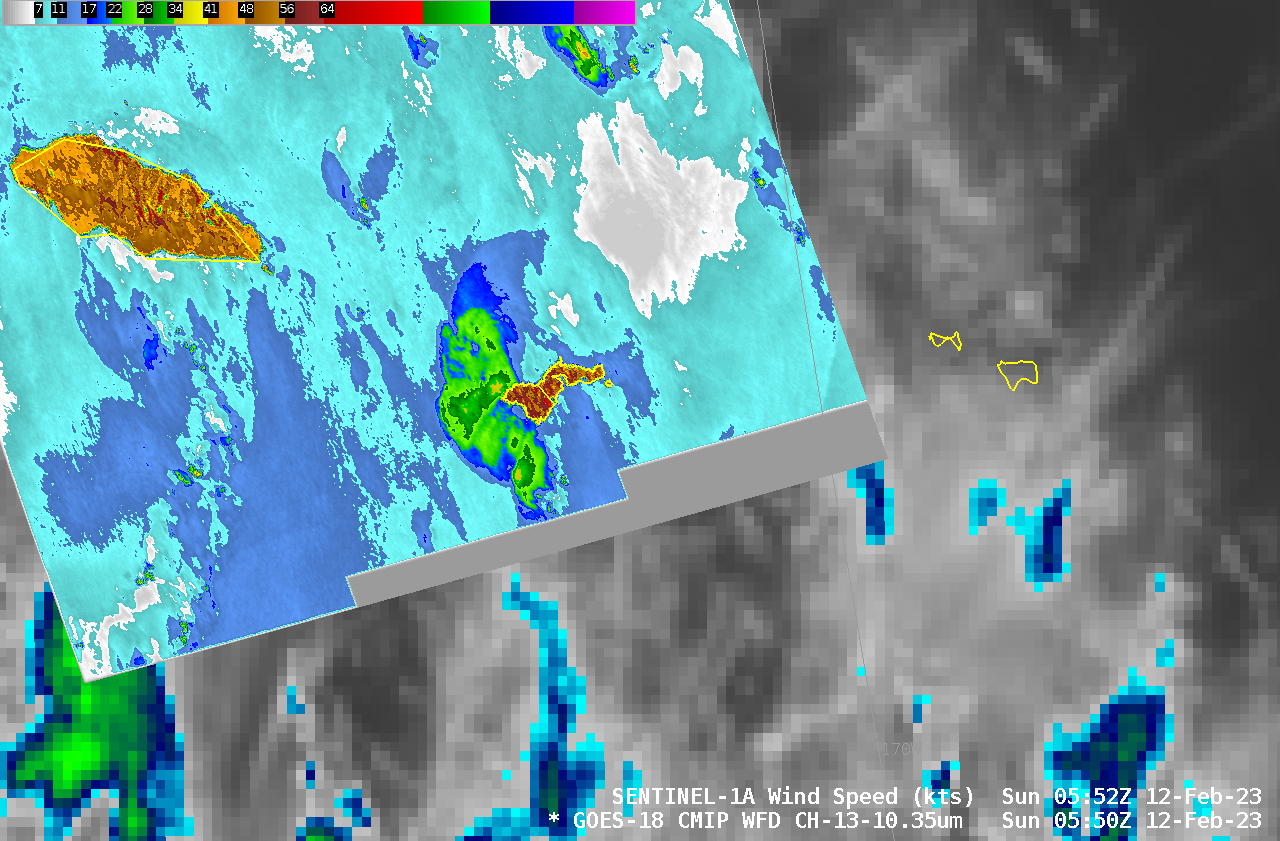
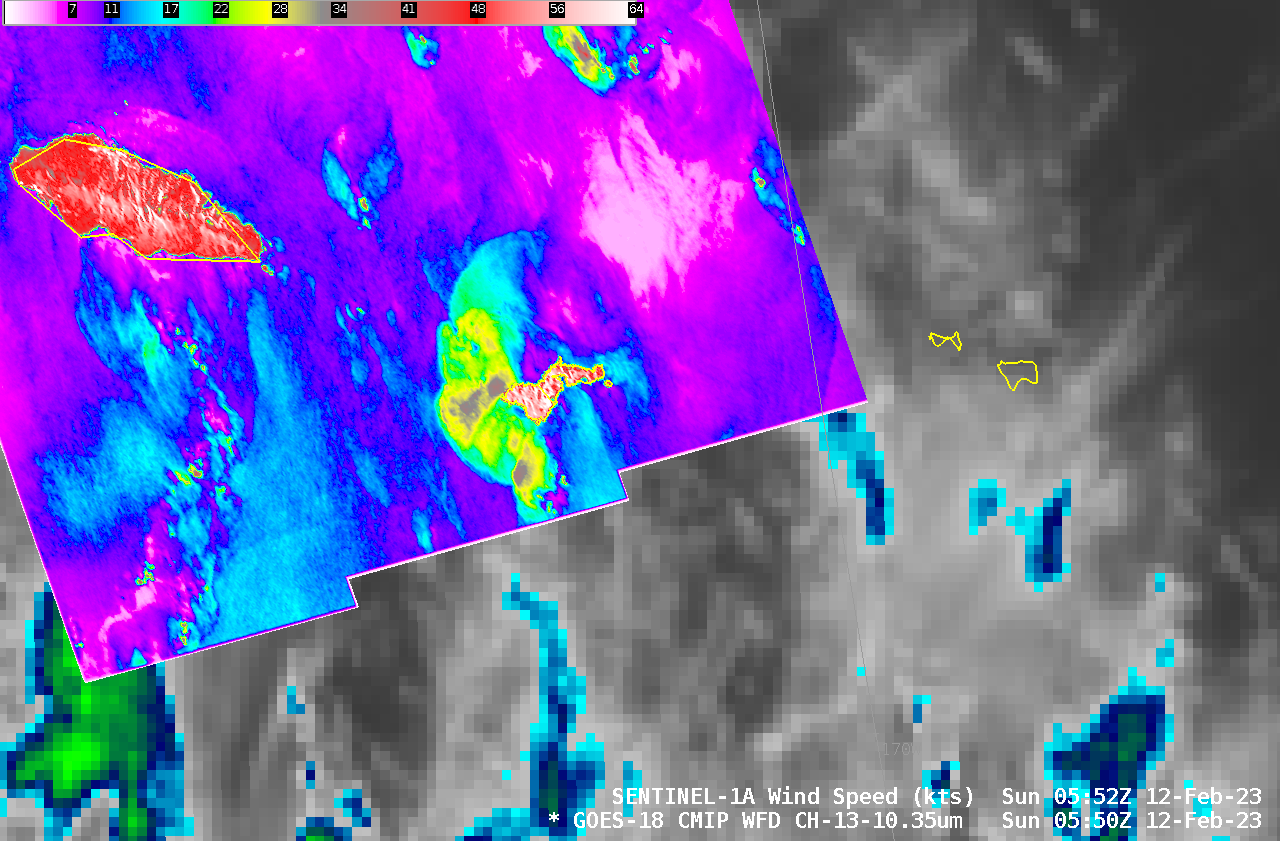
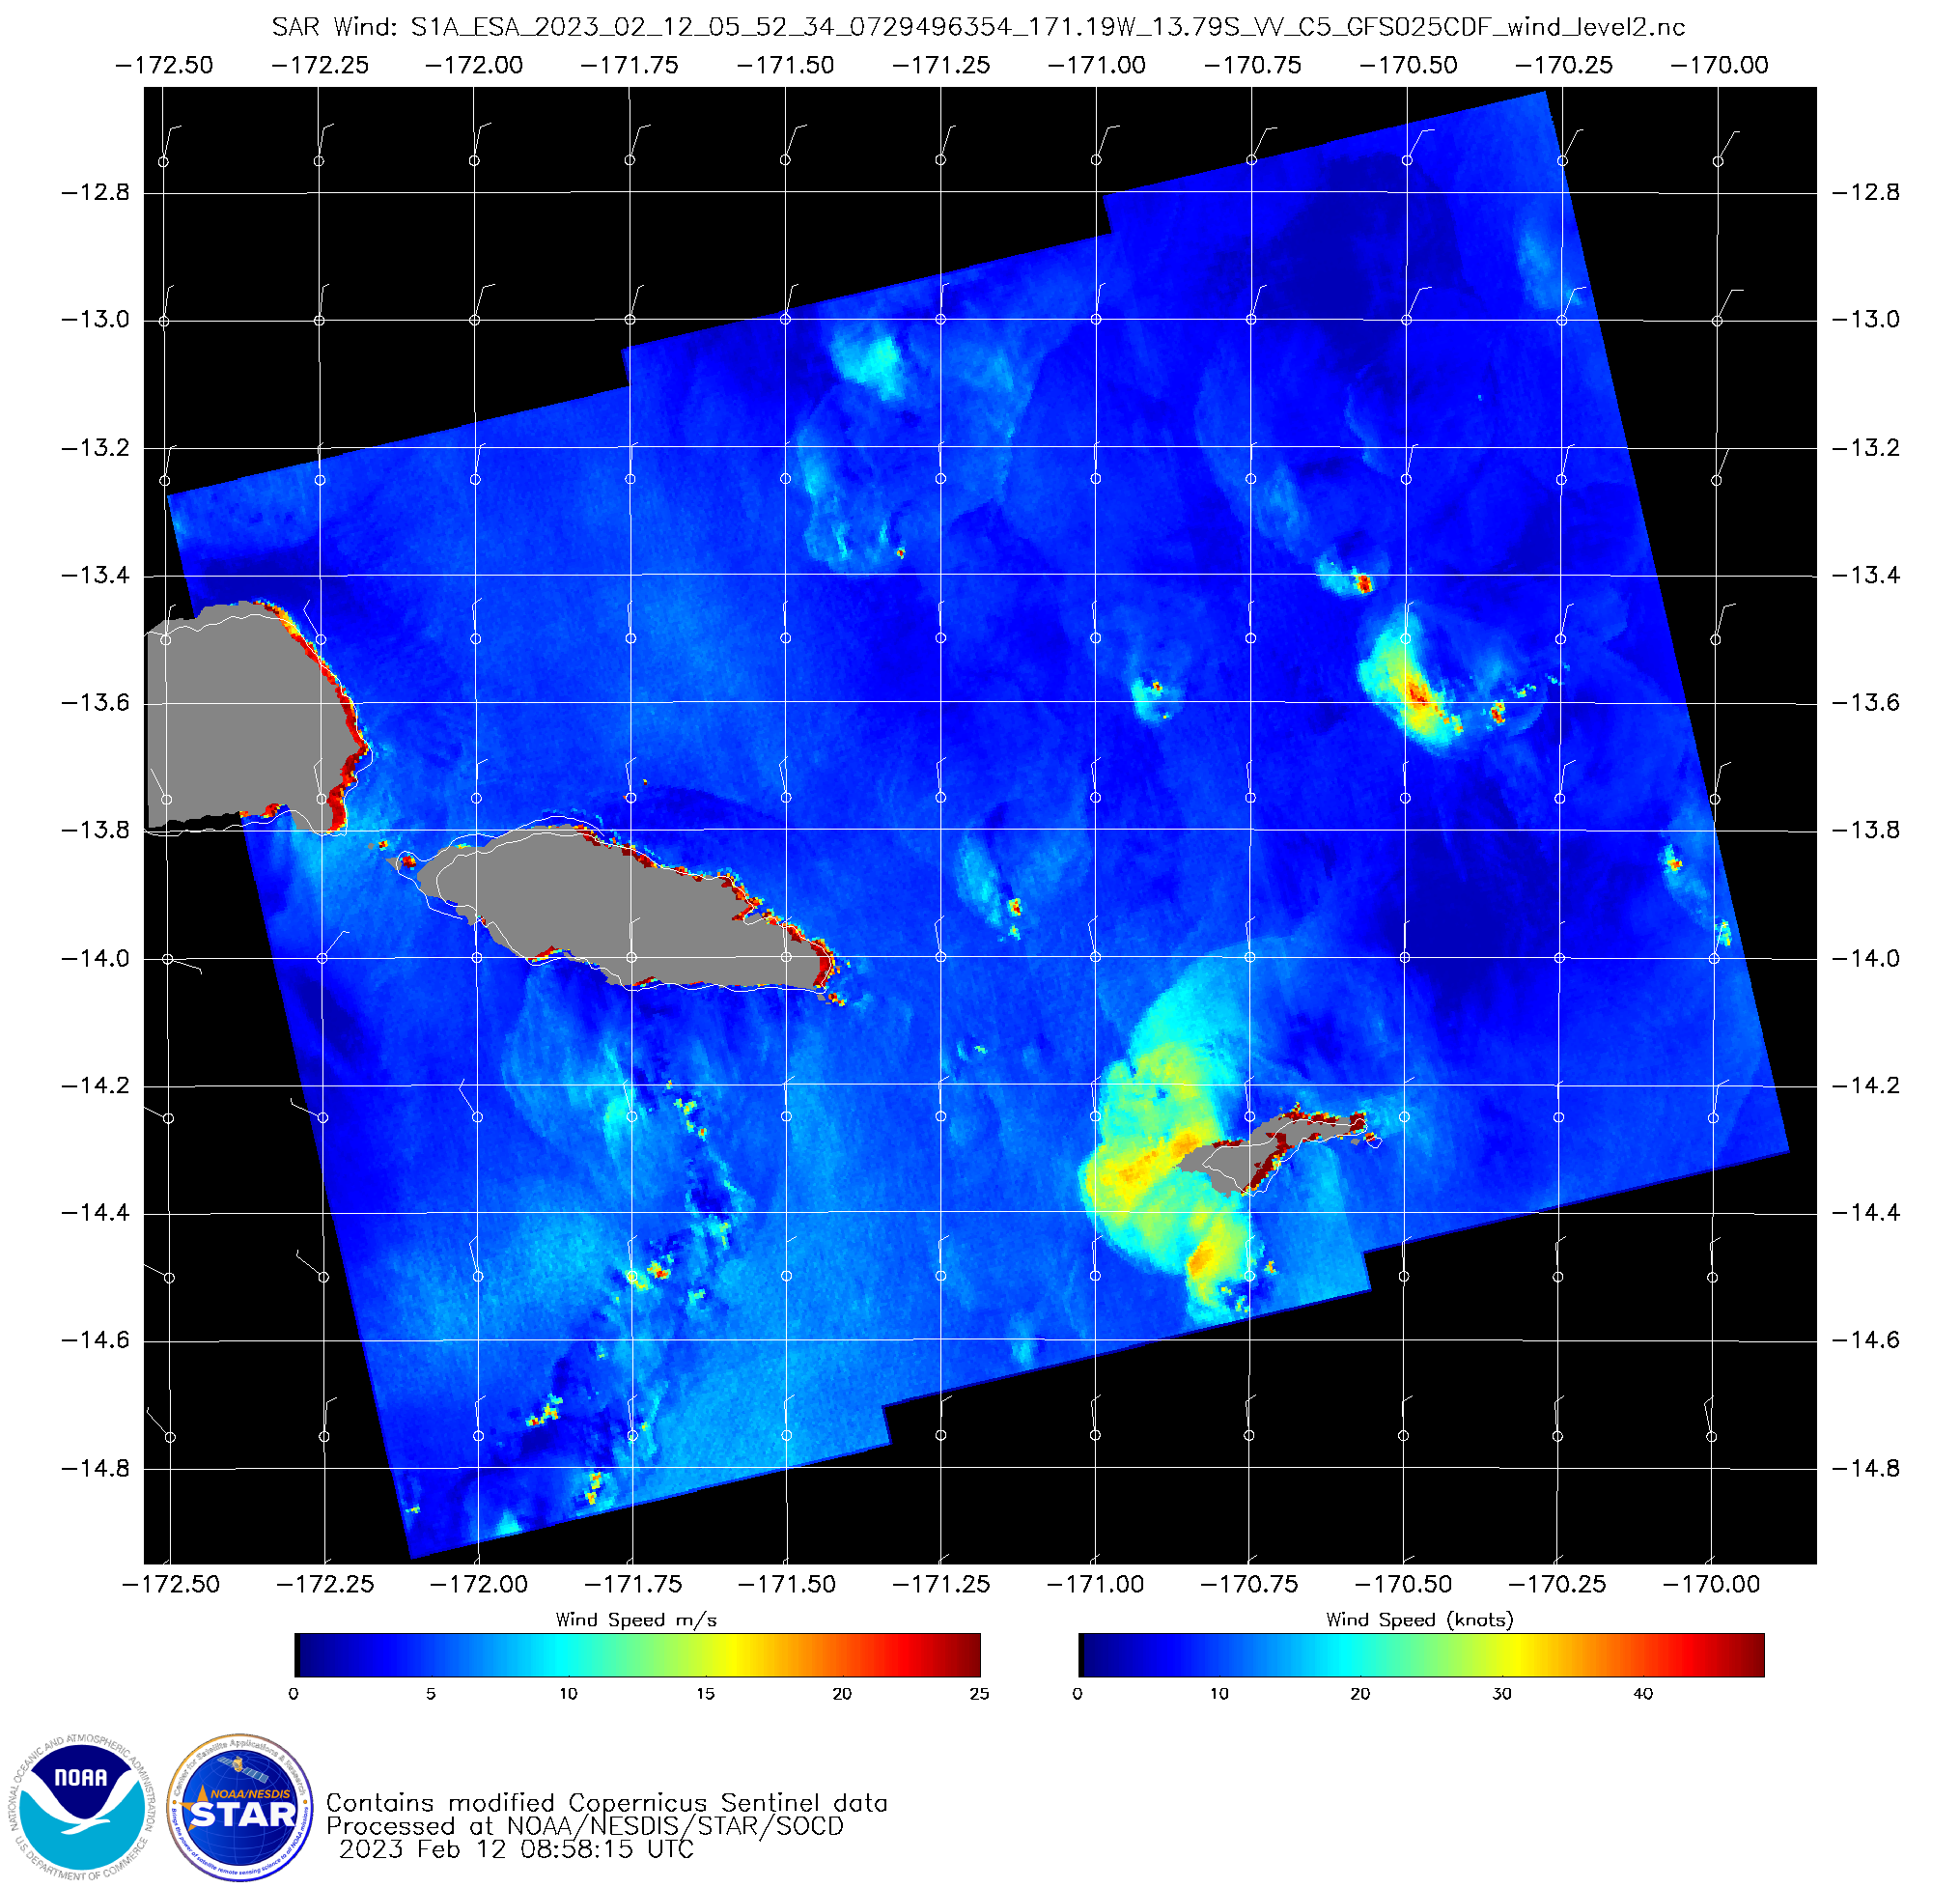
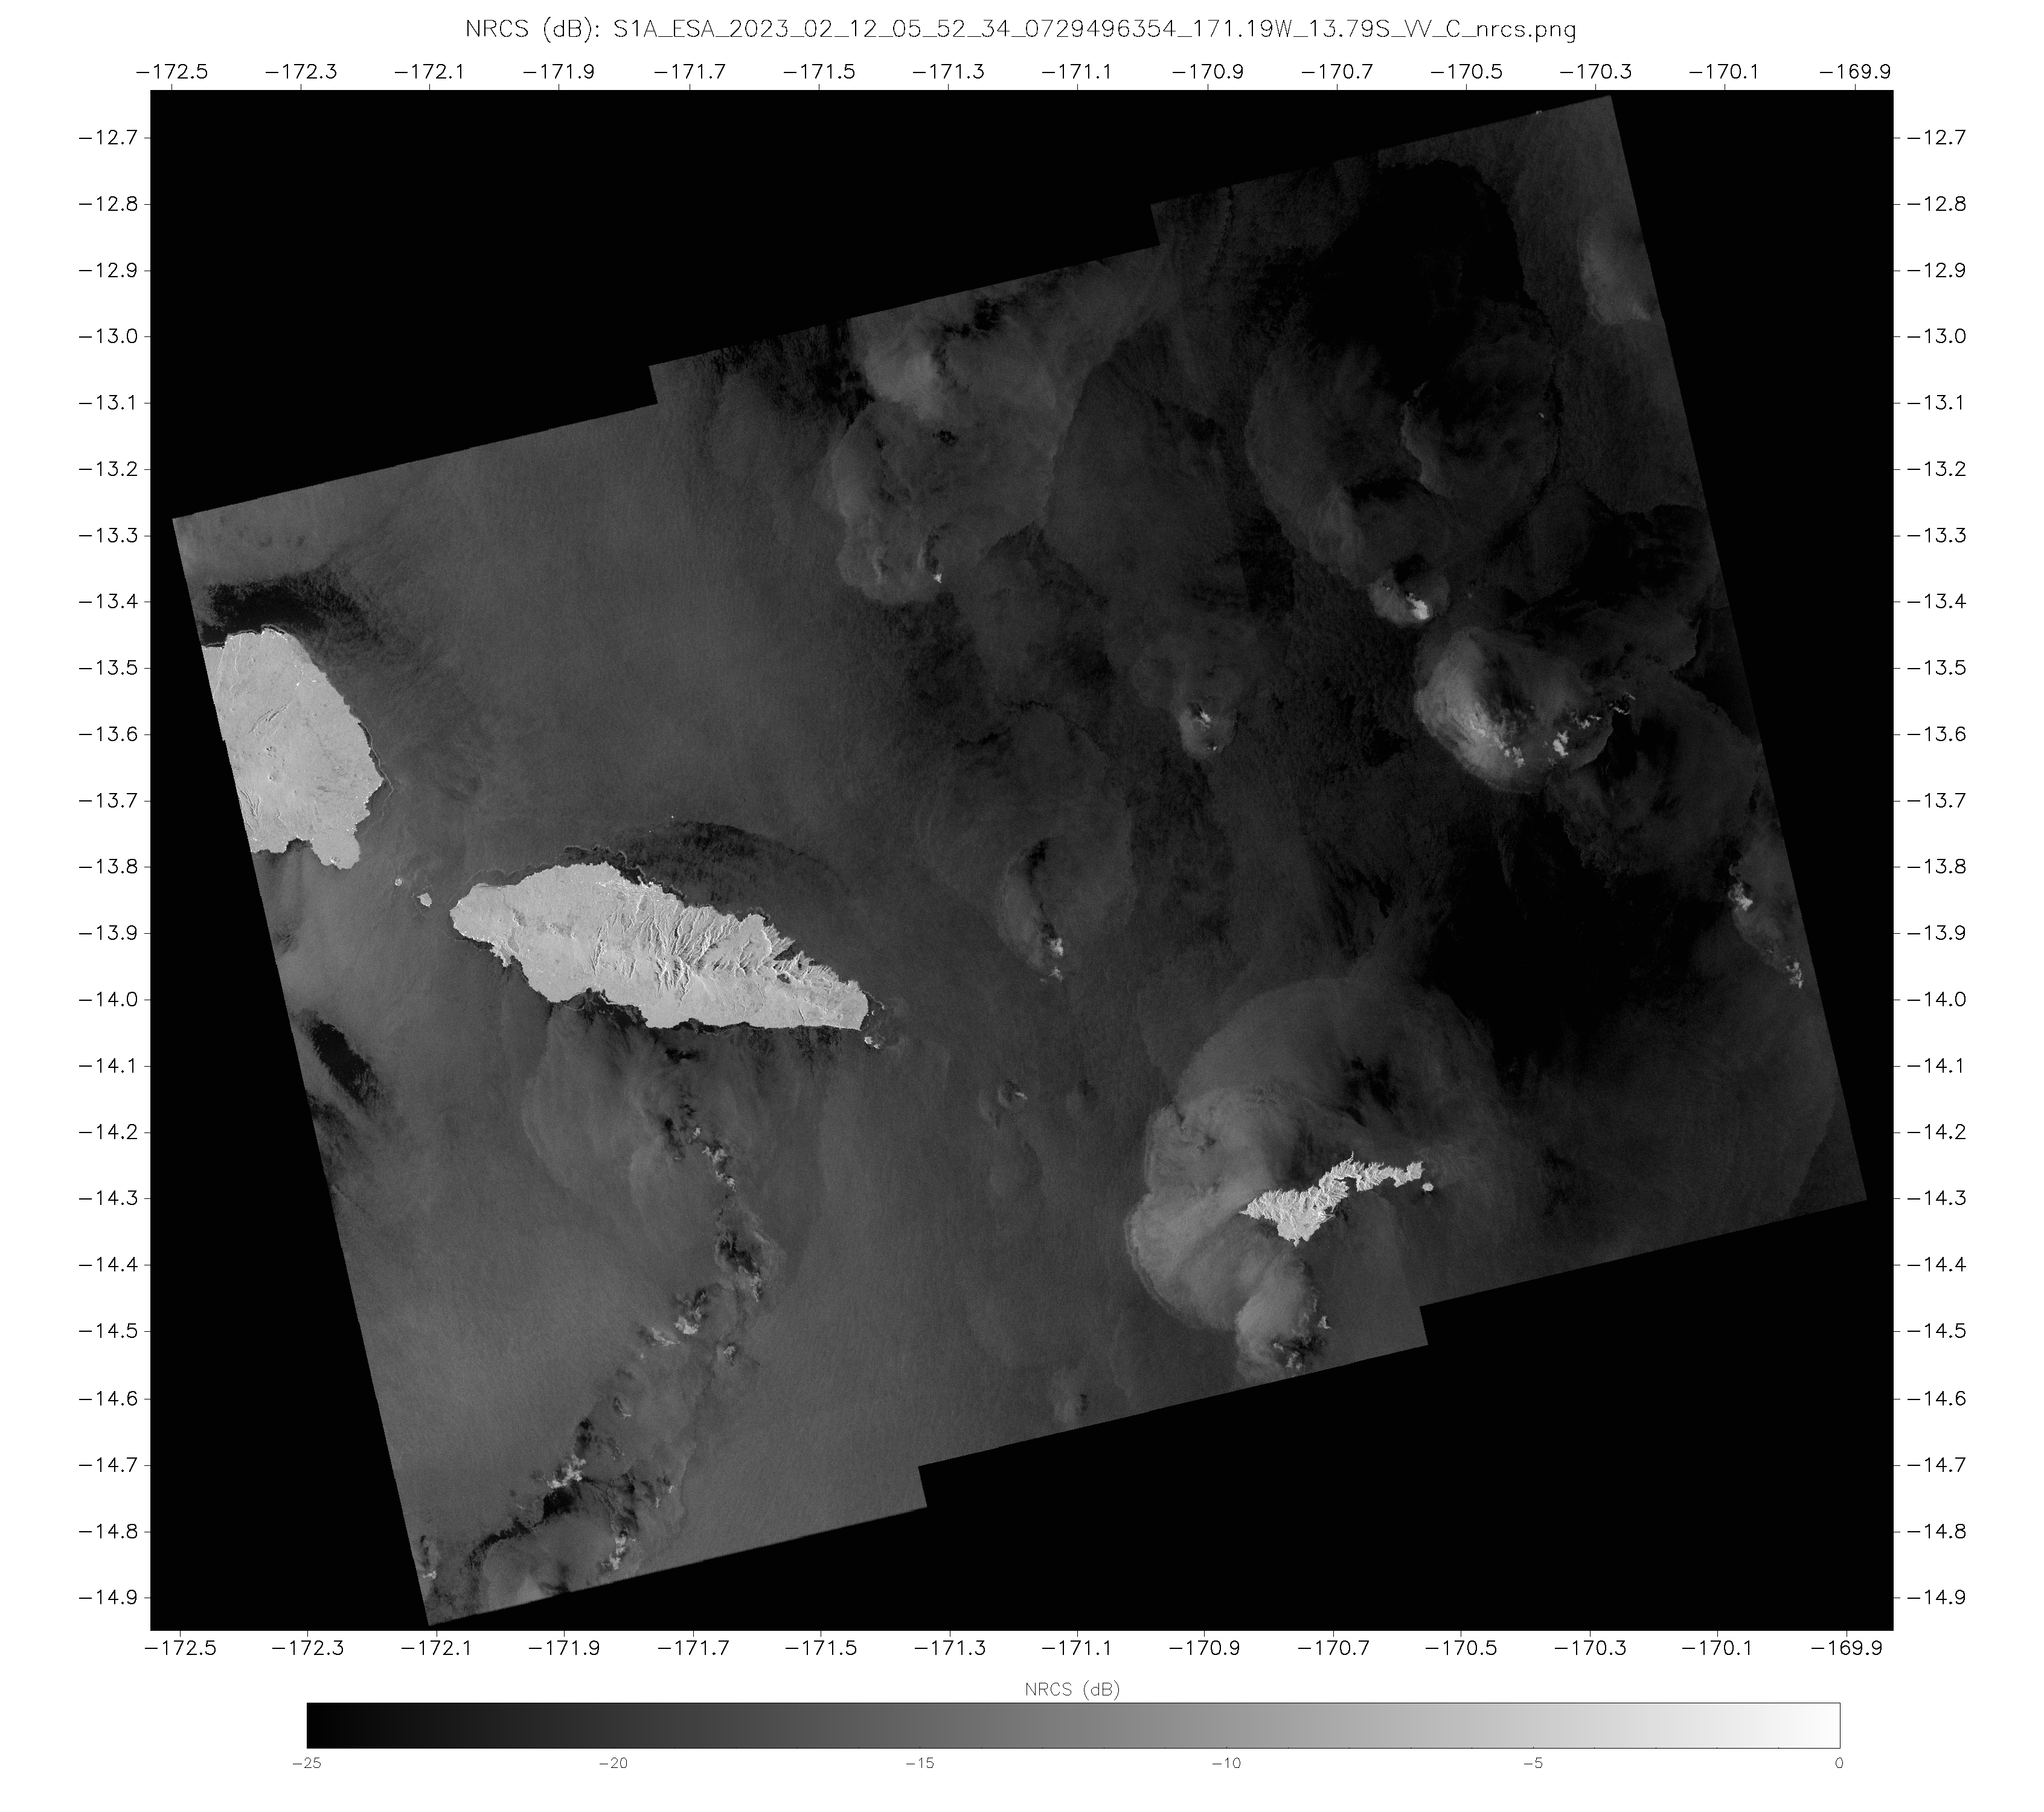
RCM/Radarsat-2 SAR winds at 1630 UTC on 12 February (source) are shown below — a NW-to-SE oriented swath of strong offshore winds (40-50 knots, darker shades of red) was seen extending from the far southern end of Cook Inlet (where the aforementioned 64-knot GOES-18 DMW speed was located) into the northwestern Gulf of Alaska. Another pocket of similarly-strong wind speeds was evident farther to the north, in the vicinity of Homer, Homer Spit and the mouth of Kachemak Bay.
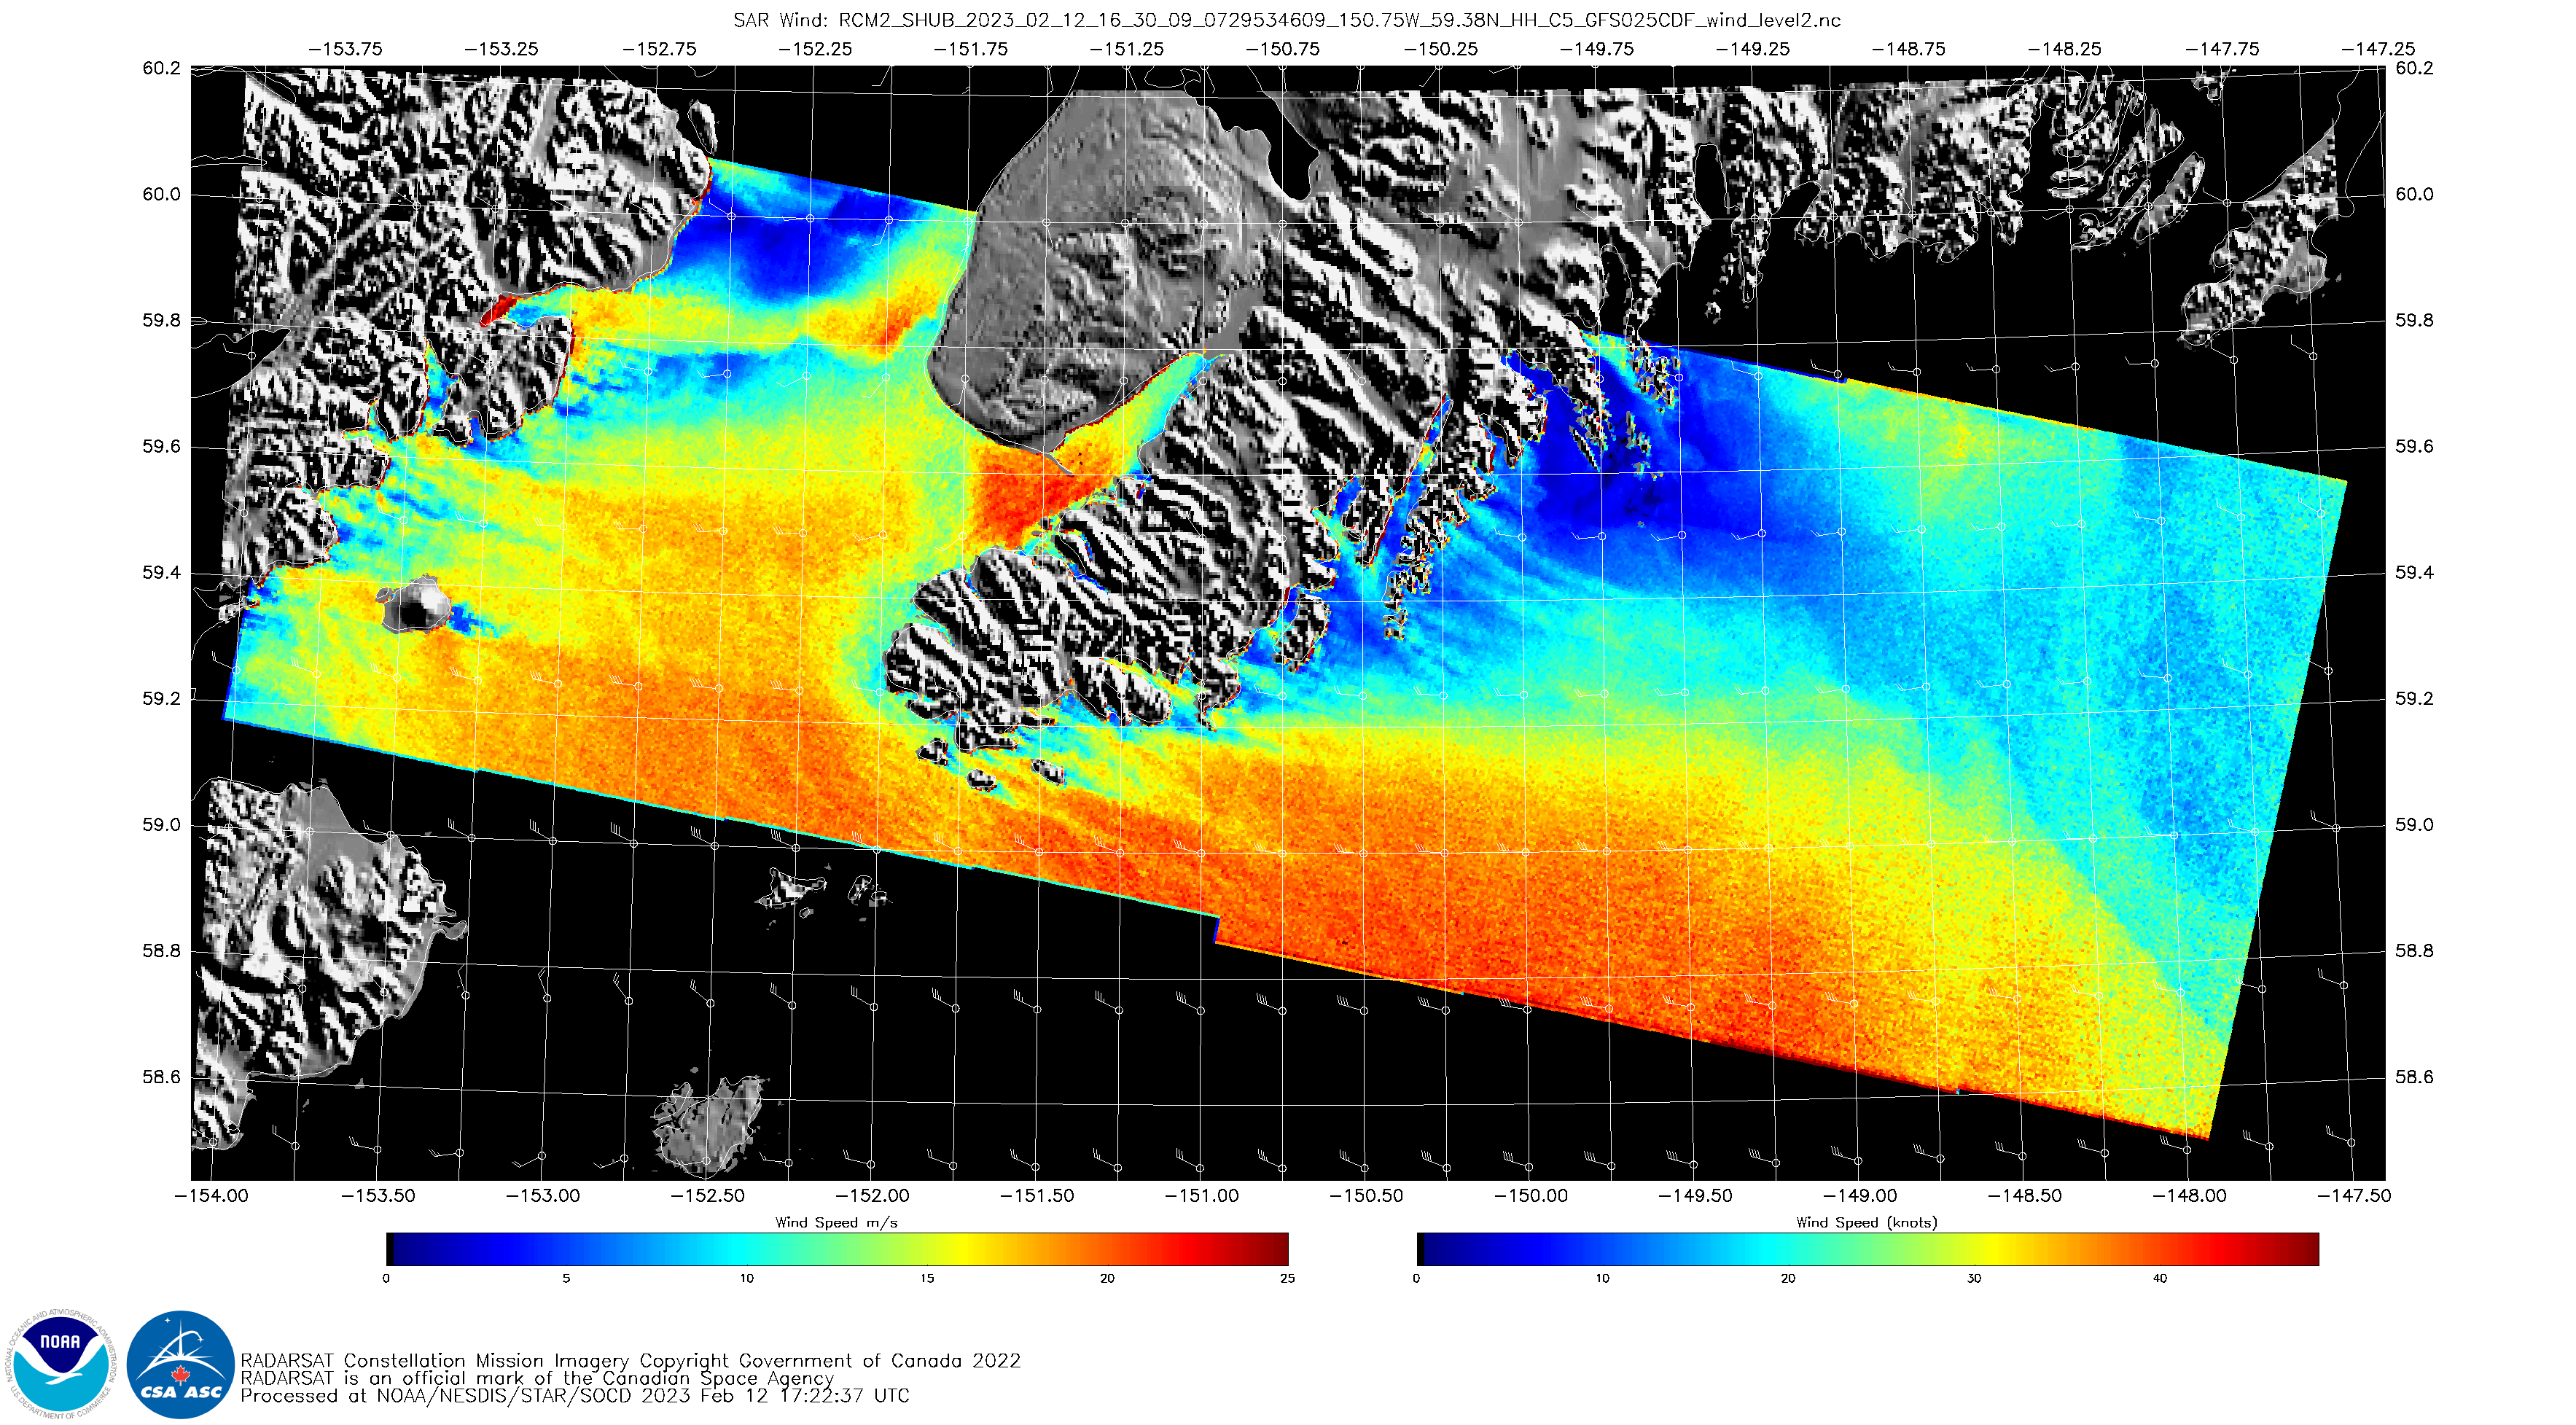
RCM/Radarsat-2 SAR winds at 1630 UTC on 12 February [click to enlarge]
View only this post
Read Less


