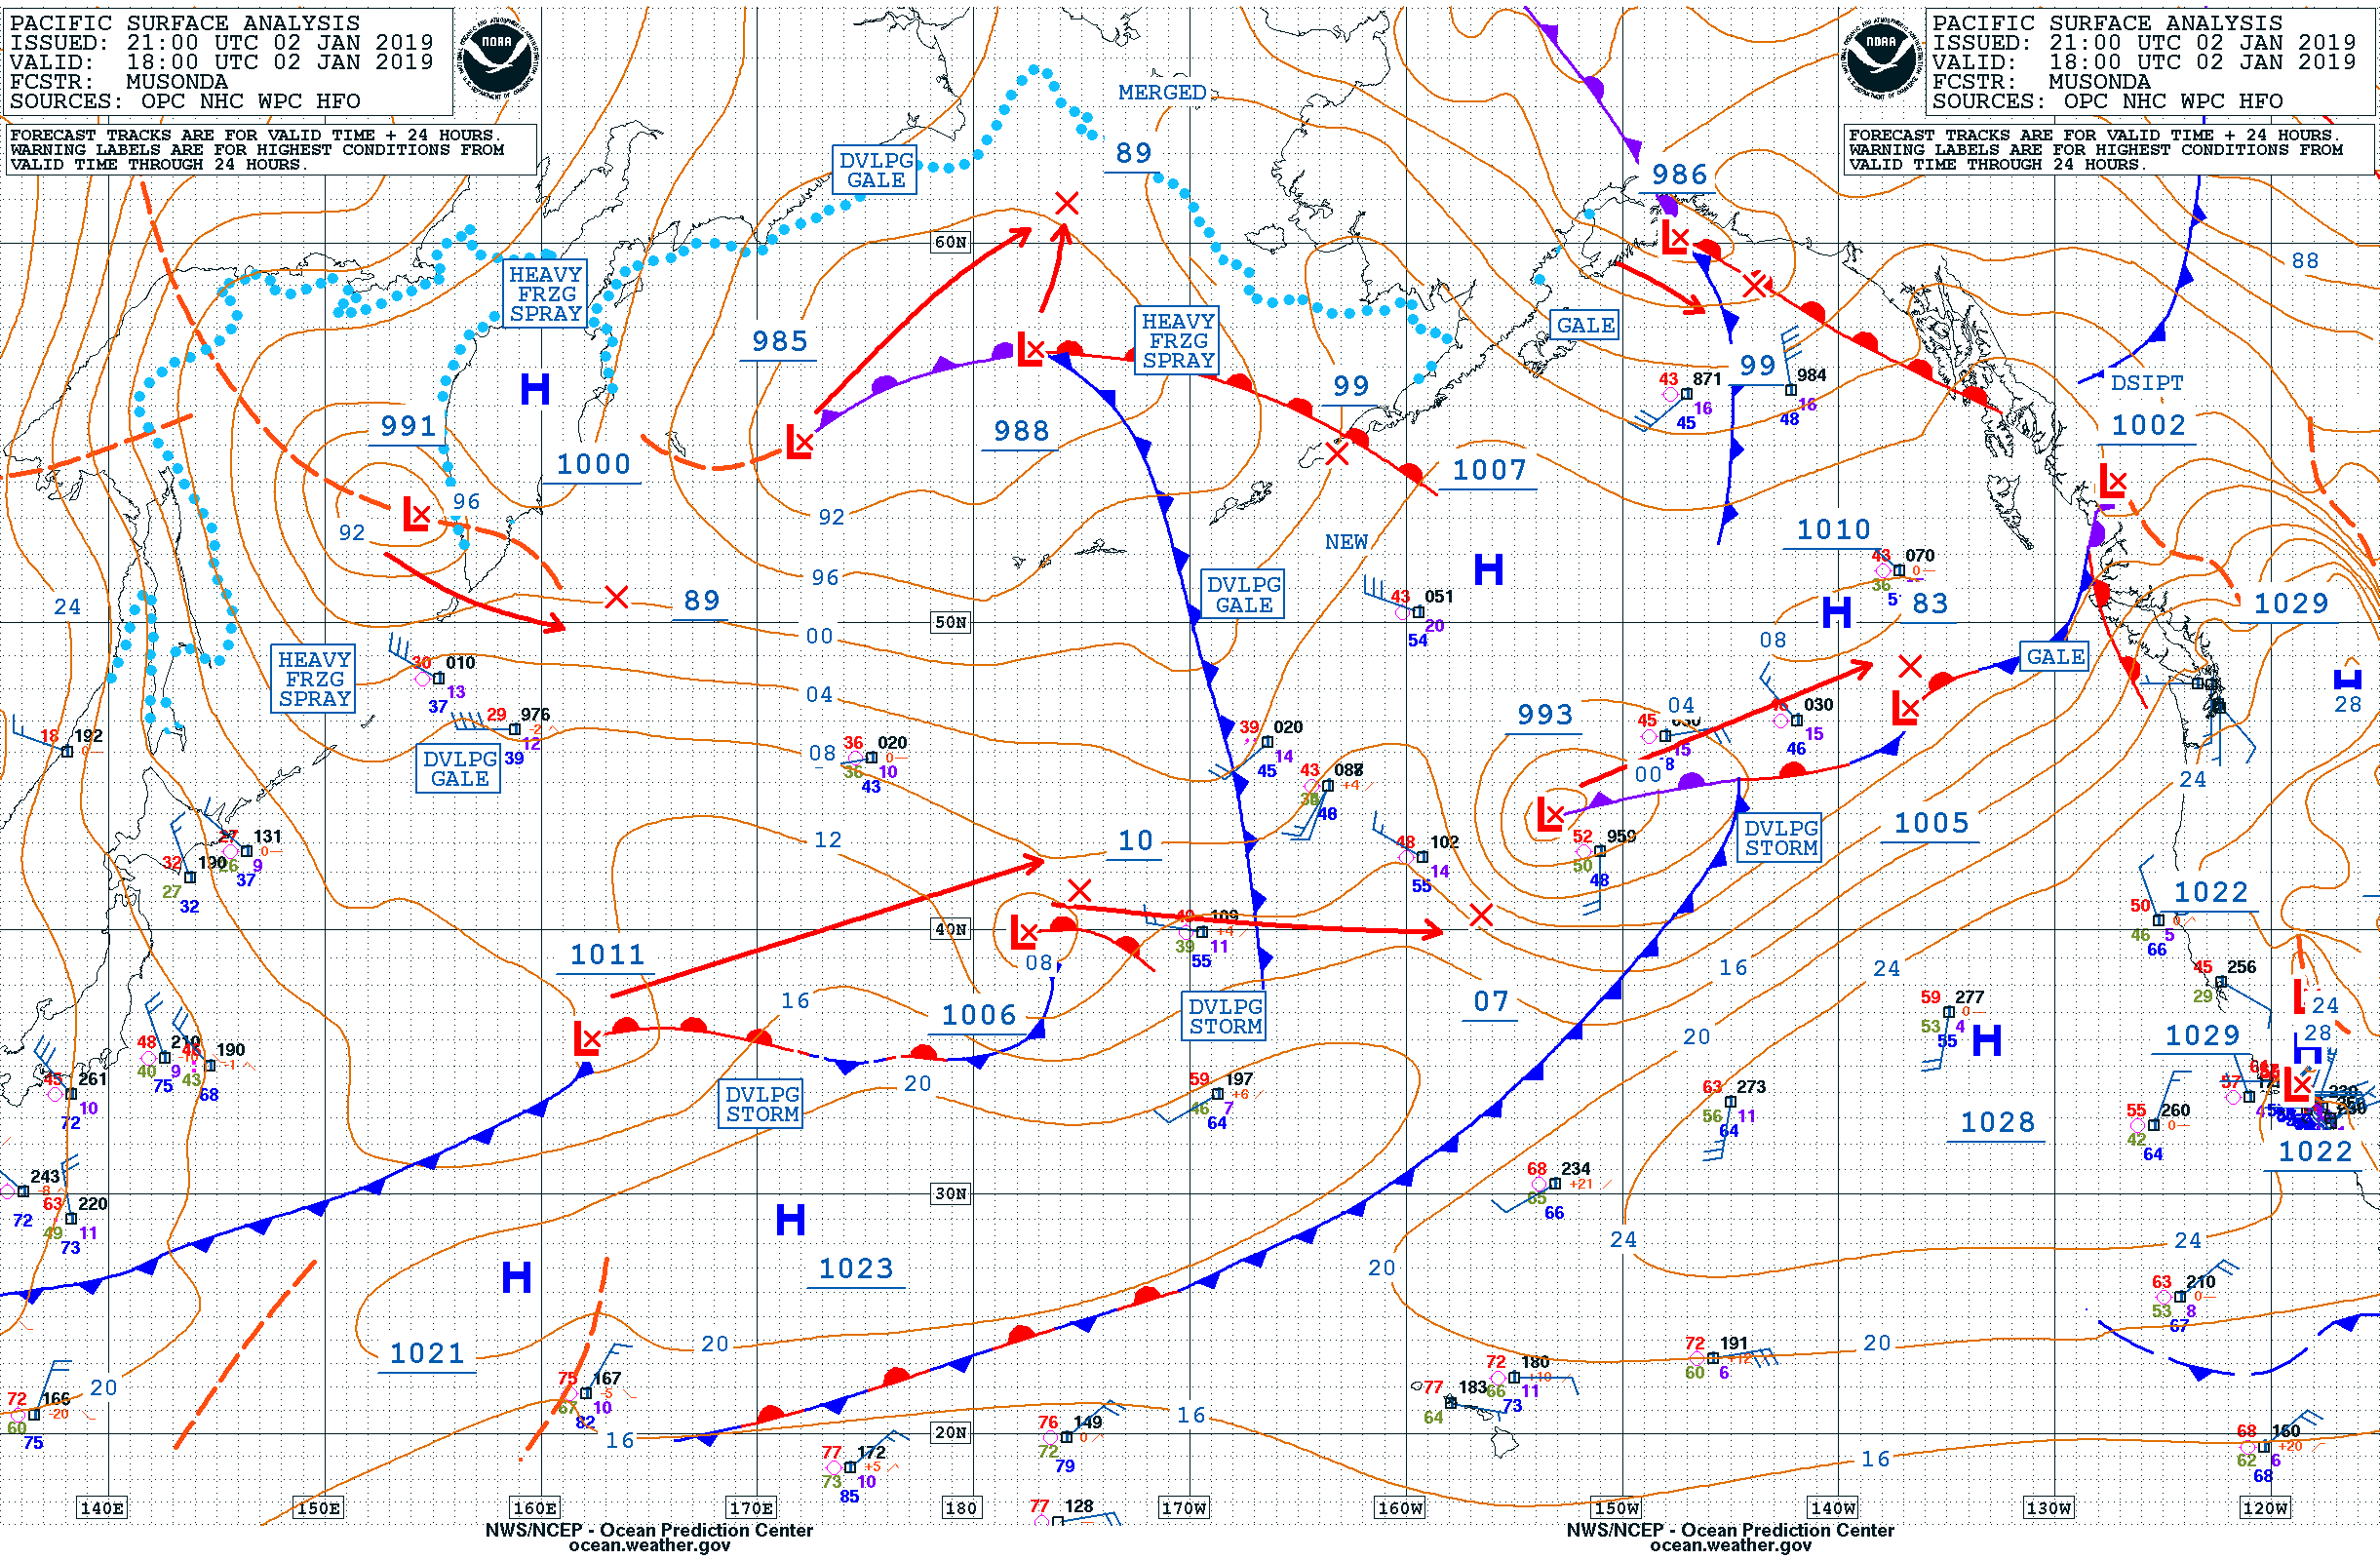
Strong jet stream over the North Pacific Ocean
![GOES-17 Mid-level Water Vapor (6.9 µm) images, with 250 hPa wind isotachs [click to play animation | MP4]](https://cimss.ssec.wisc.edu/satellite-blog/wp-content/uploads/sites/5/2019/01/190102_goes17_waterVapor_250hPa_isotachs_North_Pacific_anim.gif)
GOES-17 Mid-level Water Vapor (6.9 µm) images, with 250 hPa wind isotachs [click to play animation | MP4]
* GOES-17 images shown here are preliminary and non-operational *
GOES-17 Mid-level Water Vapor (6.9 µm) images with an overlay of 250 hPa wind isotachs from the GFS90 model (above) showed a string of disturbances (surface analysis) along the axis of a 180-knot “Japan Jet” across the North Pacific Ocean on 02 January 2019.
GOES-17 Split Ozone (9.6 µm – 10.3 µm) Brightness Temperature Difference images (below) include an overlay of PV1.5 pressure (an indicator of the height of the “dynamic tropopause”) — they showed the difference between cold polar air having a low tropopause (shades of cyan to blue) north of the jet stream and warm tropical air having a much higher tropopause (shades of yellow). The Split Ozone BTD is the Green component of the Air Mass Red-Green-Blue (RGB) product.
![GOES-17 Split Ozone (9.6 - 10.3 µm) images, with contours of PV1.5 pressure [click to play animation | MP4]](https://cimss.ssec.wisc.edu/satellite-blog/wp-content/uploads/sites/5/2019/01/190102_goes17_splitOzone_pv1.5pressure_North_Pacific_anim.gif)
GOES-17 Split Ozone (9.6 – 10.3 µm) images, with contours of PV1.5 pressure [click to play animation | MP4]
![Plots of rawinsonde data from St. Paul Island, Alaska [click to enlarge]](https://cimss.ssec.wisc.edu/satellite-blog/wp-content/uploads/sites/5/2019/01/190102_PASN_RAOBS.GIF)
Plots of rawinsonde data from St. Paul Island, Alaska [click to enlarge]
![Plots of rawinsonde data from Lihue, Hawai'i [click to enlarge]](https://cimss.ssec.wisc.edu/satellite-blog/wp-content/uploads/sites/5/2019/01/190102_PHLI_RAOBS.GIF)
Plots of rawinsonde data from Lihue, Hawai’i [click to enlarge]
![GOES-17 Air Mass RGB images [click to play animation | MP4]](https://cimss.ssec.wisc.edu/satellite-blog/wp-content/uploads/sites/5/2019/01/190102_goes17_airmassRGB_North_Pacific_anim.gif)
GOES-17 Air Mass RGB images [click to play animation | MP4]
![Suomi NPP VIIRS Day/Night Band (0.7 µm) and Infrared Window (11.45 µm) images at 1427 UTC and 0022 UTC [click to enlarge]](https://cimss.ssec.wisc.edu/satellite-blog/wp-content/uploads/sites/5/2019/01/190102_suomiNPP_viirs_dayNightBand_infraredWindow_Bering_Sea_anim.gif)
Suomi NPP VIIRS Day/Night Band (0.7 µm) and Infrared Window (11.45 µm) images at 1427 UTC and 0022 UTC [click to enlarge]
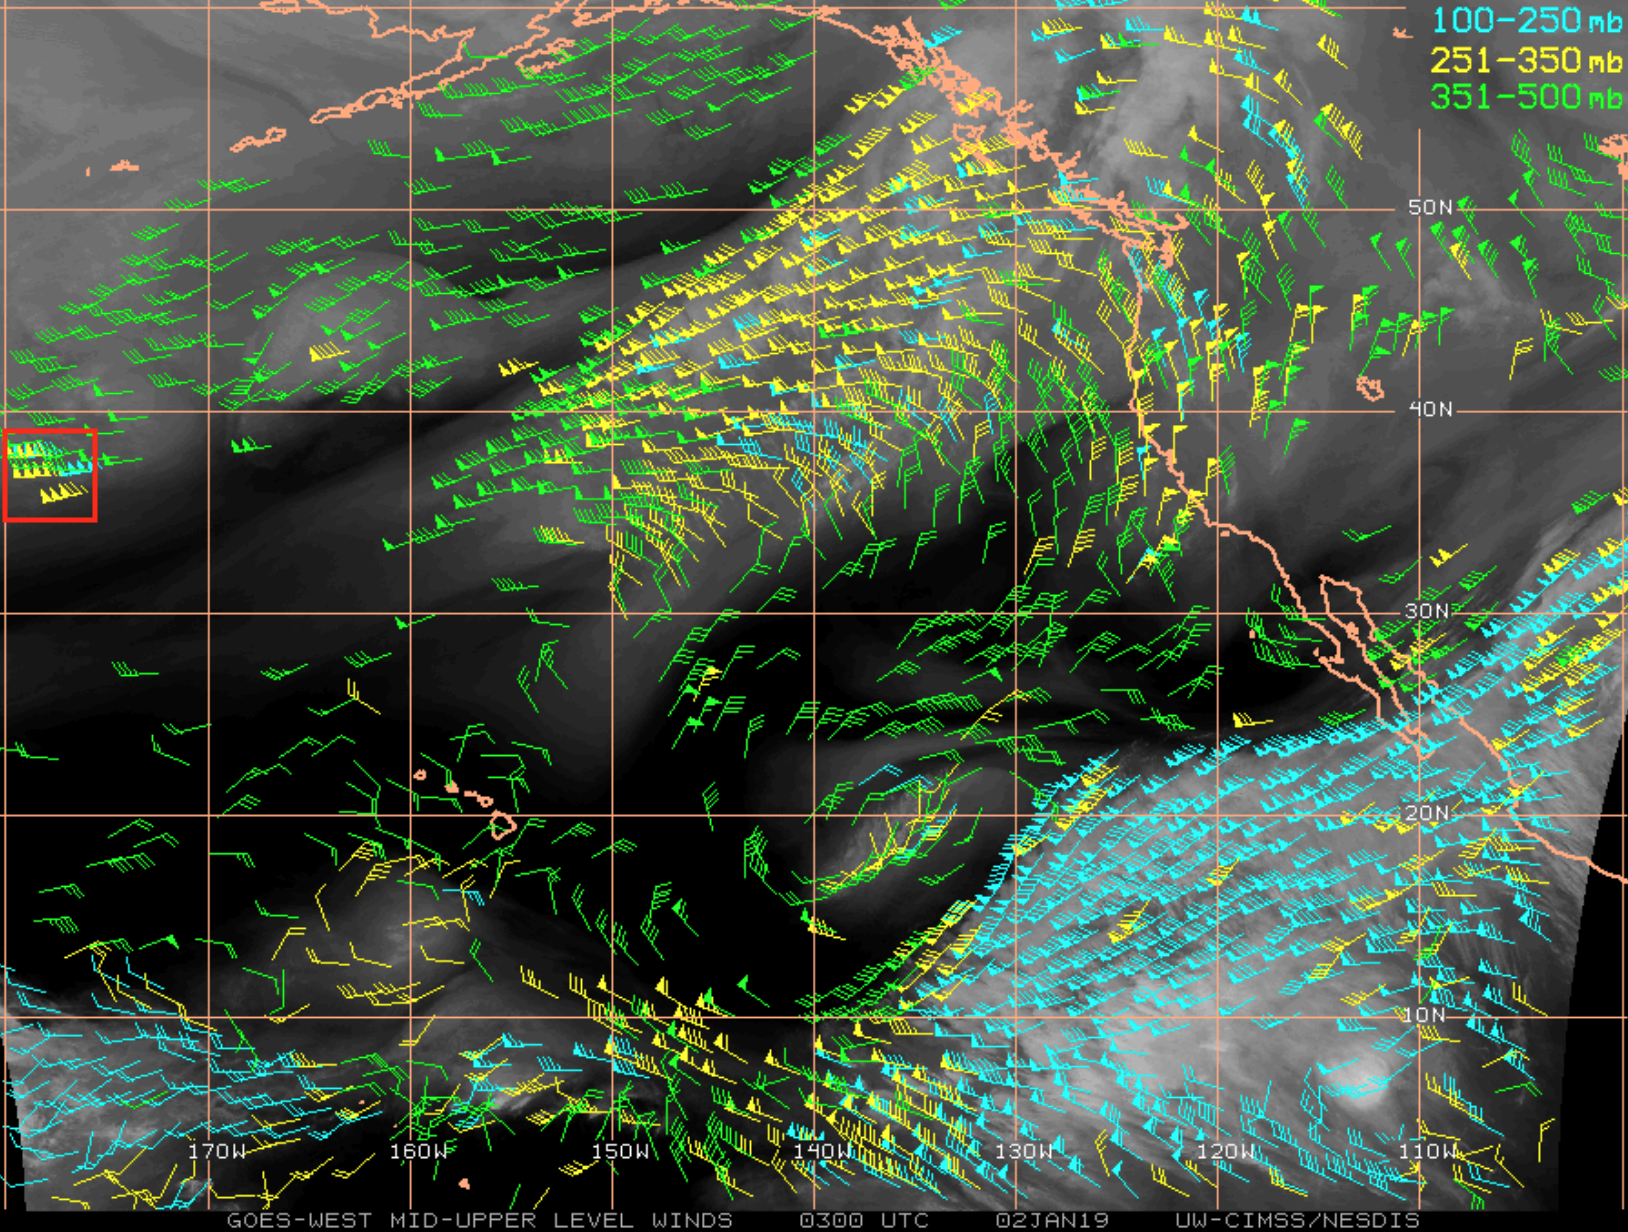
![GOES-15 Water Vapor (6.5 µm) Derived Motion Winds [click to enlarge]](https://cimss.ssec.wisc.edu/satellite-blog/wp-content/uploads/sites/5/2019/01/190102_goes15_waterVapor_winds_North_Pacific_anim.gif)
GOES-15 Water Vapor (6.5 µm) Derived Motion Winds [click to enlarge]