This website works best with a newer web browser such as Chrome, Firefox, Safari or Microsoft
Edge. Internet Explorer is not supported by this website.
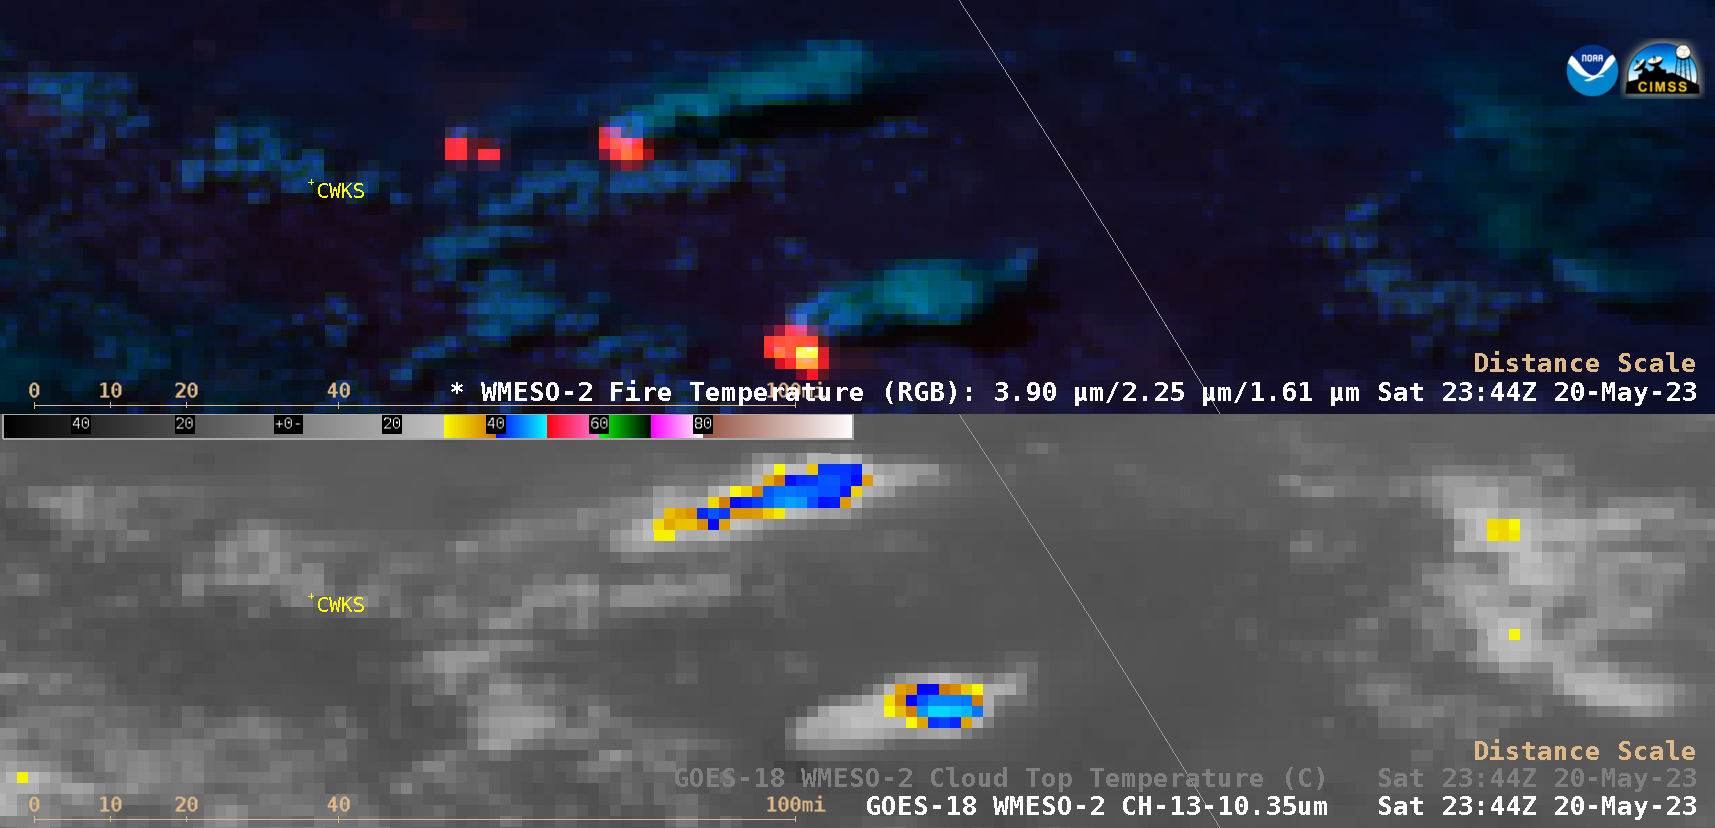
1-minute Mesoscale Domain Sector GOES-18 (GOES-West) Fire Temperature RGB and “Clean” Infrared Window (10.3 µm) images (above) showed the intensification of 3 wildfires in northeast British Columbia on 20 May 2023. Two of the fires produced pyrocumulonimbus (pyroCb) clouds, exhibiting cloud-top 10.3 µm infrared brightness temperatures of -50ºC or colder (shades of red) — which then eventually moved eastward... Read More
GOES-18 Fire Temperature RGB images (top) and “Clean” Infrared Window (10.3 µm) images (bottom) [click to play animated GIF | MP4]
1-minute Mesoscale Domain Sector GOES-18 (GOES-West)Fire Temperature RGB and “Clean” Infrared Window (10.3 µm) images (above) showed the intensification of 3 wildfires in northeast British Columbia on 20 May 2023. Two of the fires produced pyrocumulonimbus (pyroCb) clouds, exhibiting cloud-top 10.3 µm infrared brightness temperatures of -50ºC or colder (shades of red) — which then eventually moved eastward across far northwest Alberta. The southernmost fire continuously exhibited a 3.9 µm infrared brightness temperature of 137.88 K — the saturation temperature of GOES-18 ABI Band 7 detectors — for a period of 70 minutes (from 2240-2350 UTC).
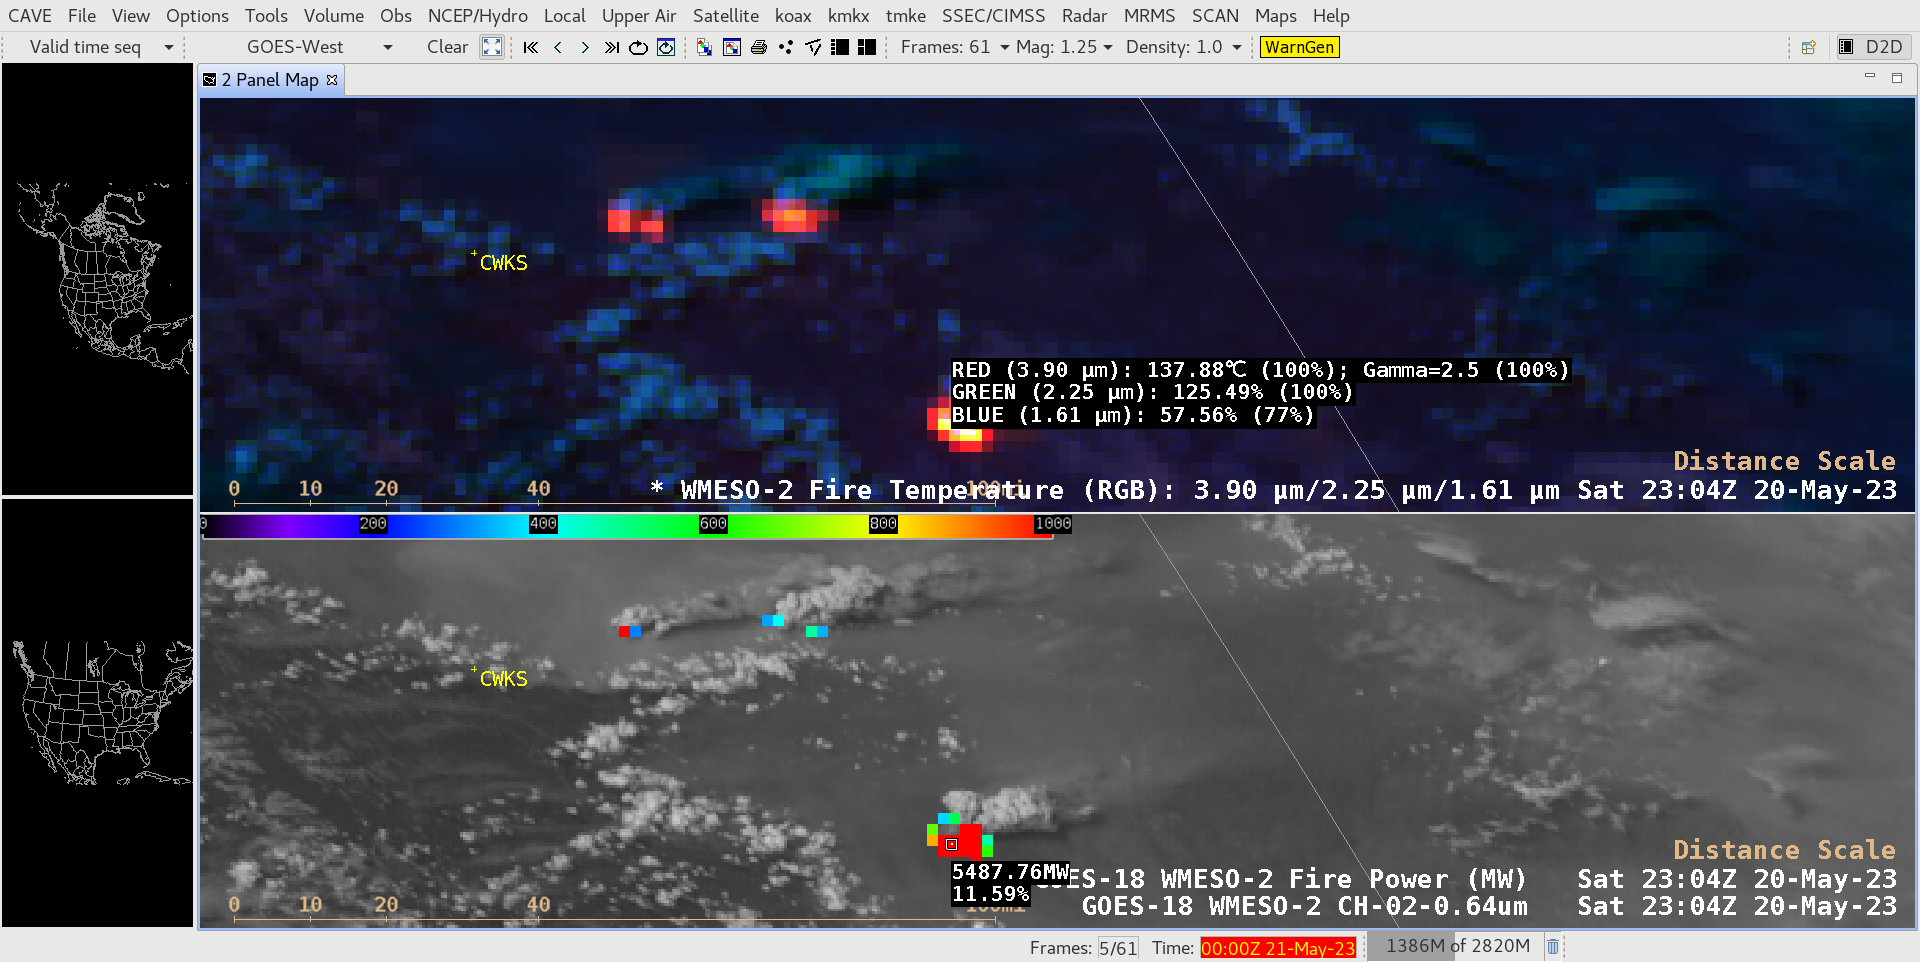
During the time period that the fires were burning very hot and beginning to produce pyroCB clouds, 1-minute GOES-18 Fire Temperature RGB images and “Red” Visible (0.64 µm) images with an overlay of the Fire Power derived product (below) showed that the southernmost fire frequently exhibited Fire Power values in excess of 5000 MW (with a peak of 5487.76 MW at 2304 UTC). The Fire Power derived product is a component of the GOES Fire Detection and Characterization Algorithm (FDCA).
GOES-18 Fire Temperature RGB images (top) and “Red” Visible (0.64 µm) images with an overlay of the Fire Power derived product (bottom) [click to play animated GIF | MP4]
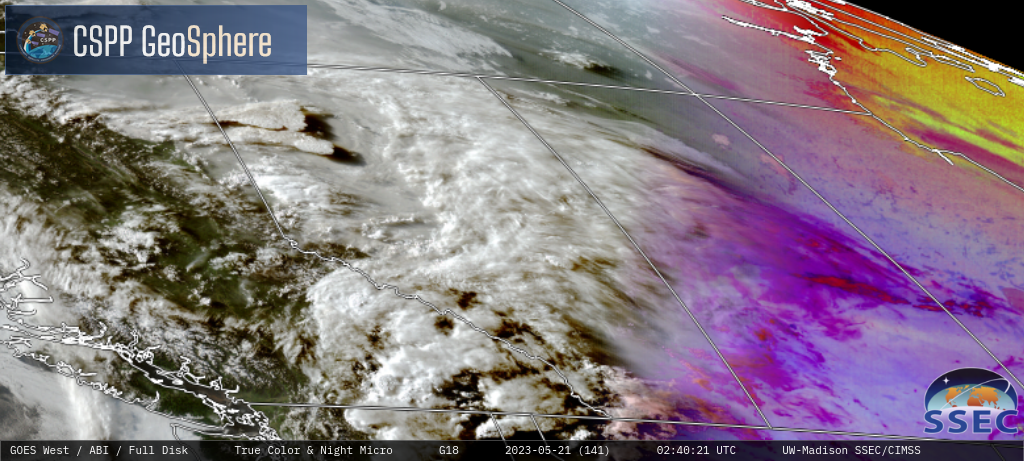
The subsequent motion of the 2 pyroCb anvils was evident in GOES-18 Nighttime Microphysics RGB imagery from the CSPP GeoSphere site (below), as they drifted southeast across Alberta and Saskatchewan.
GOES-18 True Color RGB and Nighttime Microphysics RGB images [click to play MP4 animation]
As West Pacific Tropical Depression 02W — previously discussed in this blog post — intensified to become Tropical Storm Mawar at 1200 UTC on 20 May 2023, 2.5-minute rapid scan JMA Himawari-9 “Clean” Infrared Window (10.4 µm) images (above) showed pulses of cold overshooting tops that frequently exhibited infrared brightness temperatures in the -90... Read More
JMA Himawari-9″Clean” Infrared Window (10.4 µm) images [click to play animated GIF | MP4]
As West Pacific Tropical Depression 02W — previously discussed in this blog post — intensified to become Tropical Storm Mawar at 1200 UTC on 20 May 2023, 2.5-minute rapid scan JMA Himawari-9 “Clean” Infrared Window (10.4 µm) images (above) showed pulses of cold overshooting tops that frequently exhibited infrared brightness temperatures in the -90 to -95ºC range.
Himawari-9 Infrared Window (11.2 µm) images with an overlay of deep-layer wind shear at 1800 UTC from the CIMSS Tropical Cyclones site (below) indicated that Mawar was moving into an environment of lower shear, which favored a trend of continued intensification.
Himawari-9 Infrared Window (11.2 µm) images, with an overlay of deep-layer wind shear at 1800 UTC [click to enlarge]
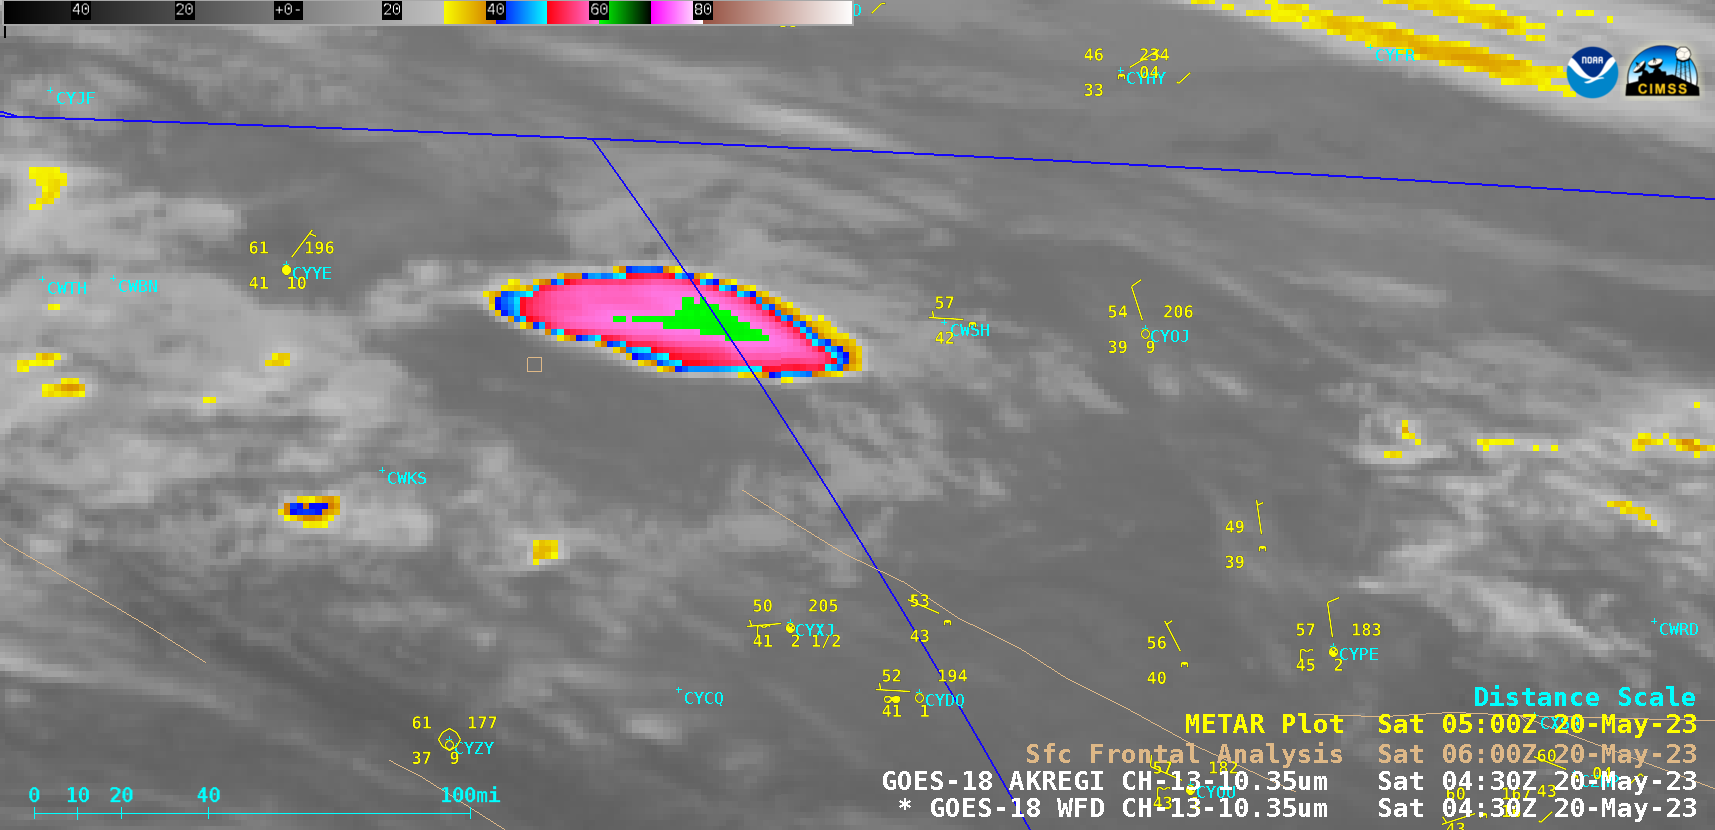
GOES-18 (GOES-West) “Clean” Infrared Window (10.3 µm) images (above) showed the formation of a pyrocumulonimbus (pyroCb) cloud — produced by a wildfire southwest of Fort Nelson, British Columbia (station identifier CYYE) — around 2340 UTC on 19 May 2023. Cloud-top infrared brightness temperatures reached -61ºC as the pyroCb cloud drifted eastward across Alberta.GOES-18 True... Read More
GOES-18 “Clean” Infrared Window (10.3 µm) images [click to play animated GIF | MP4]
GOES-18 (GOES-West) “Clean” Infrared Window (10.3 µm) images (above) showed the formation of a pyrocumulonimbus (pyroCb) cloud — produced by a wildfire southwest of Fort Nelson, British Columbia (station identifier CYYE) — around 2340 UTC on 19 May 2023. Cloud-top infrared brightness temperatures reached -61ºC as the pyroCb cloud drifted eastward across Alberta.
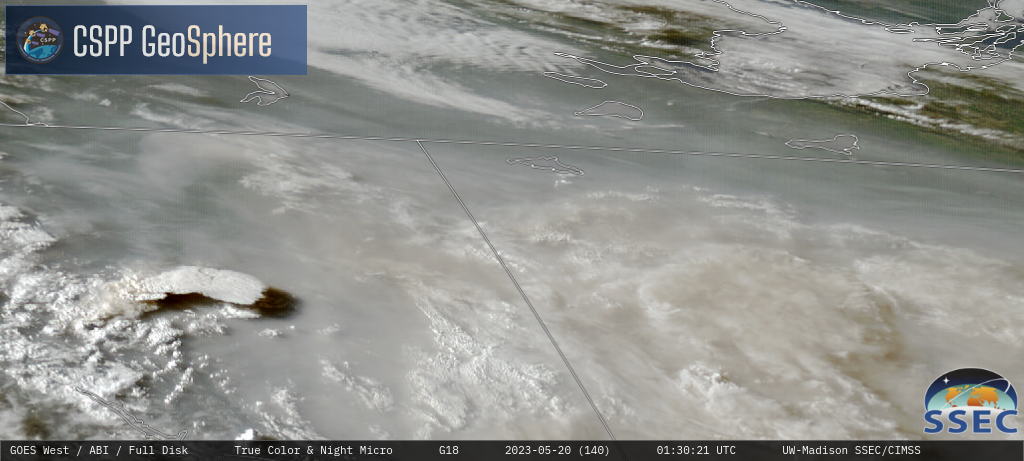
GOES-18 True Color RGB and Nighttime Microphysics RGB images from the CSPP GeoSphere site (below) showed the late-day pyroCb formation and its subsequent eastward motion after sunset.
GOES-18 True Color RGB and Nighttime Microphysics RGB images [click to play MP4 animation]
VIIRS Infrared Window (11.45 µm) images from Suomi-NPP (valid at 0952 UTC) and NOAA-20 (valid at 1042 UTC) are shown below. Cloud-top infrared brightness temperatures were as cold as -63ºC in the NOAA-20 image (which is mislabeled as NPP).
VIIRS Infrared Window (11.45 µm) images from Suomi-NPP (valid at 0952 UTC) and NOAA-20 (valid at 1042 UTC) [click to enlarge]
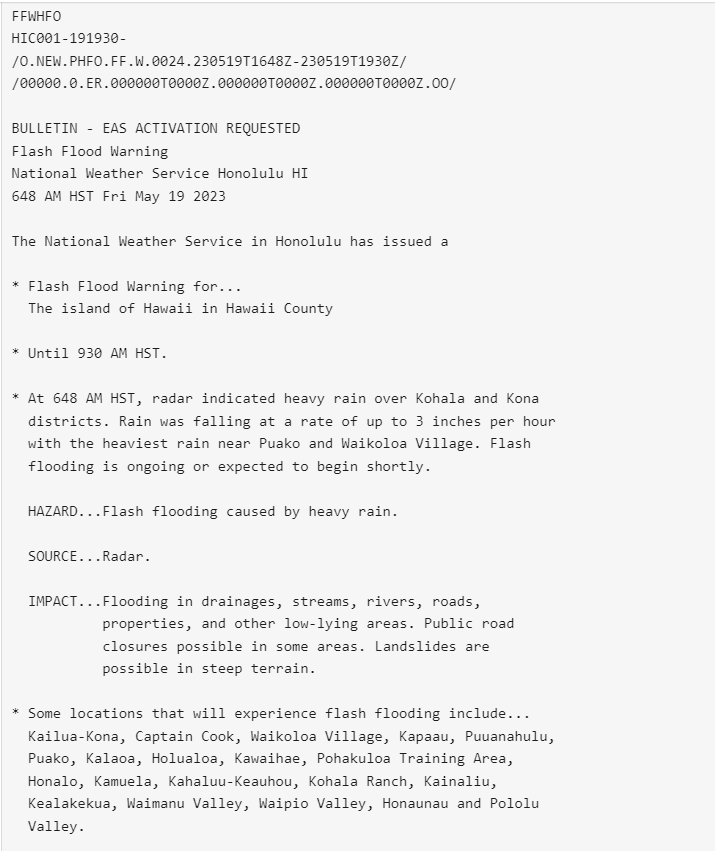
Radar imagery over the island of Hawai’i, below, from 512 – 639 AM HST shows the development of strong thunderstorms over/near Kona. Note that 512 AM HST is 1512 UTC; 639 AM HST is 1639 UTC. The heavy rains led to the issuance of a Flash Flood Warning (link). What... Read More
Radar imagery over the island of Hawai’i, below, from 512 – 639 AM HST shows the development of strong thunderstorms over/near Kona. Note that 512 AM HST is 1512 UTC; 639 AM HST is 1639 UTC. The heavy rains led to the issuance of a Flash Flood Warning (link). What satellite products might have helped with situational awareness in this event?
Radar Reflectivity over Hawai’i, 0512 – 0651 HST on 19 May 2023 (Click to enlarge); animation courtesy Taylor Pechachek, WFO HFO.MIMIC Total Preciptable Water fields, 0000 UTC on 18 May through 2000 UTC on 19 May 2023 (Click to enlarge)
MIMIC Total Precipitable Water fields, below, from 0000 UTC on 18 May through 2000 UTC on 19 May, show moisture throughout the Hawai’ian island chain. The total precipitable water at Hilo increased from 40.2 mm to 44.2 mm from 1200 UTC 18 May to 1200 UTC 19 May (link). Sometimes NUCAPS fields from NOAA-20 can give information about the environment in which convection might develop. On 19 May, however, the islands of Maui and Hawai’i sat in between NOAA-20 overpasses, as shown below, using data from this website (Suomi NPP and NOAA-21 sampled the region, but NUCAPS products are not yet operational from NOAA-21, and an anomaly exists in the CrIS instrument on Suomi NPP). This case demonstrates why two JPSS soundings providing operational data are useful. NUCAPS on this day does give an overview of the large-scale thermodynamics: Cold temperatures at 500 mb and (relatively) warm temperatures at 850 mb highlight reduced stability over the Hawai’ian Island chain.
NUCAPS Quality Flags (Green: Infrared Retrieval converged; Yellow: Microwave Retrieval converged, infrared retrieval failed; Red: Microwave and Infrared retrievals both failed), 850-mb Temperature and 500-mb Temperature from NOAA-20 overpasses at 1026 and 1207 UTC on 19 May 2023 (Click to enlarge)
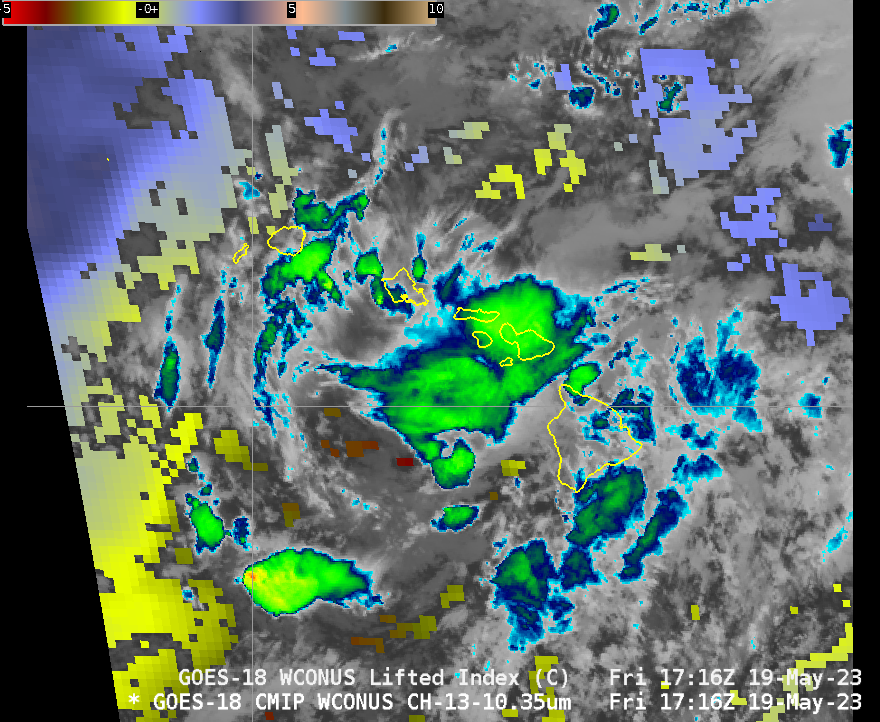
GOES-18 Derived Stability indices — such as Lifted Index, shown below with the default AWIPS enhancement altered so that the range is -5 to 10 — are clear-sky only products. By using animations, however, a user can discern regions where instabilities exist when occasional cloud breaks occur, as shown below. Modest instability (albeit individual pixels!) is diagnosed over the western part of the island of Hawai’i at various times before the outbreak of convection between 1500 and 1600 UTC.
GOES-18 Clean Window (Band 13, 10.3 µm) infrared imagery underlain with Derived Lifted Index fields (values from -5 to 10), 1001 – 2101 UTC on 19 May 2023 (click to enlarge)
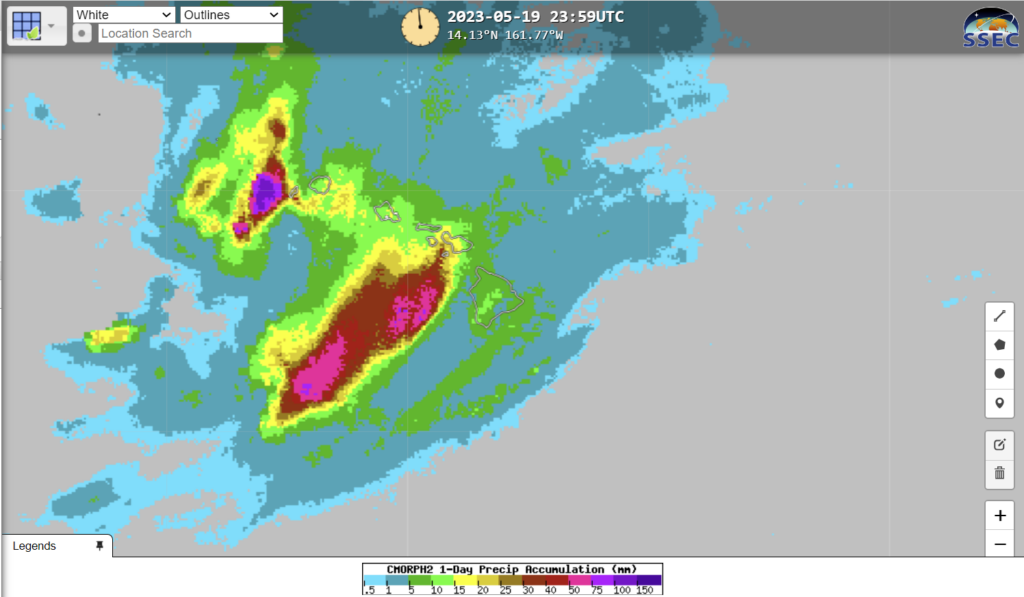
Different websites show quantitative estimates of precipitation. How did they do for this admittedly small-scale event? CMORPH2 precipitation estimates are available at RealEarth (enter ‘CMORPH’ in the Search box at that website) as shown below, and suggest only 5-10 mm on that day with an apparent minimum over Kona.
24-h Precipitation totals (mm) for 19 May 2023 (Click to enlarge)
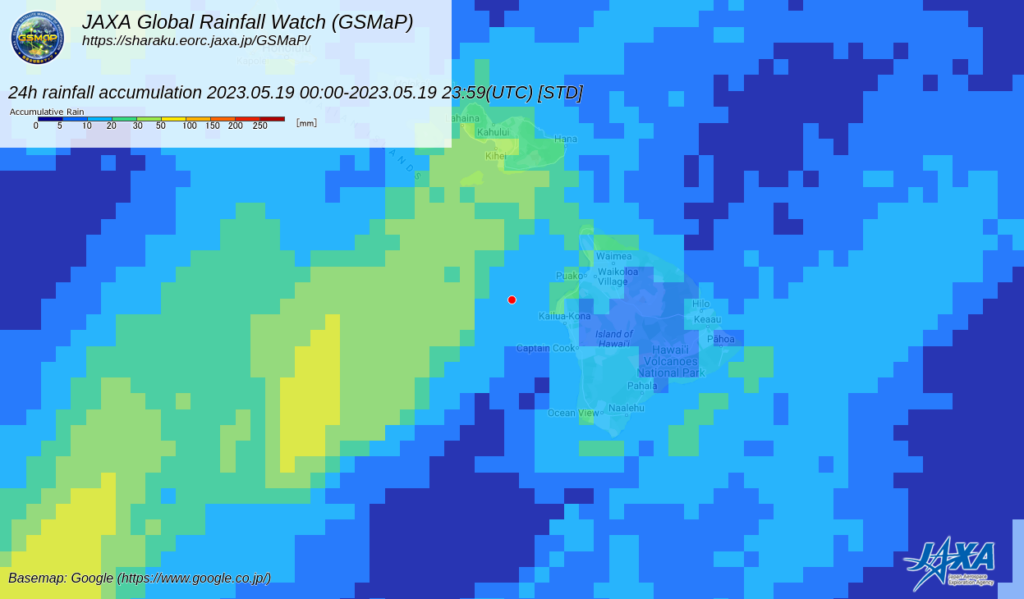
GsMap (from JAXA), shown below, does a bit better with the placement of a maximum over Kona. The values — from 20-30 mm — are too light.
24-h Precipitation for 19 May 2023 (click to enlarge)


