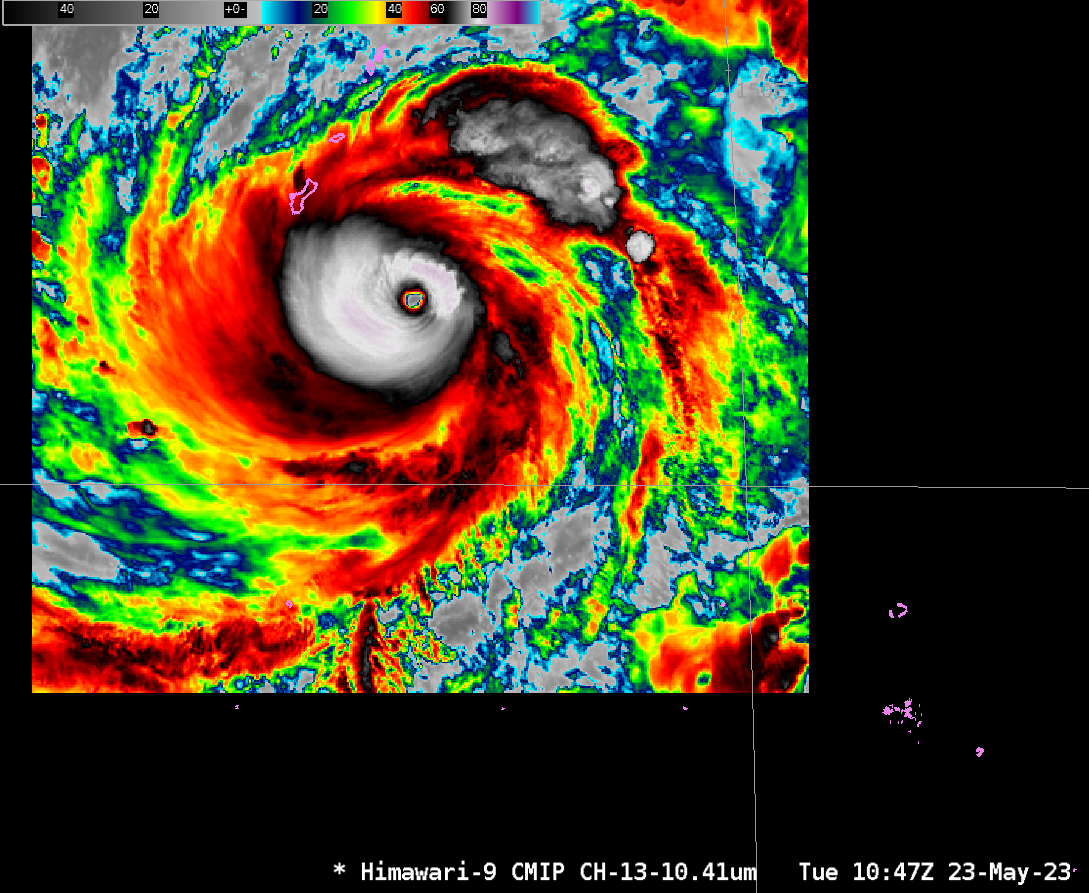
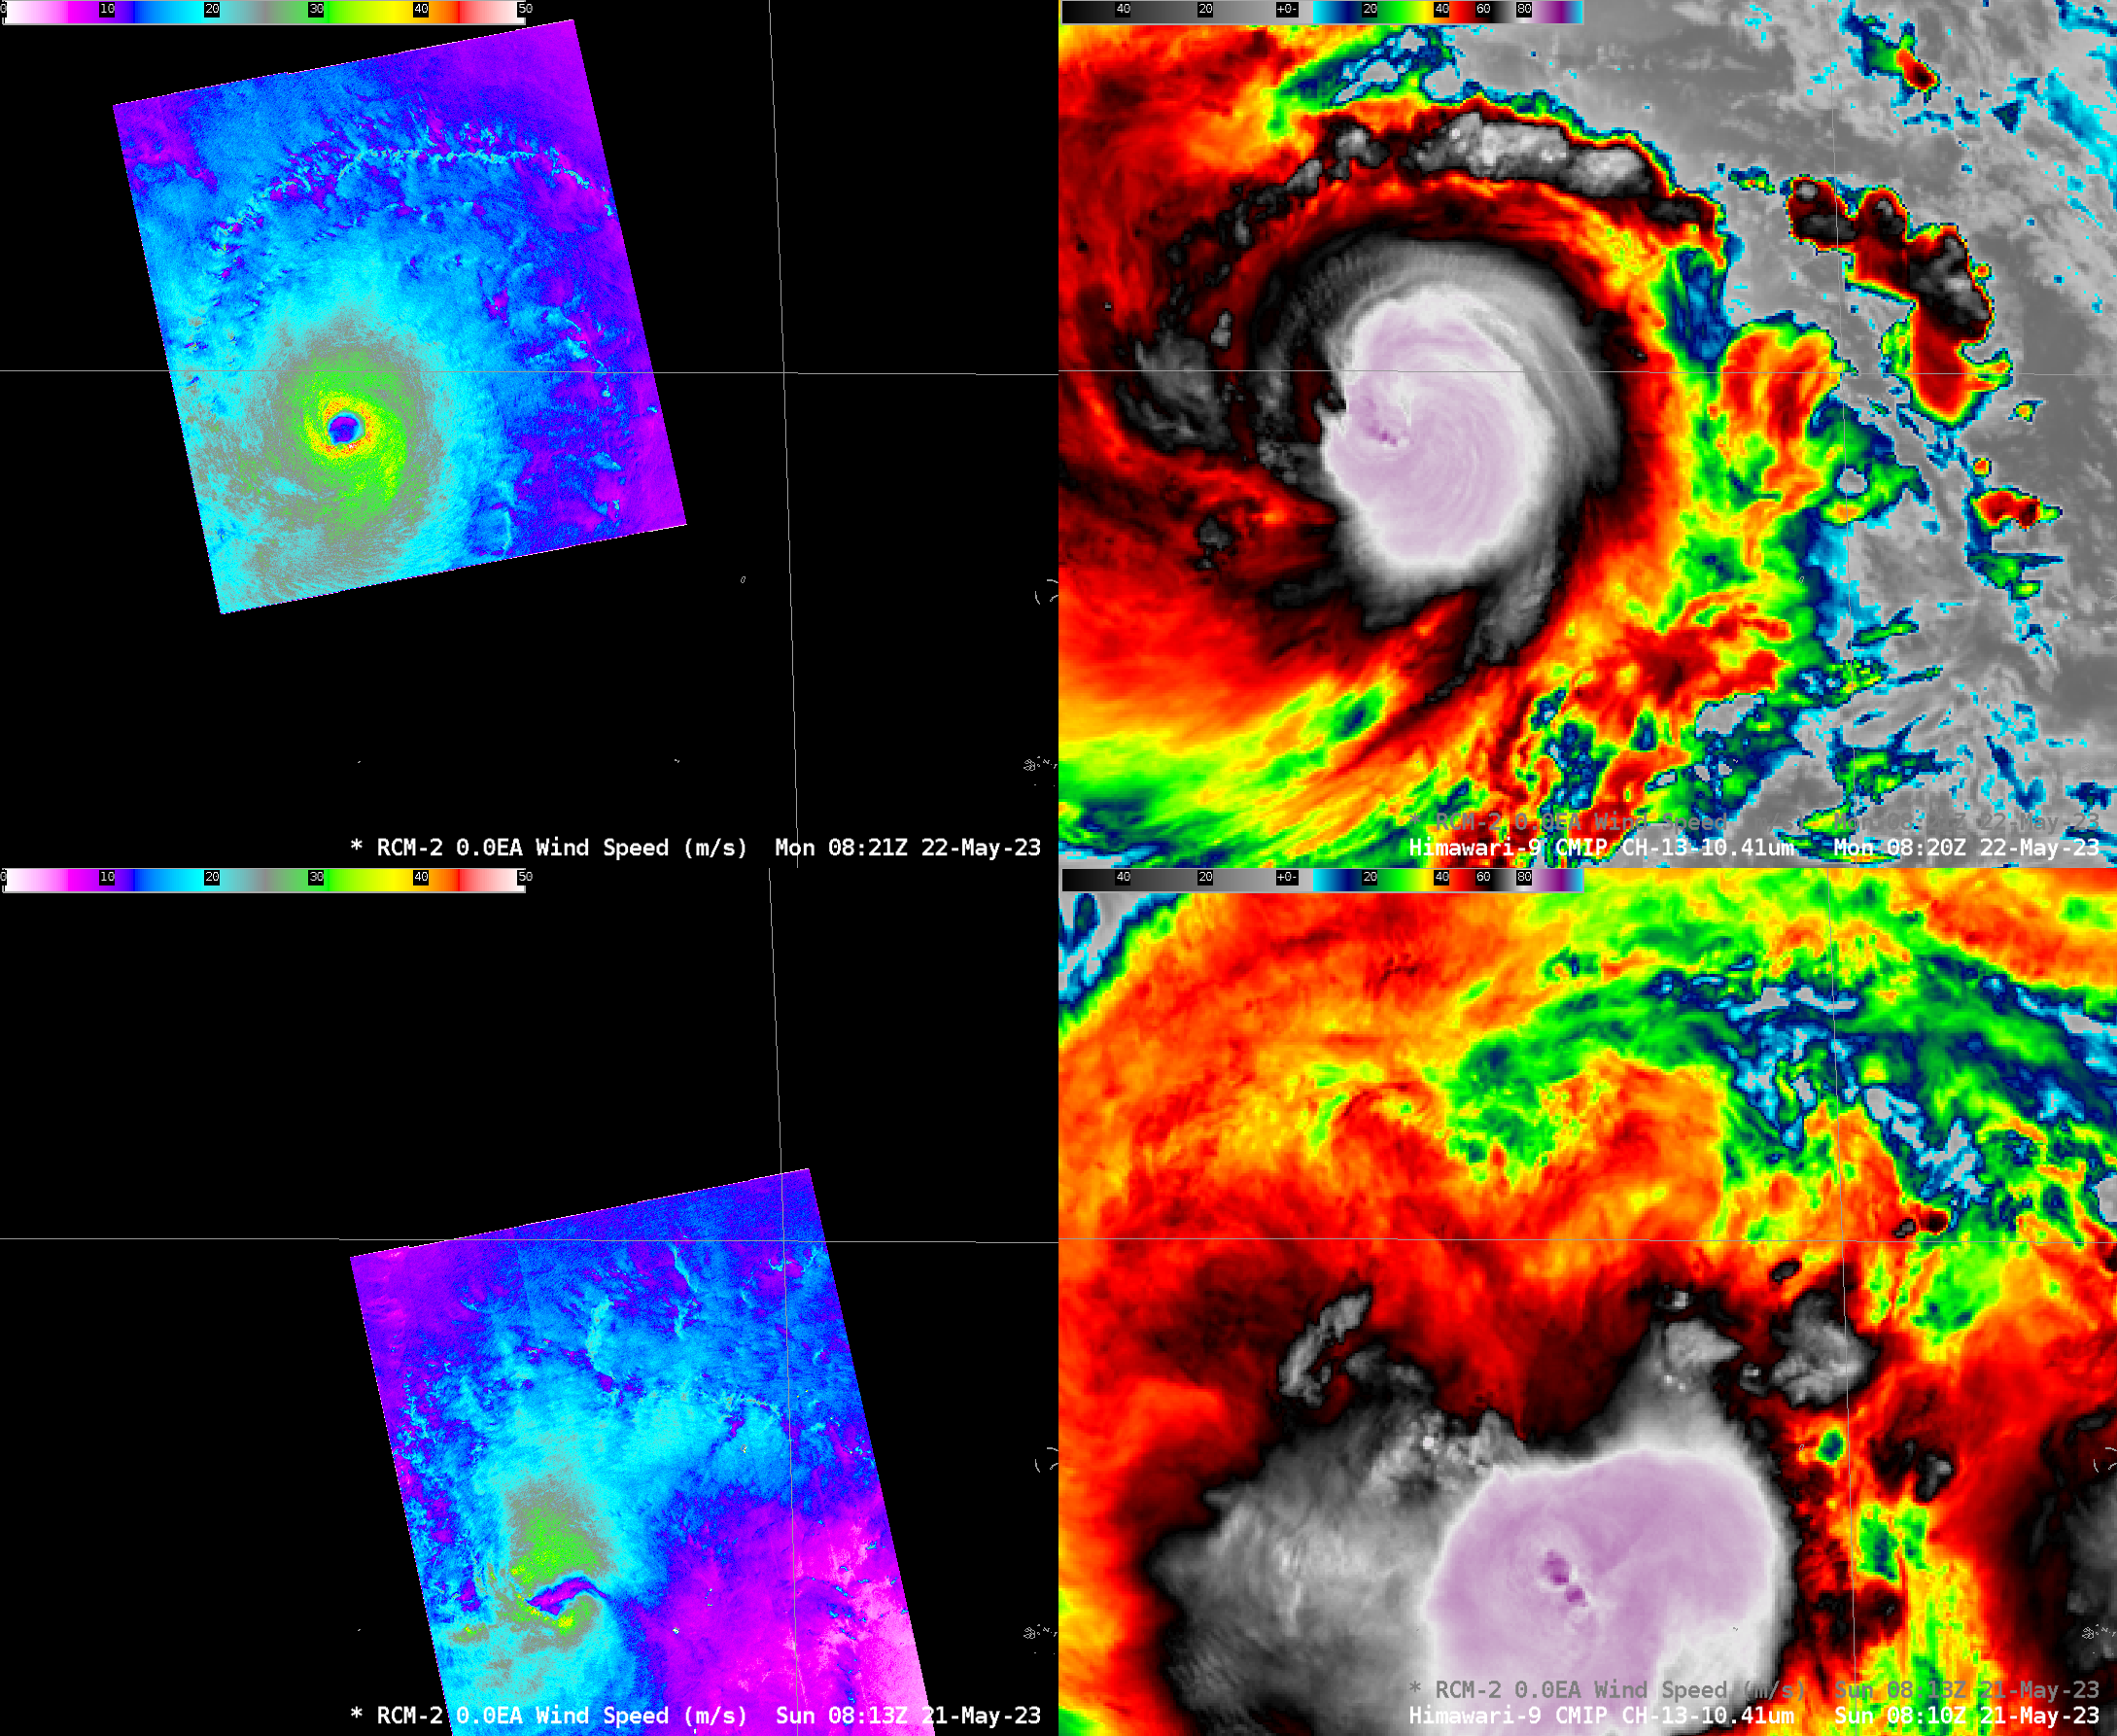
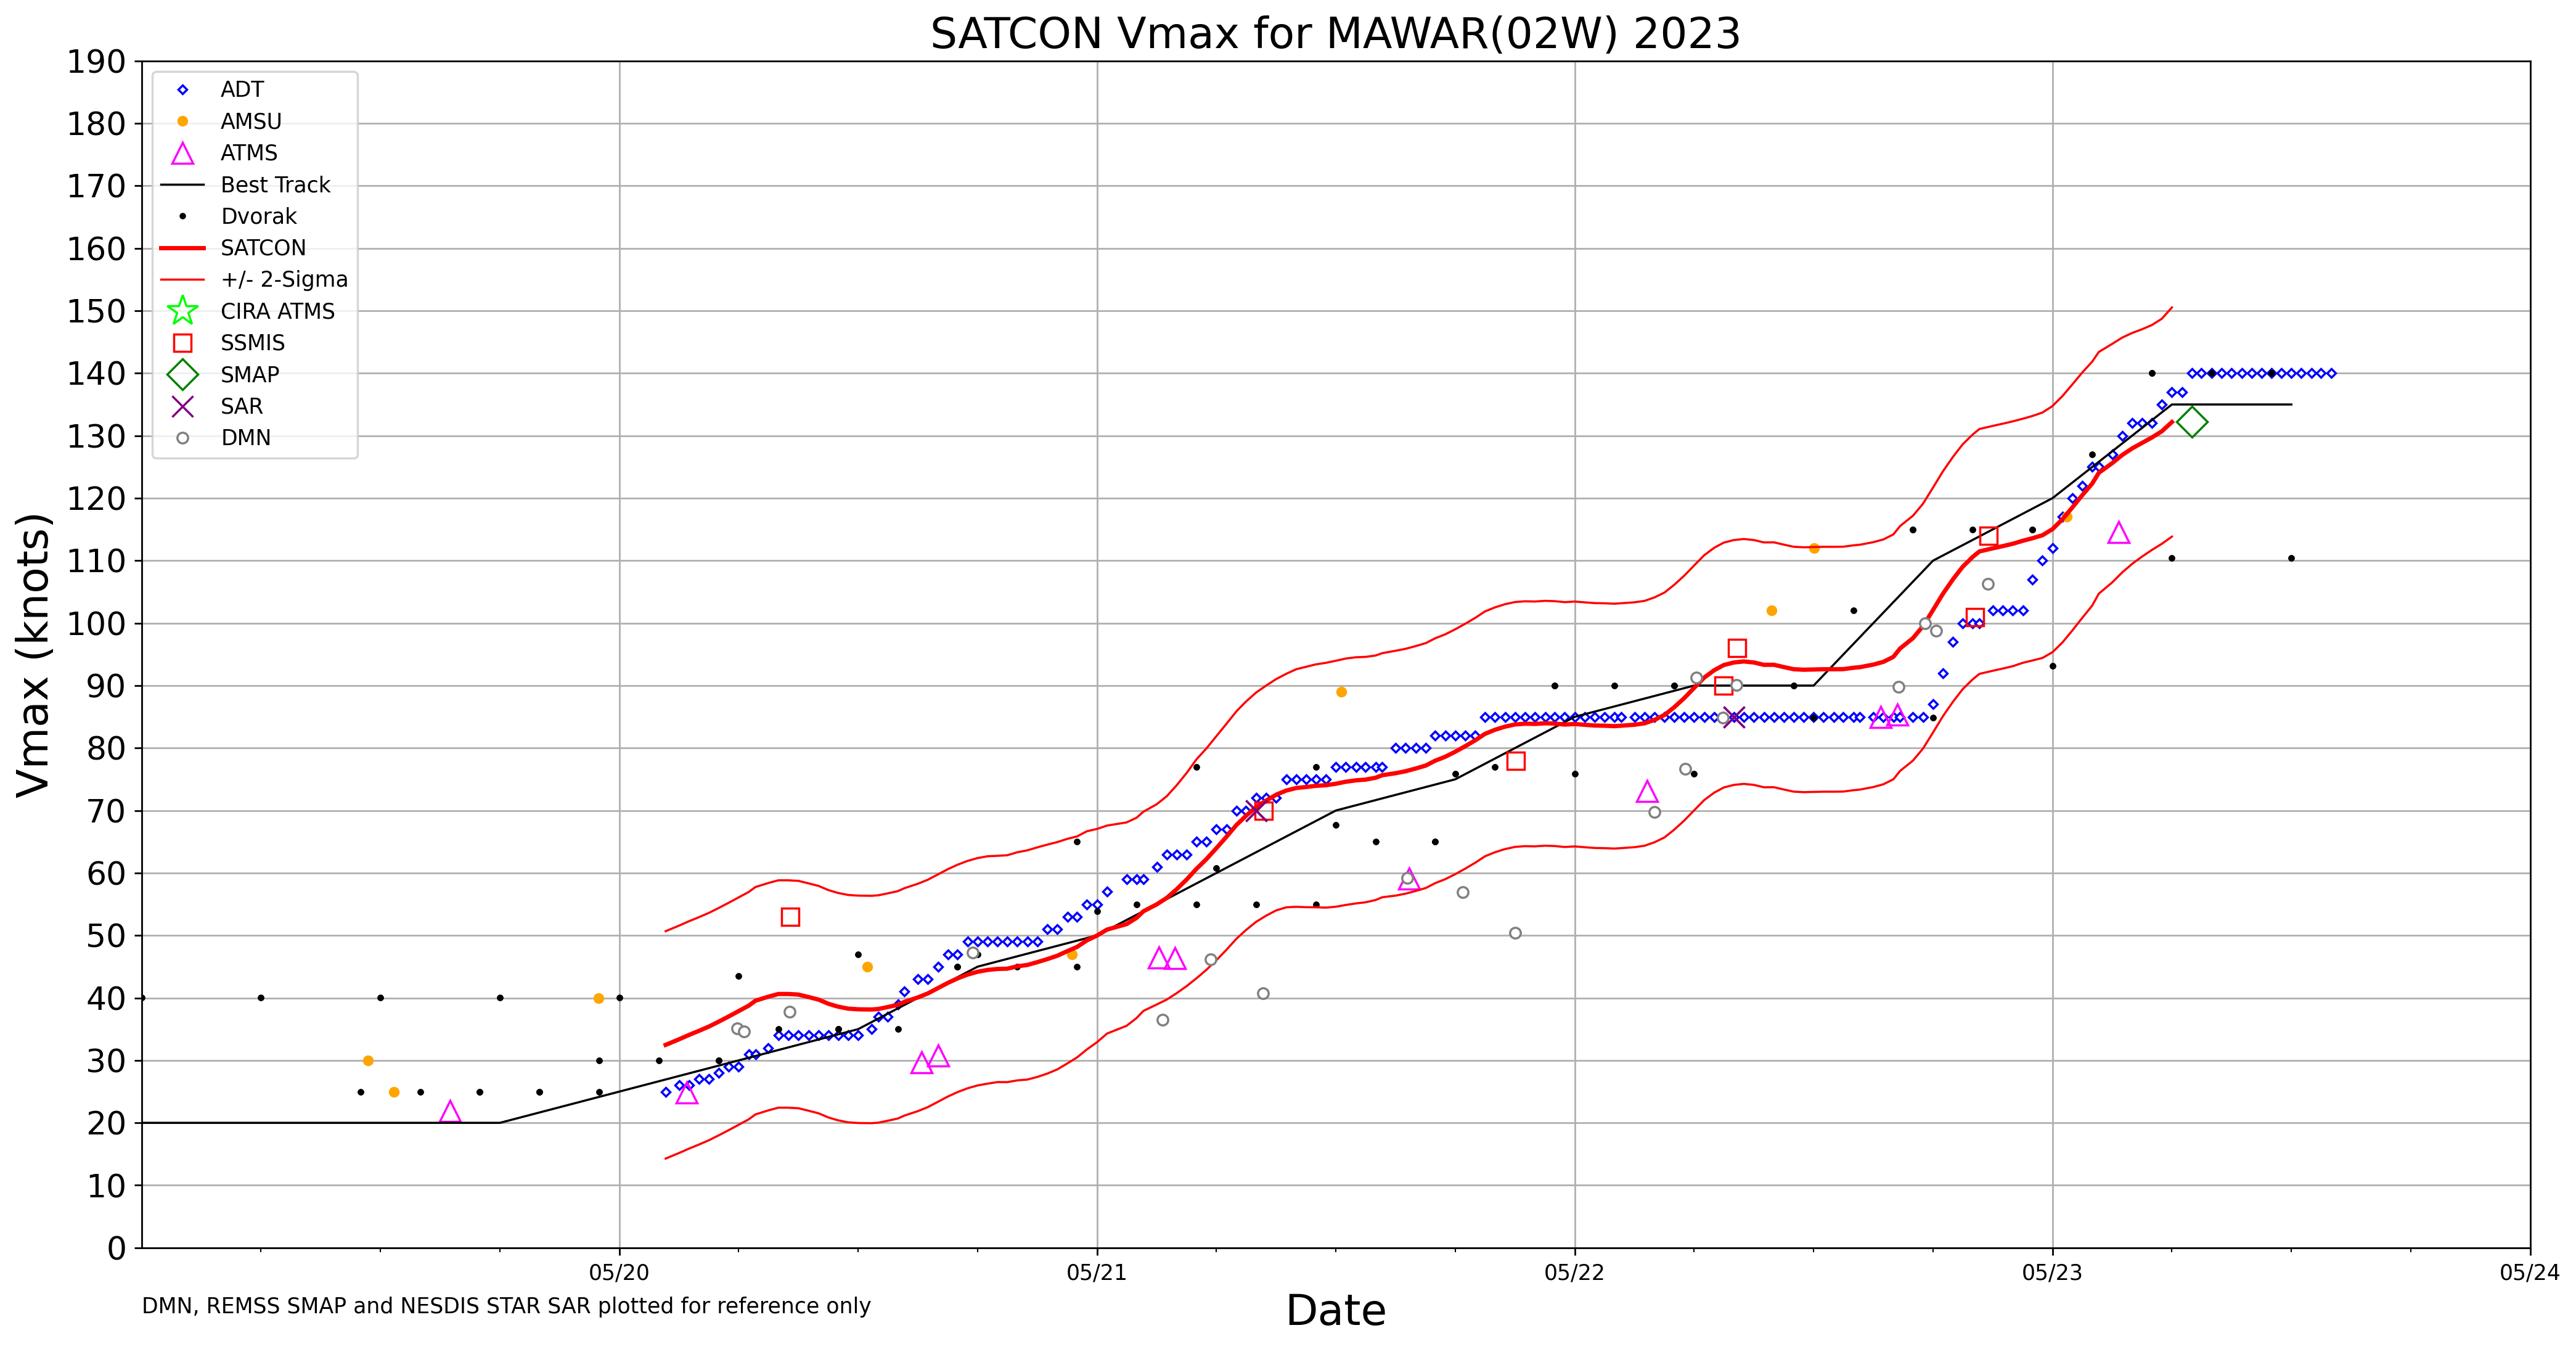
Target Sector (2.5-minute interval) JMA Himawari-9 Visible and Infrared images (above) covered the period when Typhoon Mawar reached Category 4 intensity at 0000 UTC on 23 May 2023 (JTWC advisory | SATCON | ADT). Mesovortices within the eye were evident in the Visible imagery, and cloud-top infrared brightness temperatures surrounding the eye were... Read More

JMA Himawari-9 “Red” Visible (0.64 µm, left) and “Clean” Infrared Window (10.4 µm, right) images, from 2222 UTC on 22 May to 0502 UTC on 23 May [click to play animated GIF | MP4]
(2.5-minute interval)
JMA Himawari-9 Visible and Infrared images
(above) covered the period when Typhoon Mawar reached
Category 4 intensity at 0000 UTC on 23 May 2023 (
JTWC advisory |
SATCON |
ADT). Mesovortices within the eye were evident in the Visible imagery, and cloud-top infrared brightness temperatures surrounding the eye were frequently -80ºC or colder (shades of violet).
A Suomi-NPP VIIRS Day/Night Band (0.7 µm) image valid at 0320 UTC on 23 May (below) showed a larger-scale view of Typhoon Mawar as it was centered about 200 miles southeast of Guam.
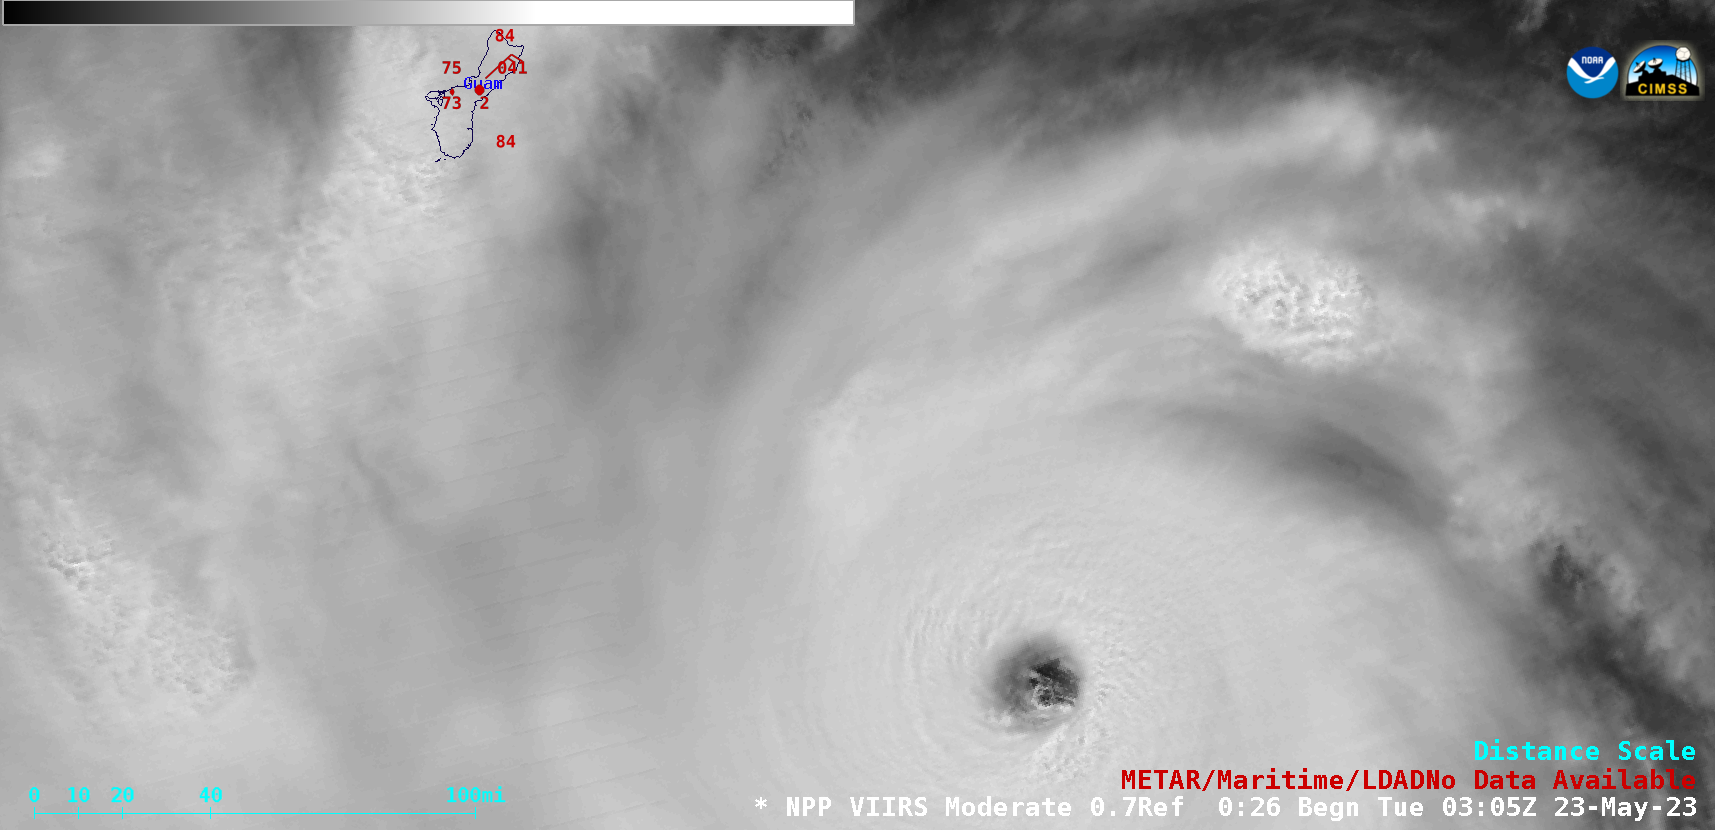
Suomi-NPP VIIRS Day/Night Band (0.7 µm) image, valid at 0320 UTC on 23 May [click to enlarge]
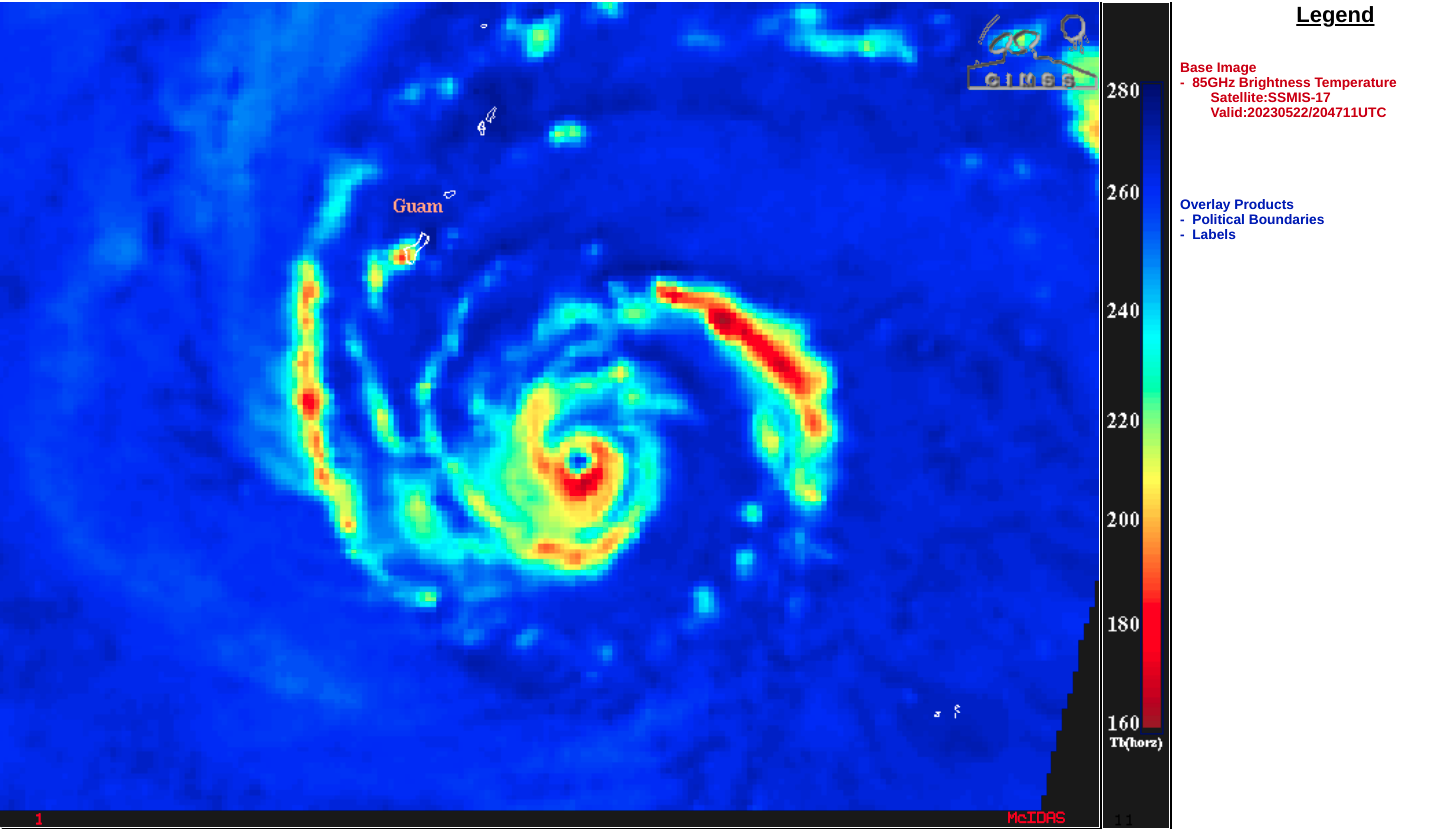
DMSP-17 SSMIS Microwave (85 GHz) image [click to enlarge]
A few hours prior to reaching Category 4 intensity, a DMSP-17 SSMIS Microwave (85 GHz) image at 2047 UTC on 22 May
(above) revealed a small eye, with spiral bands wrapping into the storm center. An ATMS Microwave (183 GHz) image at 0319 UTC on 23 May
(below) showed Mawar a few hours after it reached Category 4 intensity.
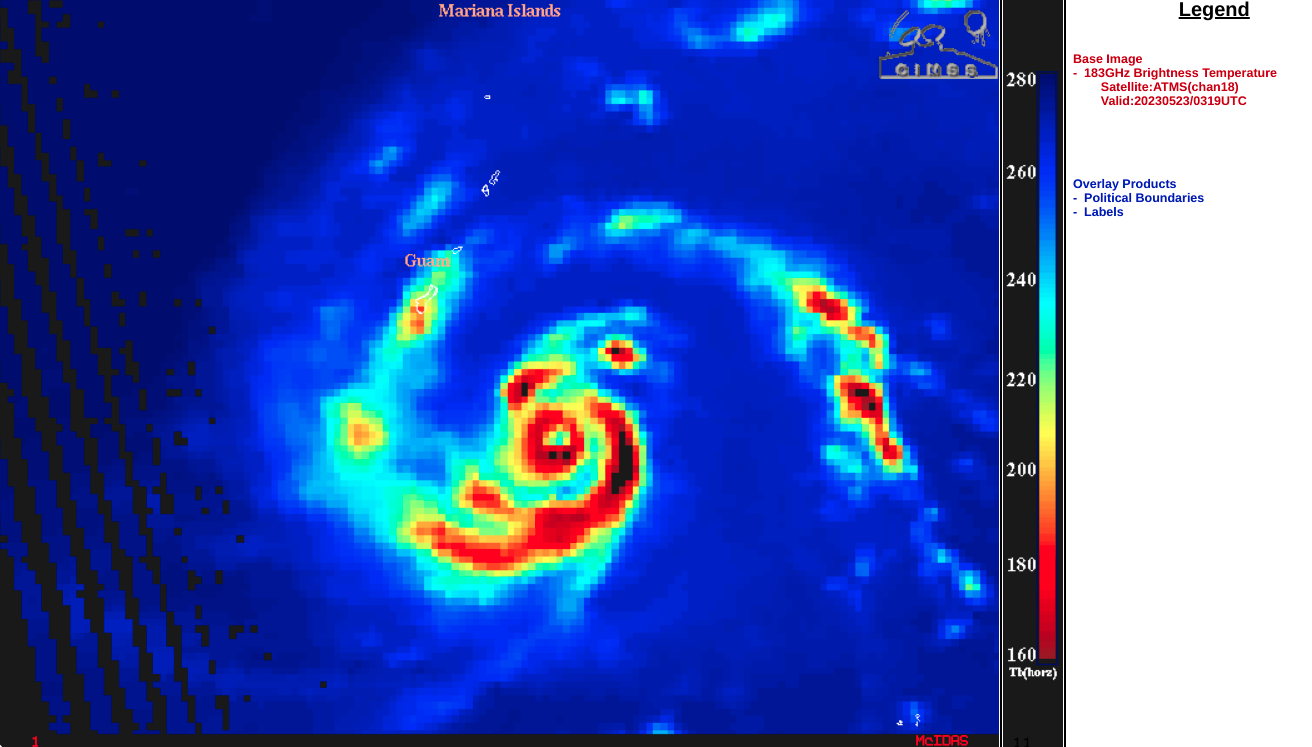
ATMS Microwave (183 GHz) image at 0319 UTC on 23 May [click to enlarge]
Himawari-9 Infrared Window (11.2 µm) images with an overlay of
deep-layer wind shear at 0000 UTC from the
CIMSS Tropical Cyclones site
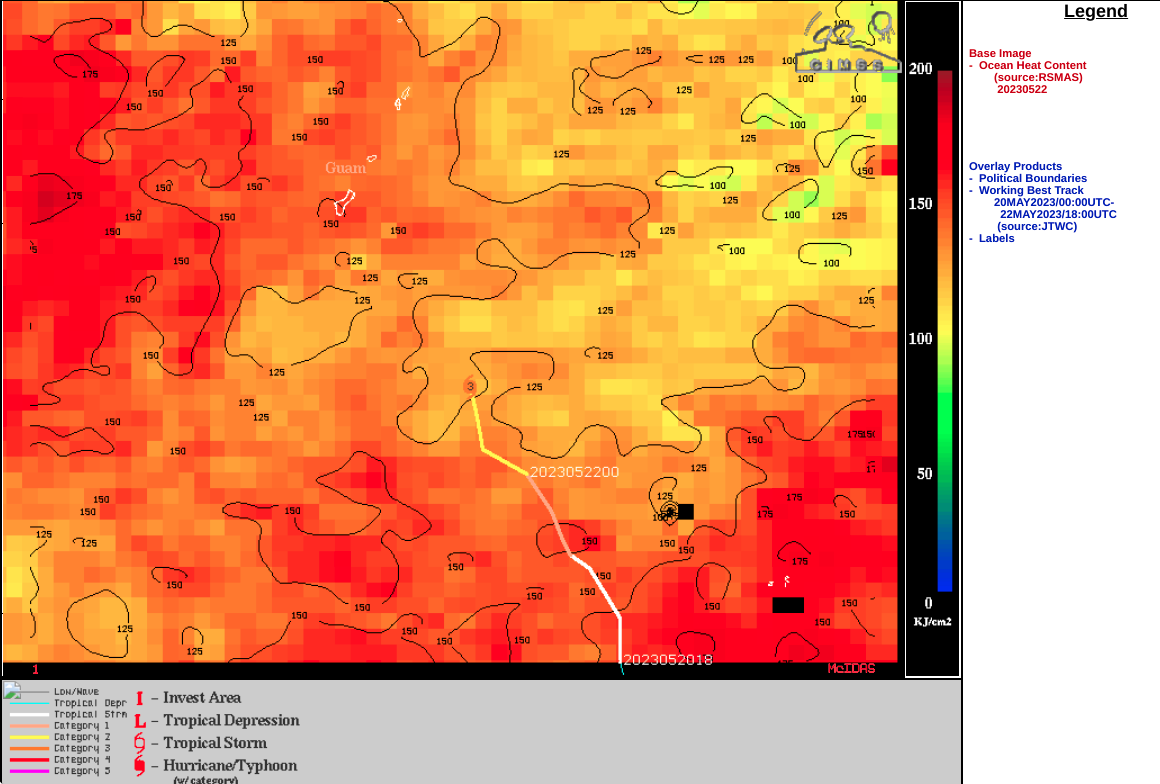
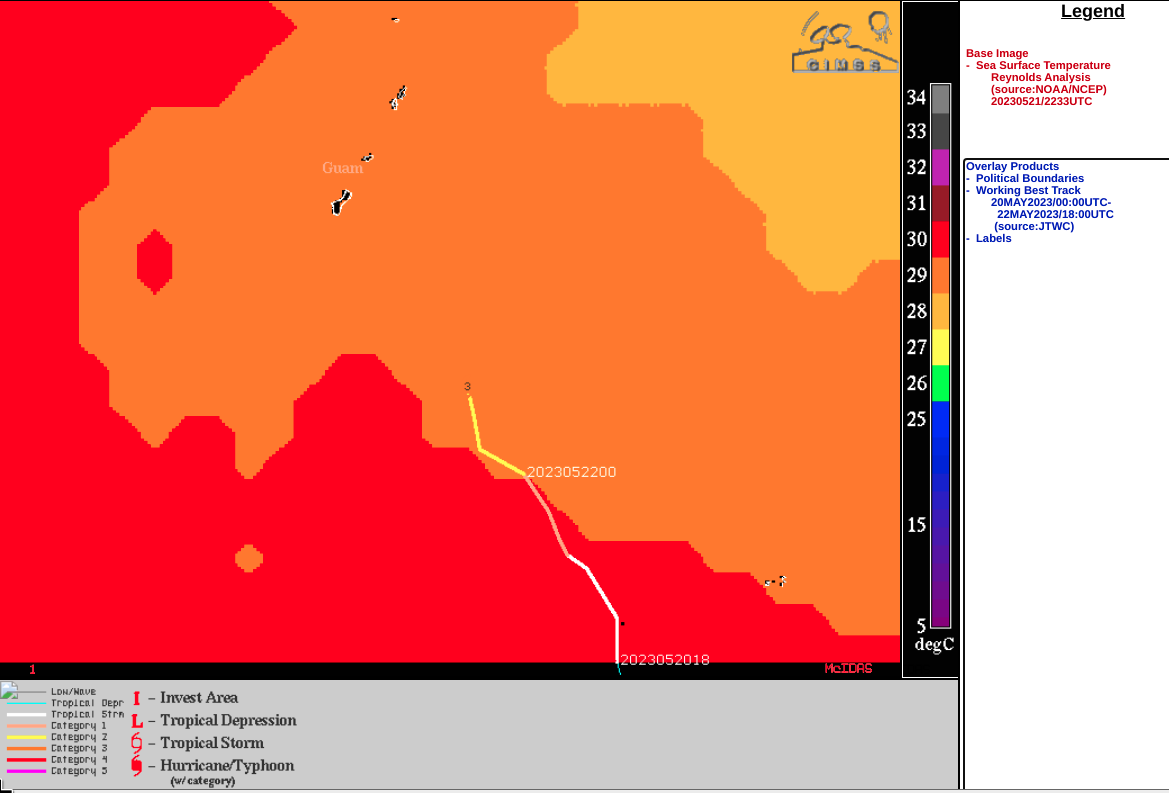
(below) indicated that Mawar was moving through an environment where the shear gradient was large (but likely decreasing along the storm’s northwestward path). Aiding intensification was the fact that Mawar was traversing very warm water (
Ocean Heat Content |
Sea Surface Temperature).
Himawari-9 Infrared Window (11.2 µm) images, with an overlay of deep-layer wind shear at 0000 UTC [click to enlarge]
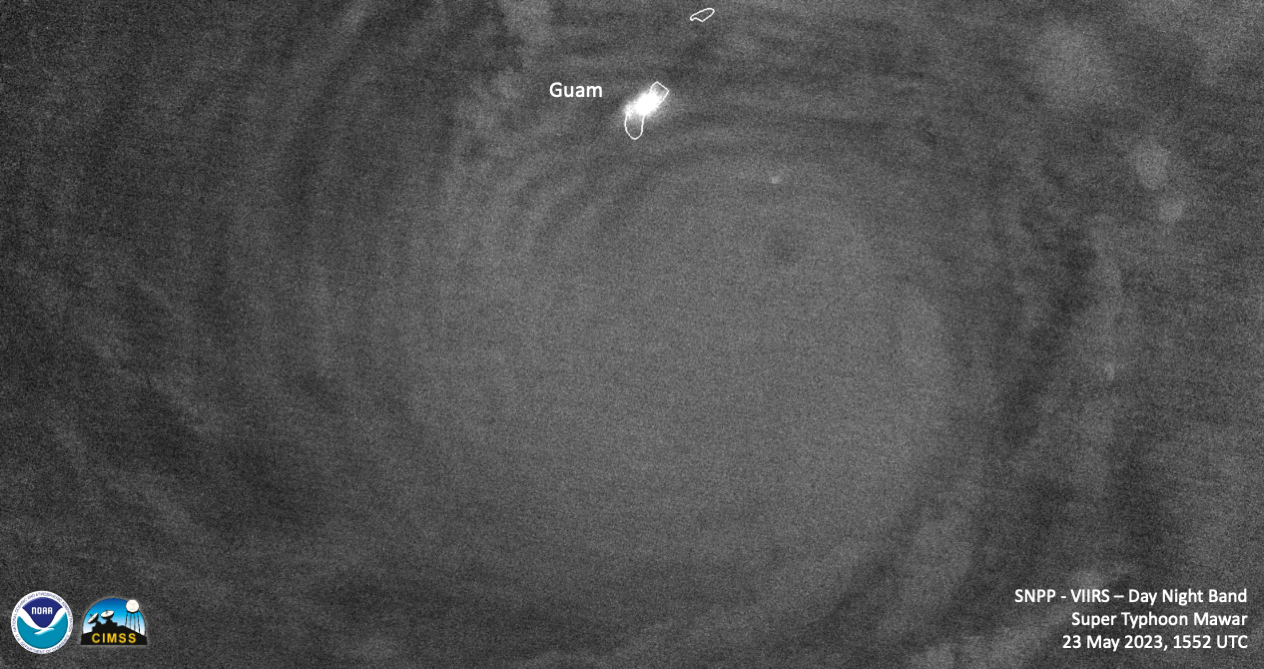
Several hours after sunset, a Suomi-NPP VIIRS Day/Night Band (0.7 µm) image valid at 1554 UTC on 23 May
(below) revealed mesospheric airglow waves (
reference) radiating westward through northward away from Mawar (whose eye was located less than 100 miles southeast of Guam, PGUM, at the time of the image). These vertically-propagating gravity waves were generated by deep convection within Mawar’s eyewall.
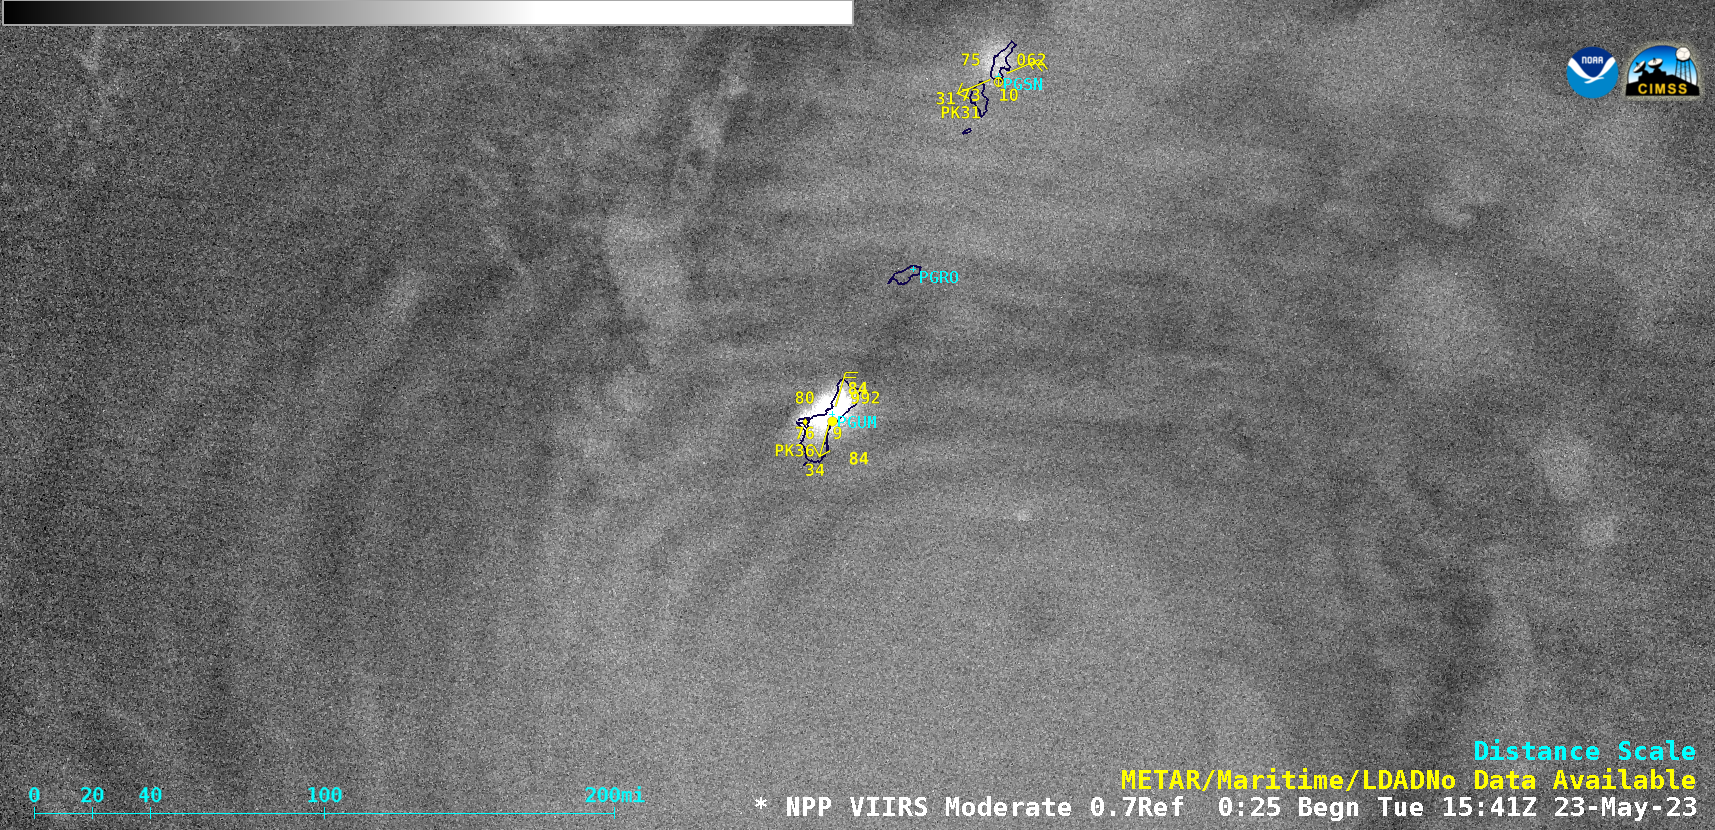
Suomi-NPP VIIRS Day/Night Band (0.7 µm) image, valid at 1554 UTC on 23 May [click to enlarge]
View only this post
Read Less

