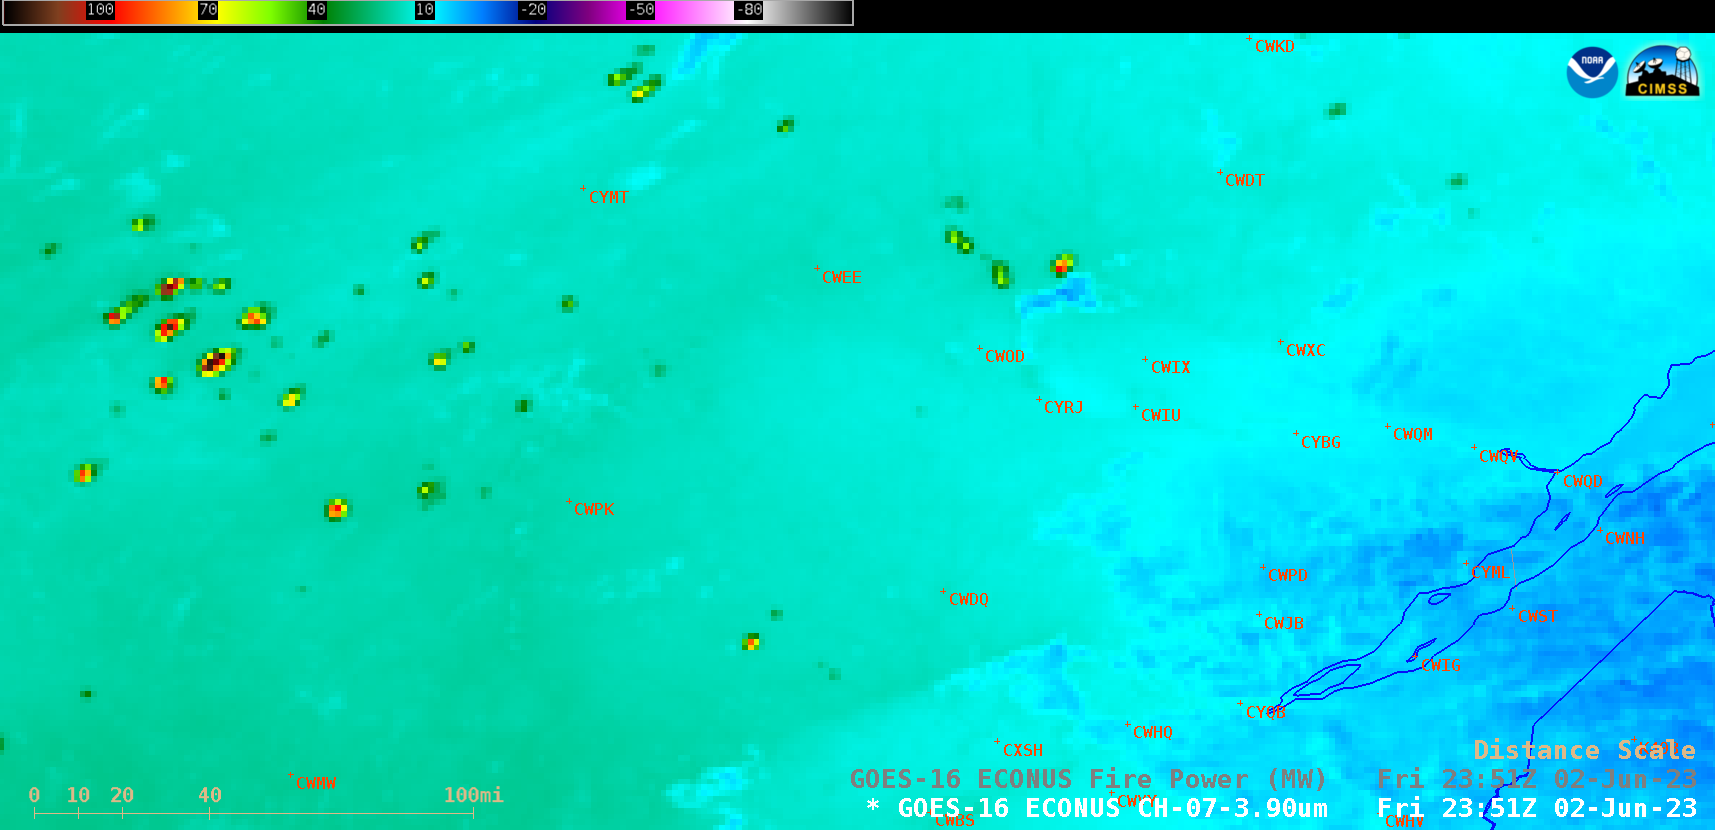
GOES-16 (GOES-East) Shortwave Infrared (3.9 µm) images (above) showed the diurnal variability of thermal anomalies (hot pixels) associated with a cluster of wildfires in southern Quebec during the 02 June – 04 June 2023 period. On the first of these 3 days, several of the wind-driven fires exhibited 3.9 µm brightness temperatures of 137.71ºC... Read More

GOES-16 Shortwave Infrared (3.9 µm) images, 02-04 June [click to play animated GIF | MP4]
GOES-16
(GOES-East) Shortwave Infrared (
3.9 µm) images
(above) showed the diurnal variability of thermal anomalies (hot pixels) associated with a cluster of wildfires in southern Quebec during the
02 June –
04 June 2023 period. On the first of these 3 days, several of the wind-driven fires exhibited 3.9 µm brightness temperatures of 137.71ºC (the saturation temperature of the GOES-16
ABI Band 7 detectors).
The GOES-16 Fire Power derived product during that same 3-day period is shown below — the hottest fires exhibited Fire Power values as high as 3600 MW. The Fire Power derived product is a component of the GOES Fire Detection and Characterization Algorithm (FDCA).
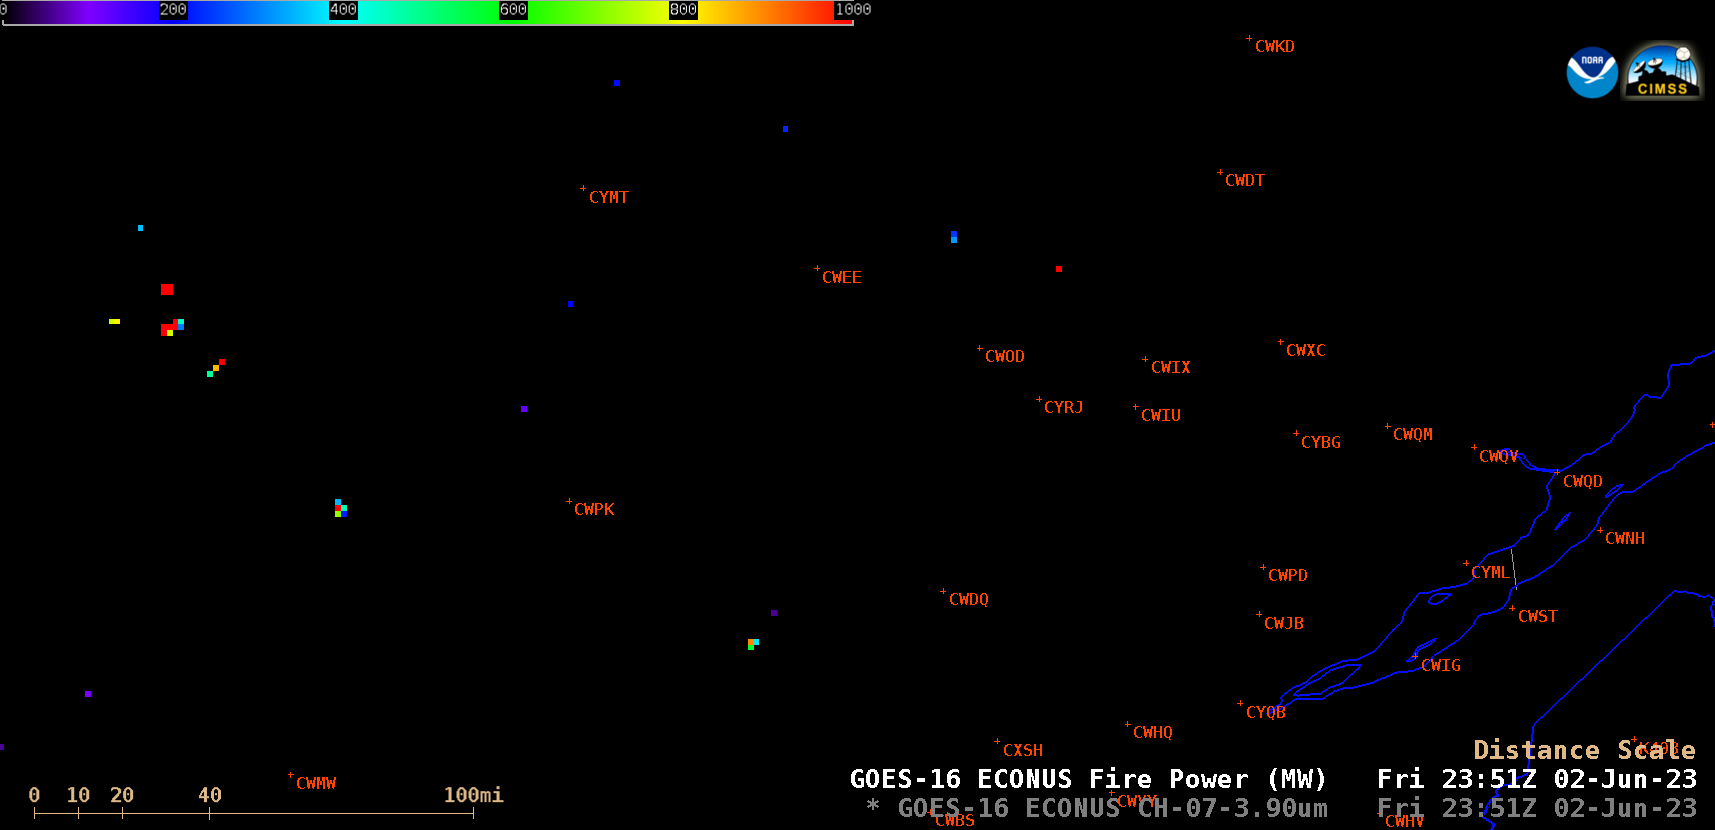
GOES-16 Fire Power derived product, 02-04 June [click to play animated GIF | MP4]
In a larger-scale view of GOES-16 True Color RGB images and
Nighttime Microphysics RGB images from the
CSPP GeoSphere site
(below), dense wildfire smoke plumes (along with their long-range transport paths over parts of the northern US) were evident during the daytime hours, while the fire thermal anomalies (darker shades of purple) were apparent at night.
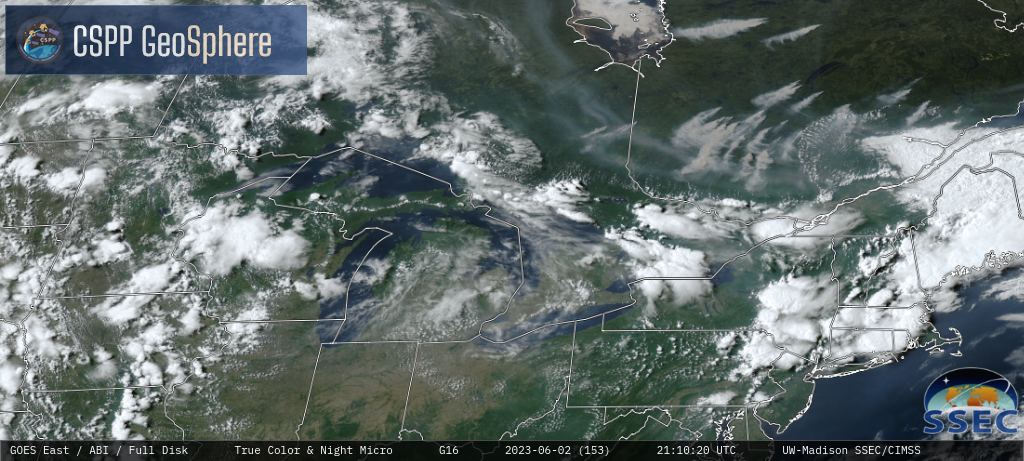
GOES-16 True Color RGB images + Nighttime Microphysics RGB images, 02-04 June [click to play MP4 animation]
===== 05 June Update =====
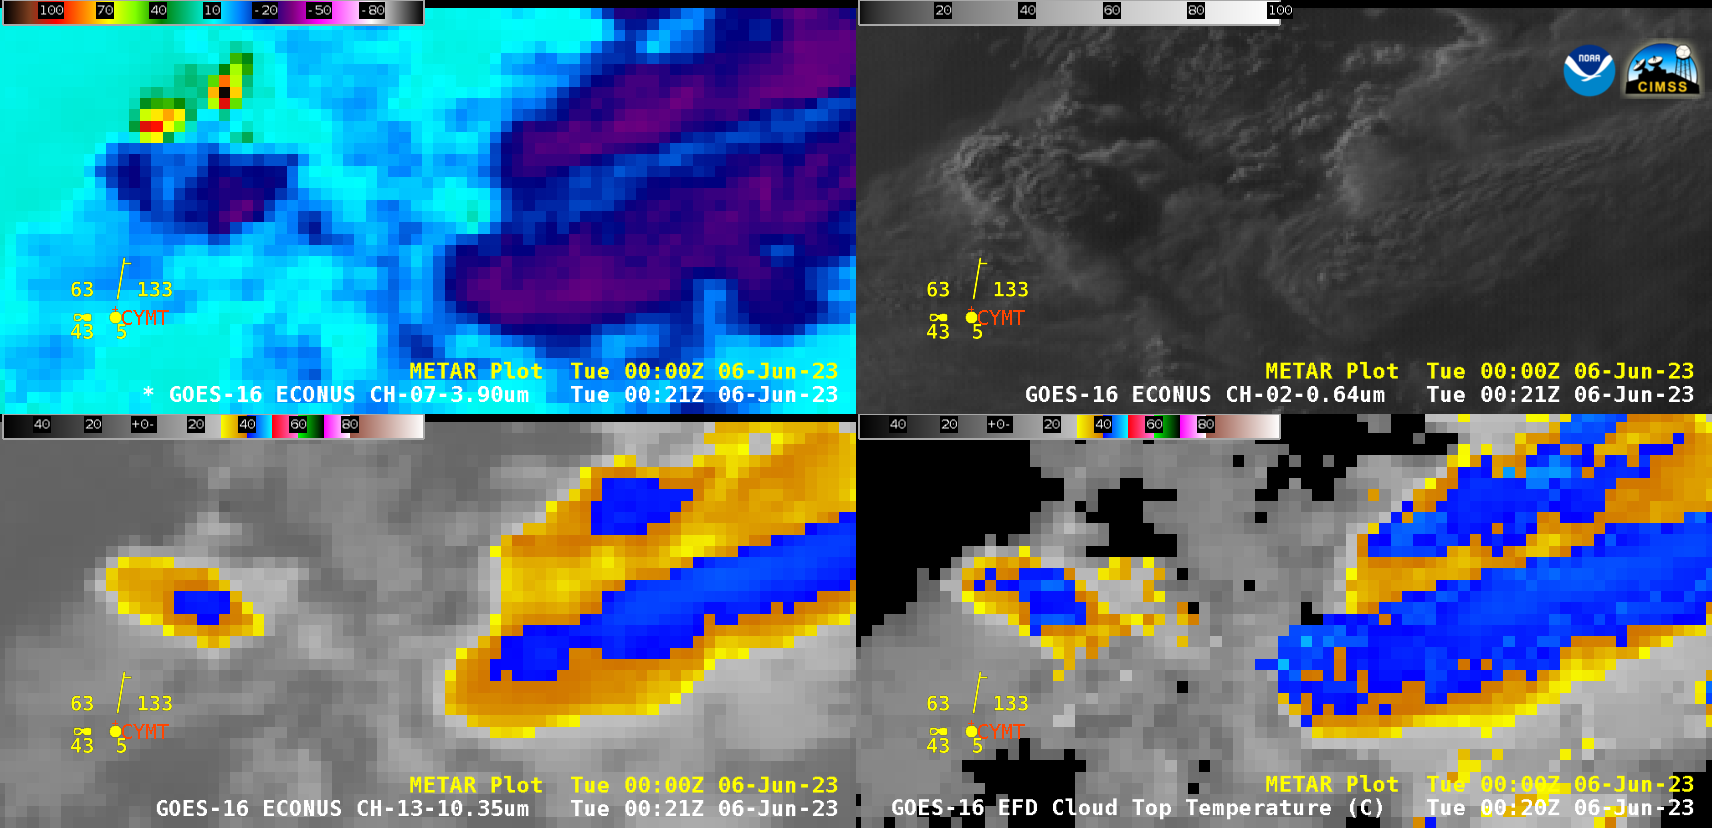
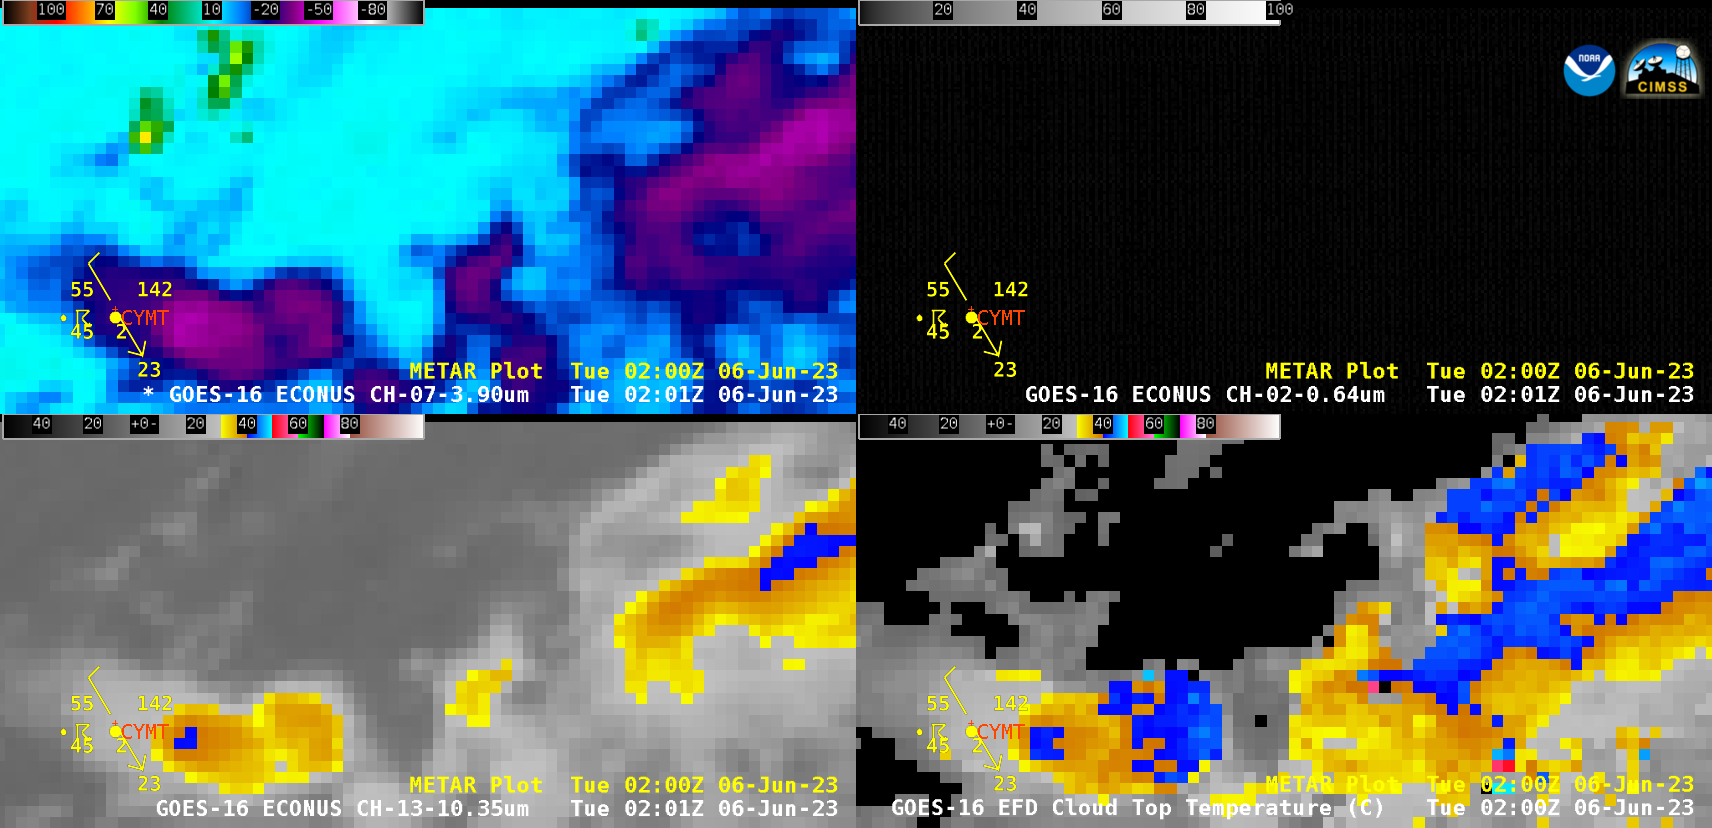
GOES-16 Shortwave Infrared (3.9 µm, top left), “Red” Visible (0.64 µm, top right), “Clean” Infrared Window (10.3 µm, bottom left) and Cloud Top Temperature derived product (bottom right) [click to play animated GIF | MP4]
On
05 June, GOES-16 Shortwave Infrared, “Red” Visible (
0.64 µm), “Clean” Infrared Window (
10.3 µm) and
Cloud Top Temperature (CTT) derived product images
(above) revealed that 2 of the Quebec wildfires north and northeast of Chibougamau-Chapais (CYMT) produced
pyrocumulonimbus (pyroCb) clouds late in the day, which exhibited anvil 10.3 µm brightness temperature and/or CTT values of -40ºC and colder (shades of blue).
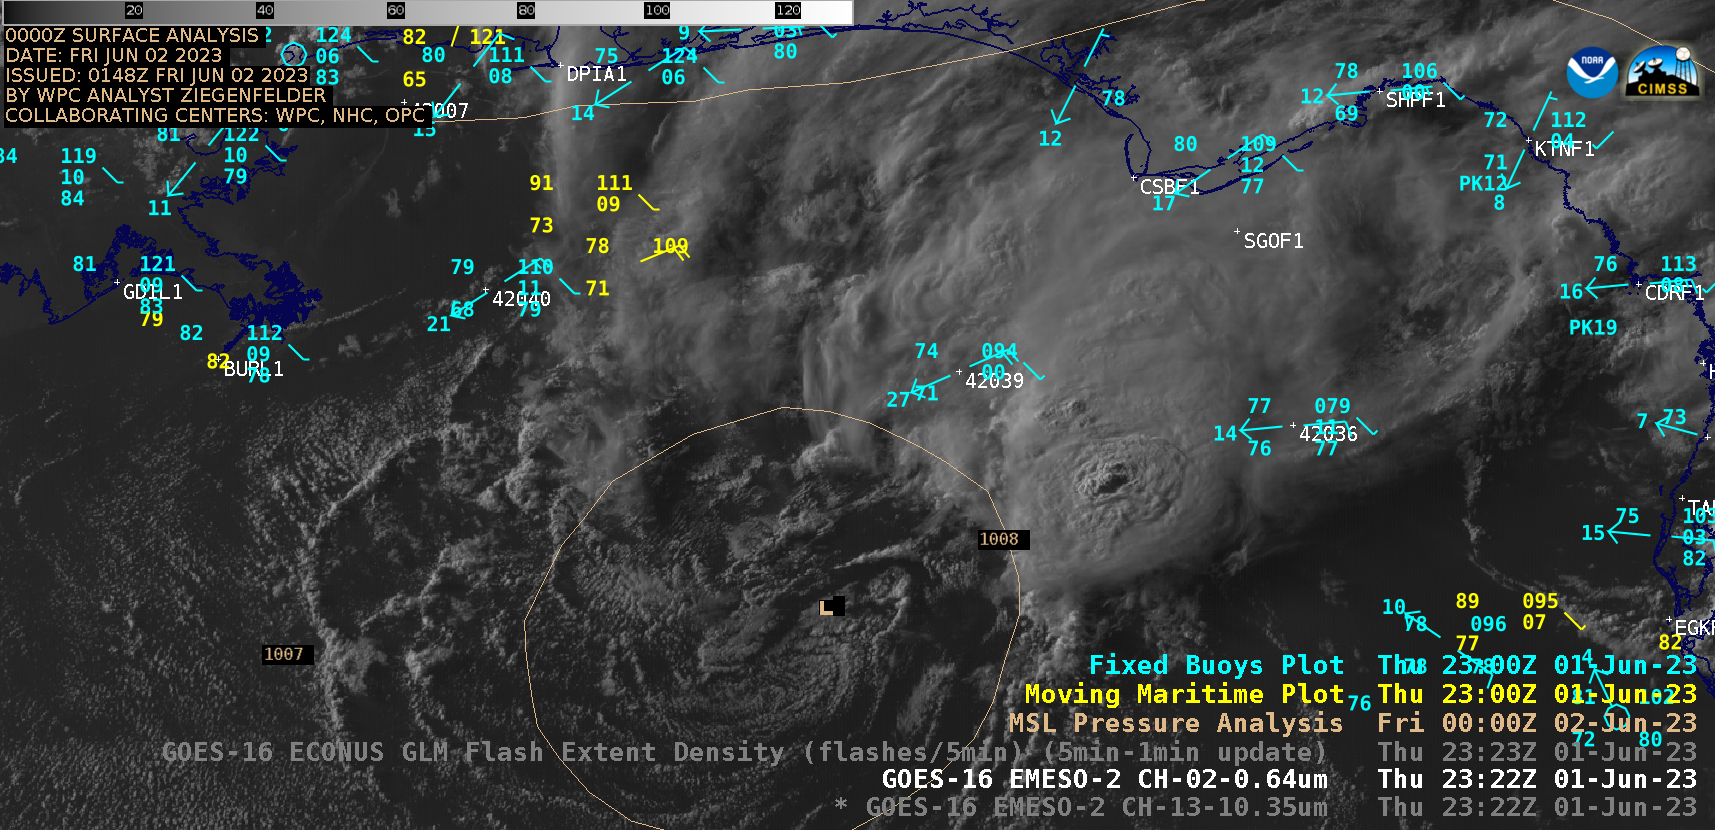
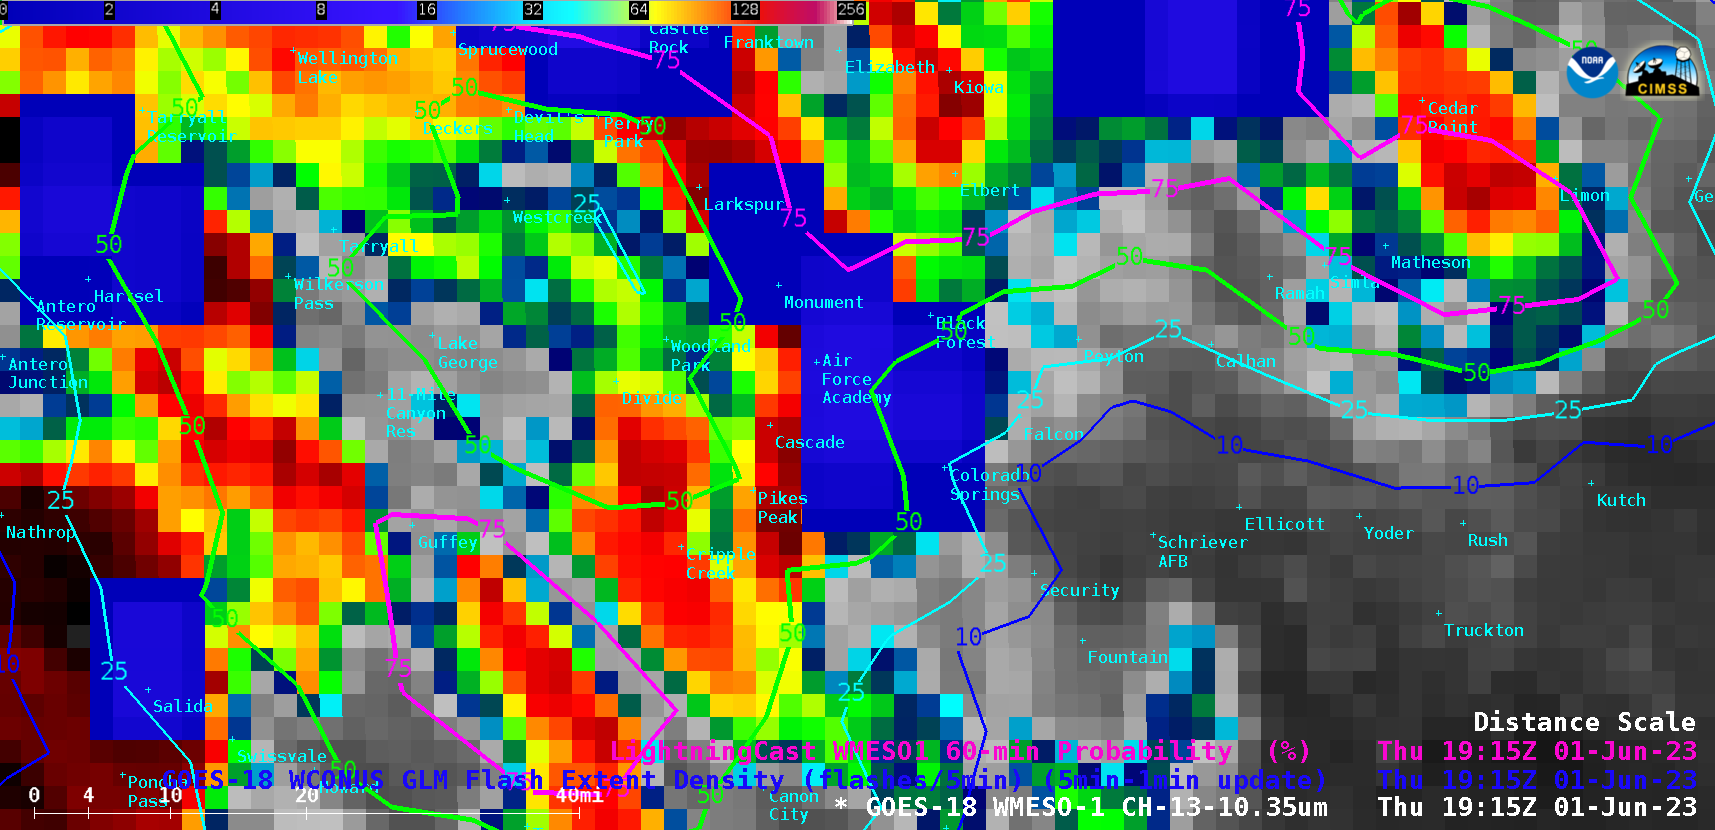
GOES-16 Visible images combined with the Fire Power derived product (below) include an overlay of GLM Flash Extent Density — which showed that some lightning activity was associated with these pyroCb clouds. In fact, shortly after sunset a thunderstorm was reported in the vicinity of CYMT as the pyroCb cloud drifted just east of the site at 0200 UTC. In addition, smoke from the nearby pyroCb-producing wildfire briefly reduced the surface visibility to 2-1/4 miles at CYMT (plot of surface observations).
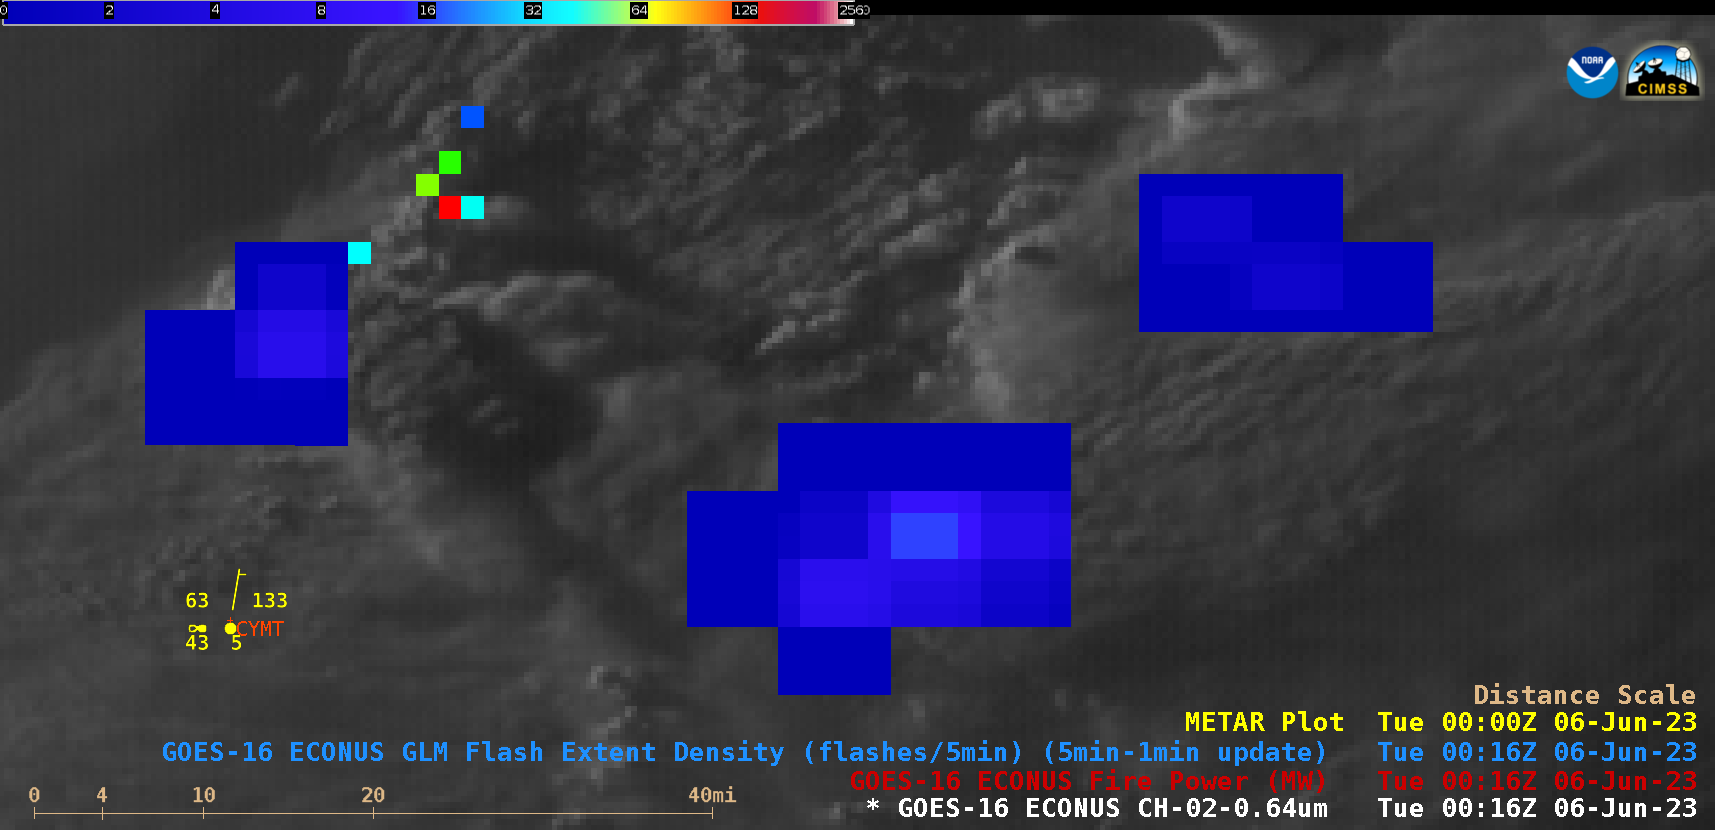
GOES-16 “Red” Visible (0.64 µm) images + Fire Power derived product, with/without an overlay of GLM Flash Extent Density [click to play animated GIF | MP4]
View only this post
Read Less


