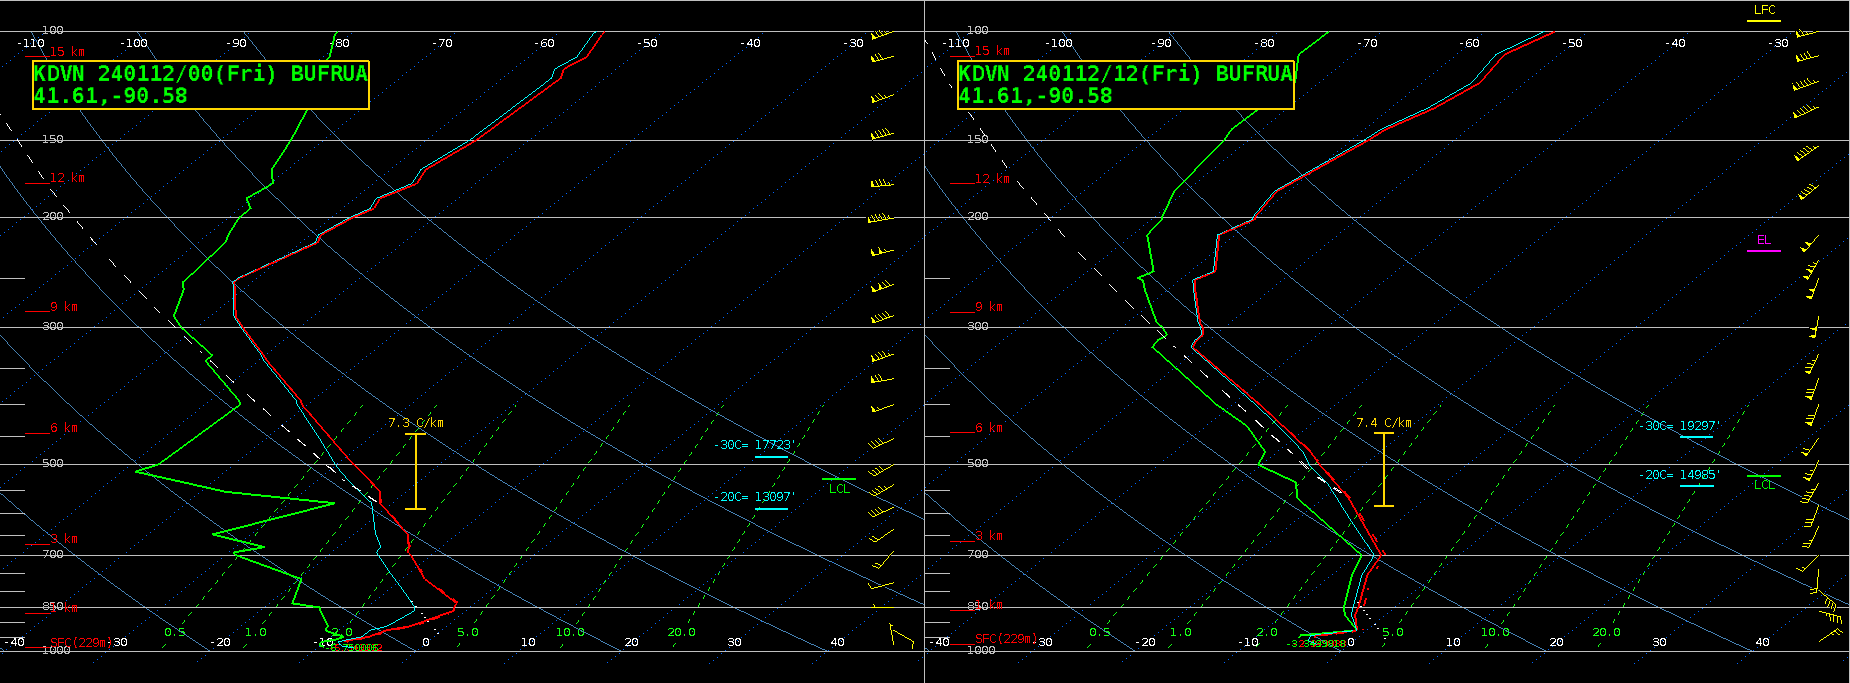
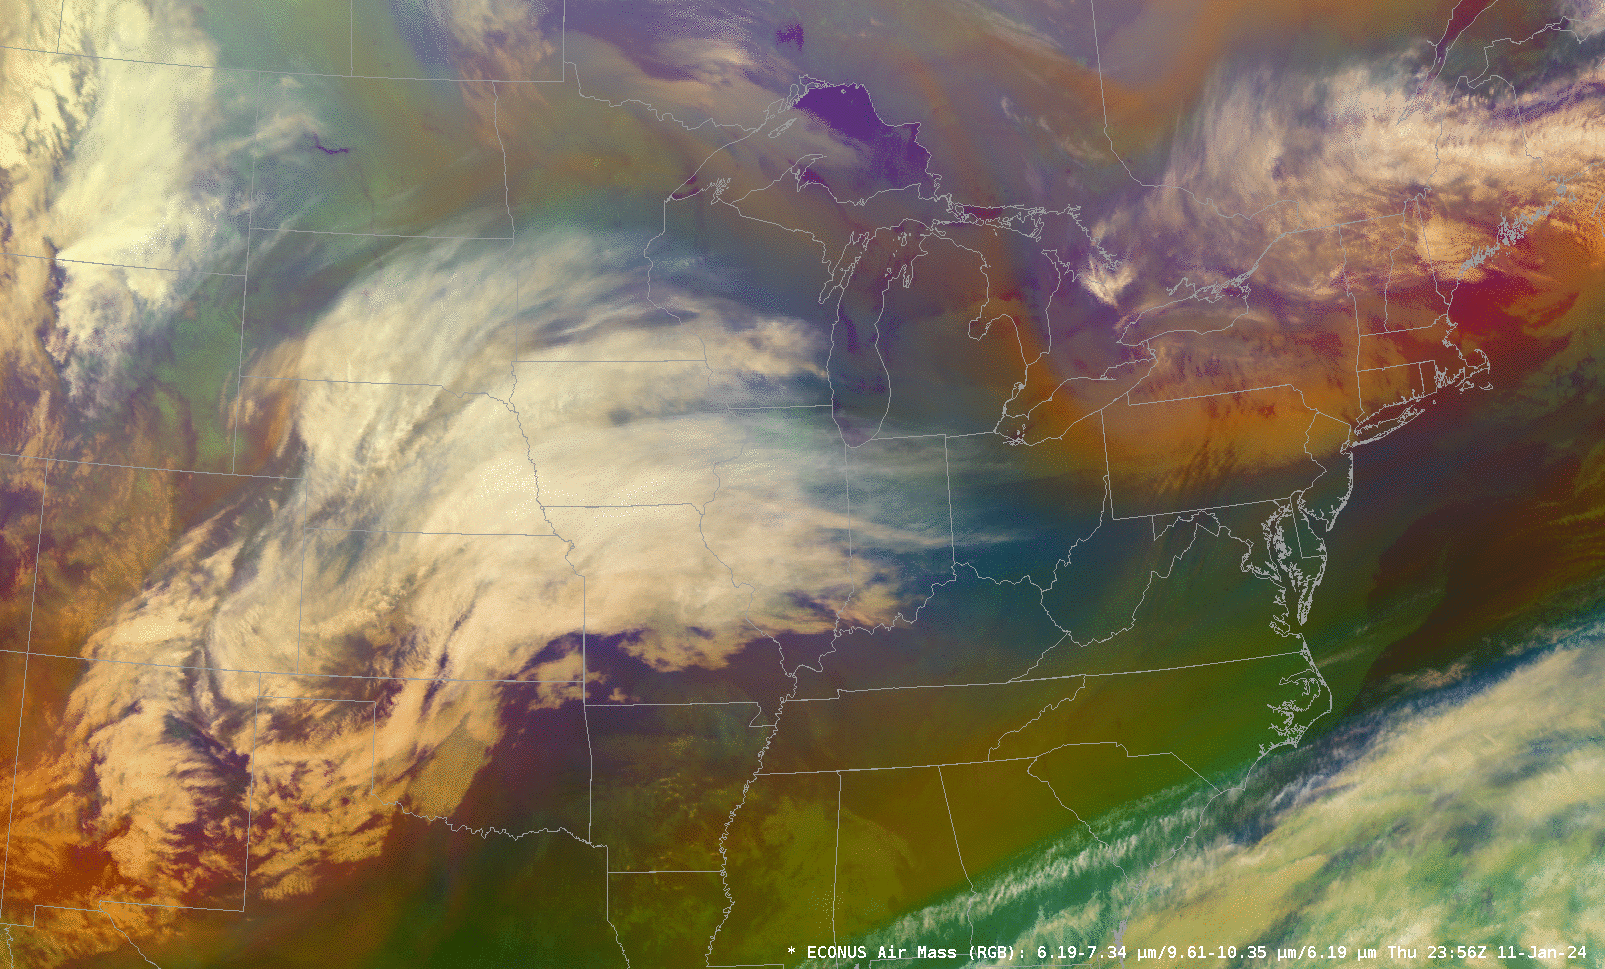
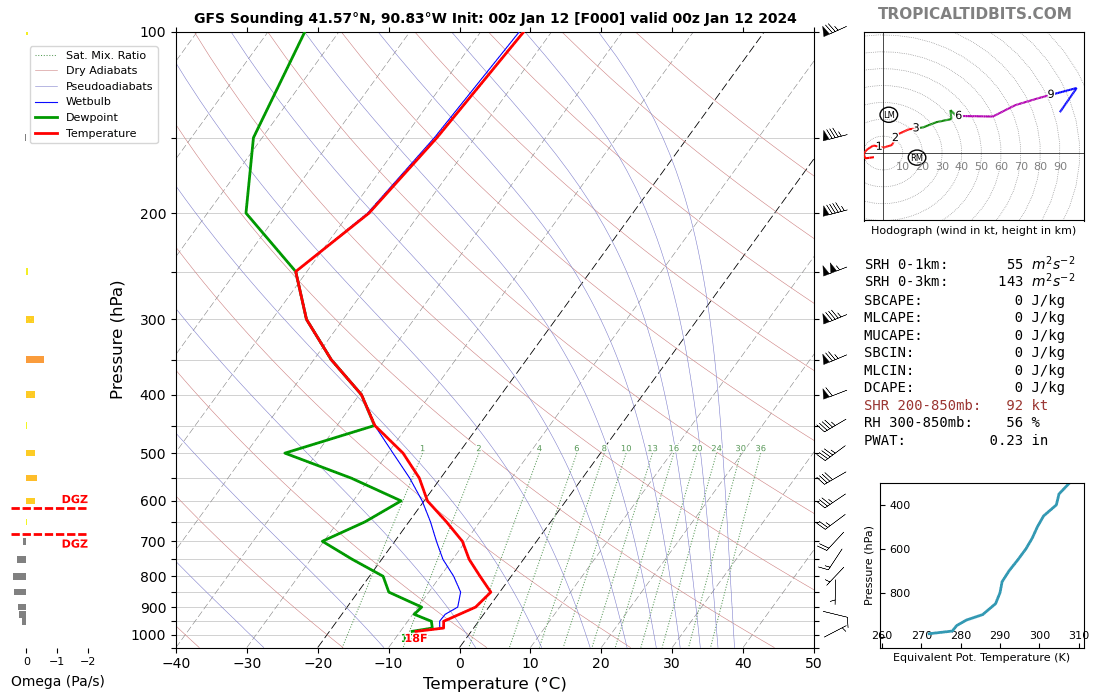
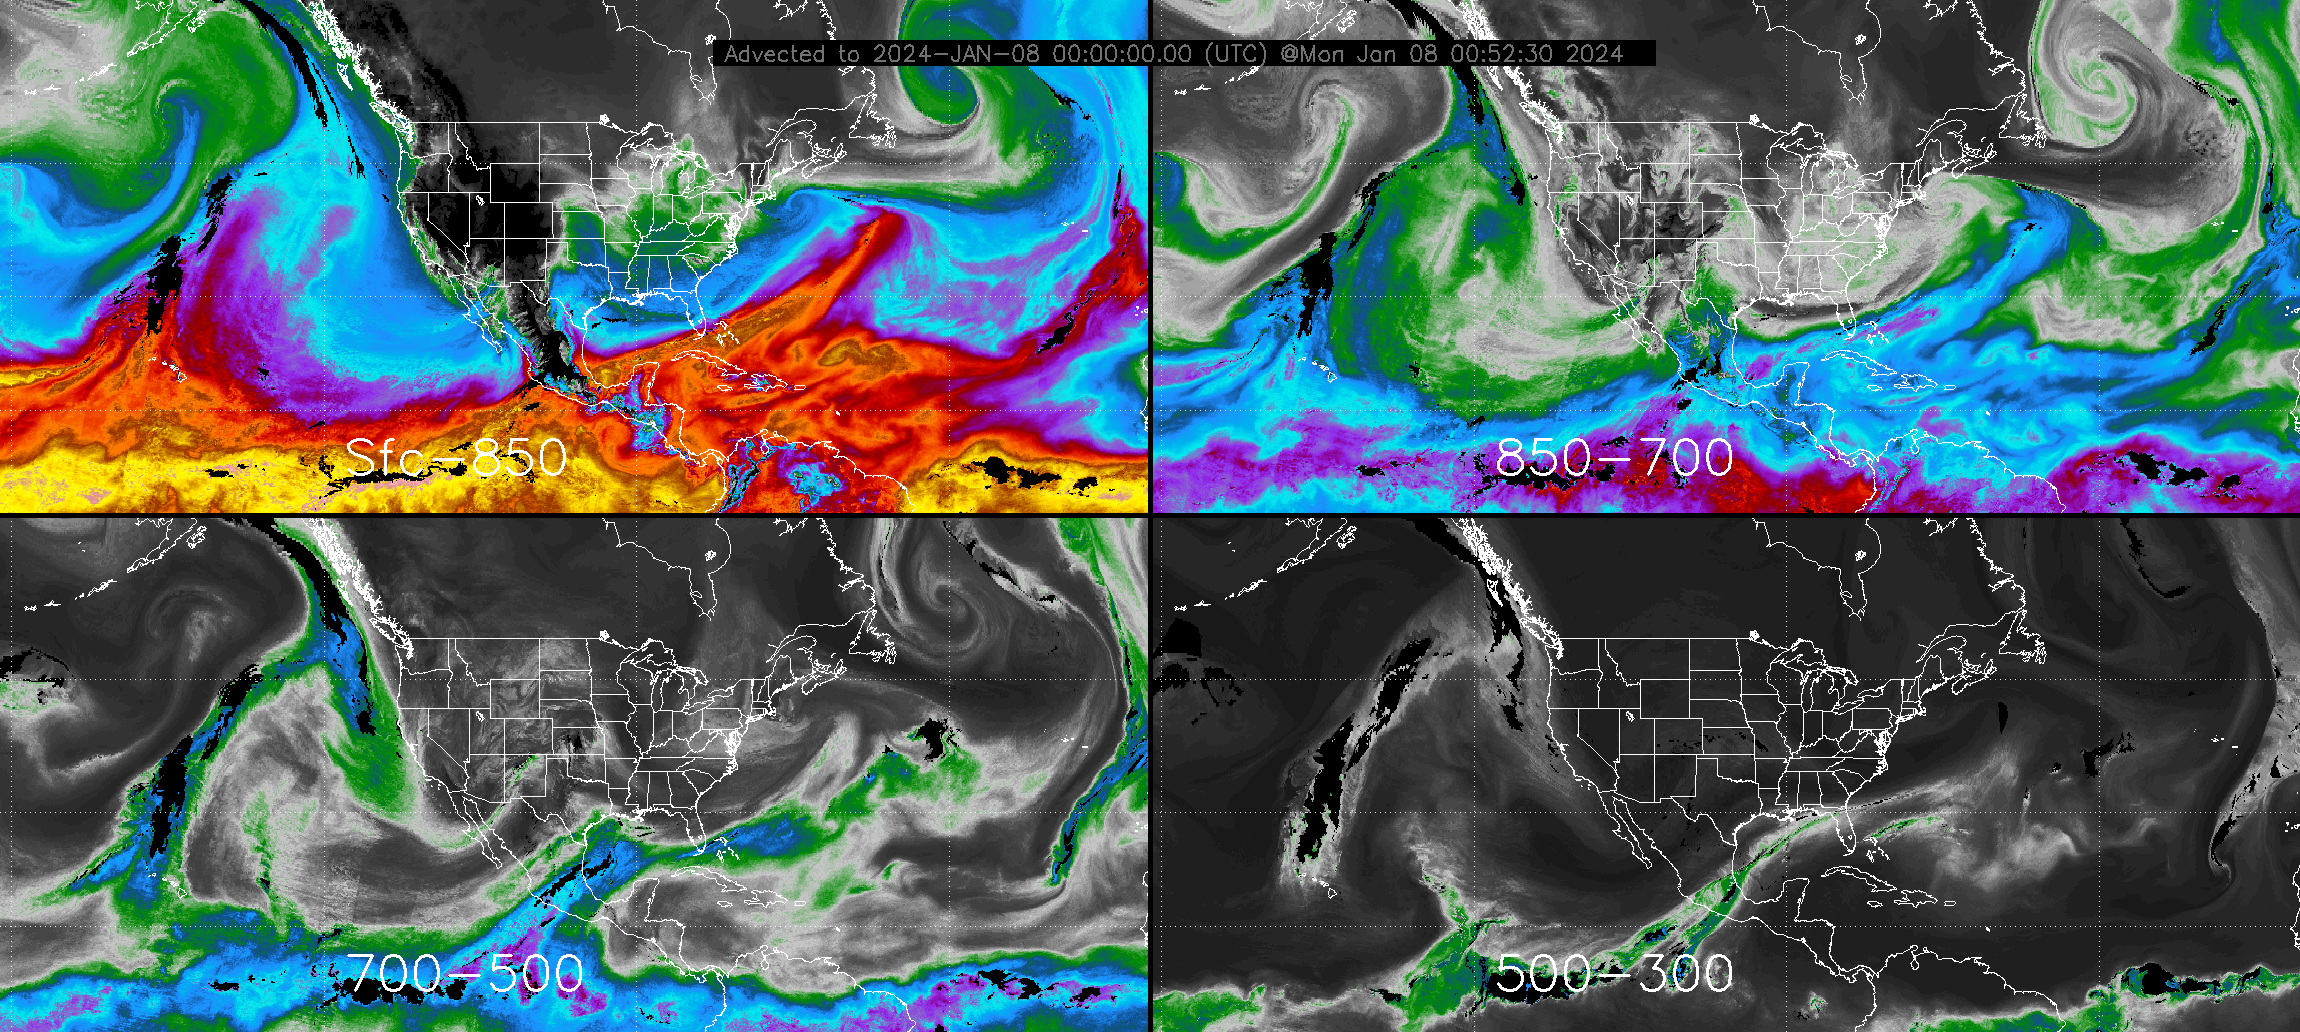
Upper-air rawinsondes at station 74455 (Davenport, Iowa, above) show the response at that point to the approach and development of a potent winter storm (See the Airmass RGB animation below). The lowest levels of the atmosphere have saturated in the 12 hours between upper air observations. Model soundings, after the RGB animation, (from the Tropical Tidbits website) show that the GFS predicted the saturating that was observed. What kind of observations (independent of the model) might be available before the 1200 UTC upper air sounding to check to see if the actual atmosphere is behaving as the GFS predicts?
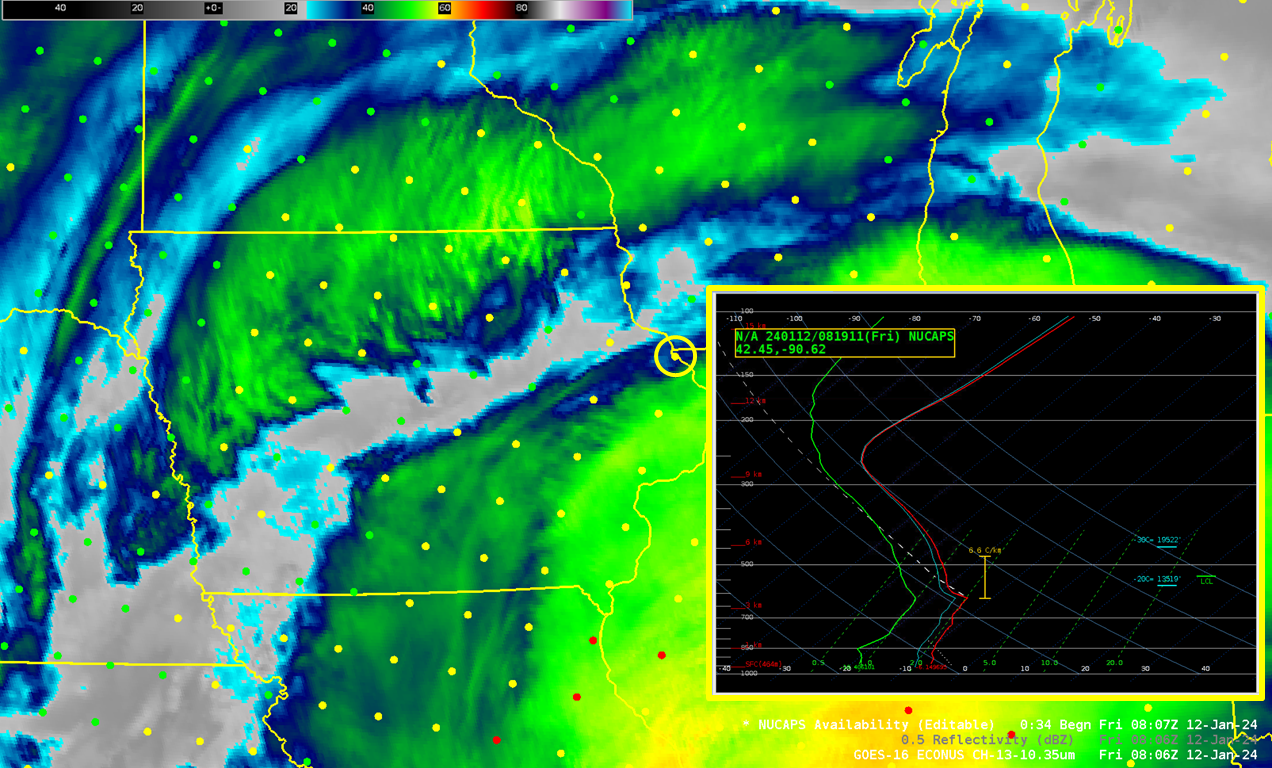
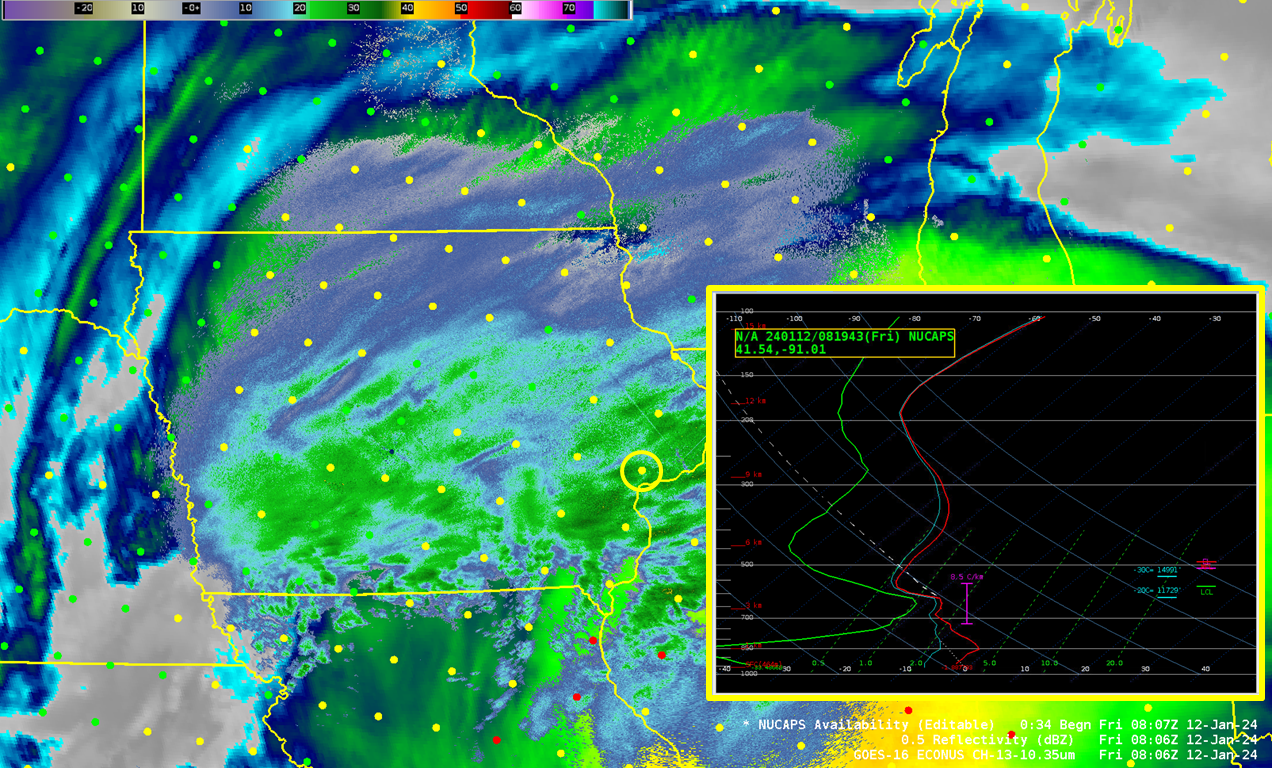
NOAA-20 overflew the Mississippi River valley shortly after 0800 UTC on 12 January 2023. NUCAPS profiles derived from the CrIS and ATMS instruments on NOAA-20 give valuable asynoptic information about the state of the atmosphere. The image below shows a toggle of ABI Band 13 image (without and with the 0.5 NEXRAD radar reflectivity overlain) along with the NUCAPS Sounding availability plot. The Green Points of the NUCAPS Soundings availability are where the infrared and microwave retrievals converged to a solution. Yellow points are where only the microwave retrieval converged. Red points denote retrievals that did not coverge. Of particular note: the slot of warmer brightness temperatures over central Iowa. Note that there are green points associated with that feature (including a green point in southwestern Wisconsin).
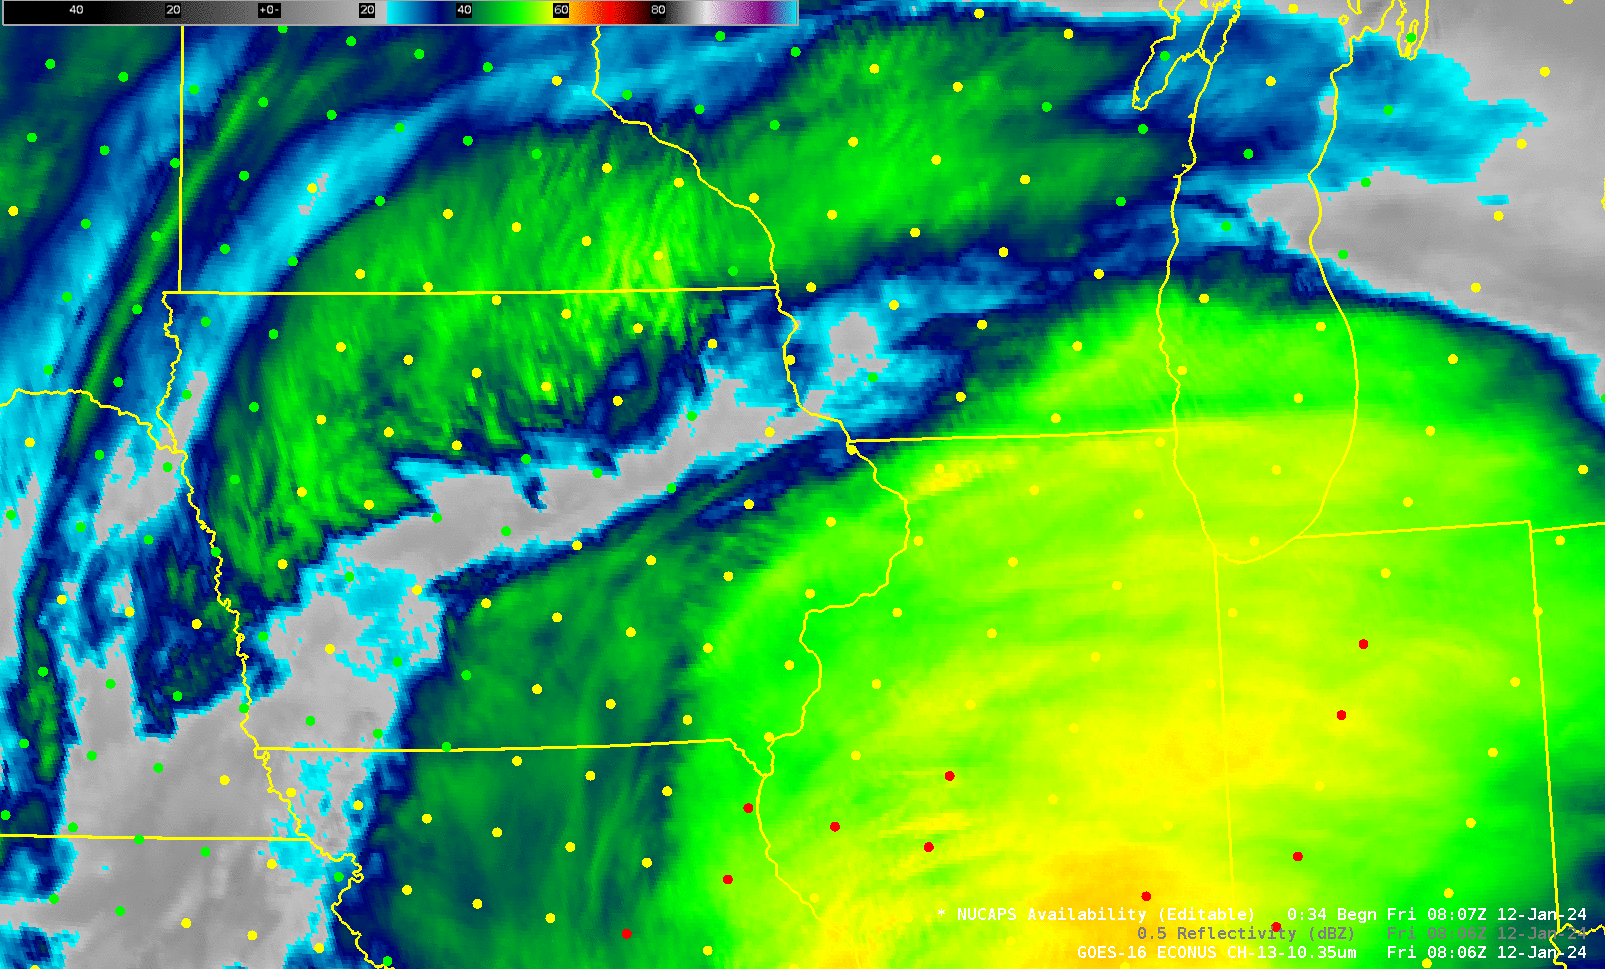
What do some of the 0800 UTC profiles show? That is shown in the animation below that includes profiles from green and yellow points over the mid-Mississippi River valley. The retrievals from the green points over Wisconsin and Iowa both show the same kind of thermal structure below 650-700 mb as is predicted in the forecast shown above, and as observed in the 1200 UTC sounding at Davenport. This is also true in some way for the yellow point in extreme northwest Illinois; for the one in in eastern Iowa, and especially the one near Davenport, the effects of falling snow lead to progressively less reliable information in the retrieval. Microwave-only retrievals that converge to a solution are far more likely to converge to a sensible solution if precipitation is not ongoing, so refer to radar imagery when using NUCAPS profiles.

You can use NUCAPS profiles, even in cloudy regions surrounding precipitation, to assess model performance in an ongoing event. In this case, NUCAPS profiles suggested that the atmosphere was evolving in a manner consistent with model predictions. Other kinds of observations that give useful model-independent thermal profiles (ACARS observations, for example) are unlikely to be present at this time of day over Iowa.
View only this post Read Less


