This website works best with a newer web browser such as Chrome, Firefox, Safari or Microsoft
Edge. Internet Explorer is not supported by this website.
A distinct hot thermal signature (black to yellow to red pixels) of a new Sundhnúkagígar fissure eruption on the Reykjanes Peninsula in southwestern Iceland was apparent in GOES-16 (GOES-East) Shortwave Infrared (3.9 µm) imagery on 08 February 2024 (above). Station identifier BIRK is Reykjavik Airport, and BIKF is Keflavik International Airport.Since the... Read More
GOES-16 Shortwave Infrared (3.9 µm) images, from 0550 -1610 UTC on 08 February [click to play animated GIF | MP4]
A distinct hot thermal signature (black to yellow to red pixels) of a new Sundhnúkagígar fissure eruption on the Reykjanes Peninsula in southwestern Iceland was apparent in GOES-16 (GOES-East) Shortwave Infrared (3.9 µm) imagery on 08 February 2024 (above). Station identifier BIRK is Reykjavik Airport, and BIKF is Keflavik International Airport.
Since the fissure eruption and subsequent lava flows began during the nighttime hours, the thermal signature also showed up well in GOES-16 Near-Infrared 1.61 µm and 2.24 µm imagery (below).
GOES-16 Near-Infrared “Snow/Ice” (1.61 µm, top), Near-Infrared “Cloud Particle Size” (2.24 µm, middle) and Shortwave Infrared (3.9 µm, bottom) images, from 0550-1030 UTC on 08 February [click to play animated GIF | MP4]
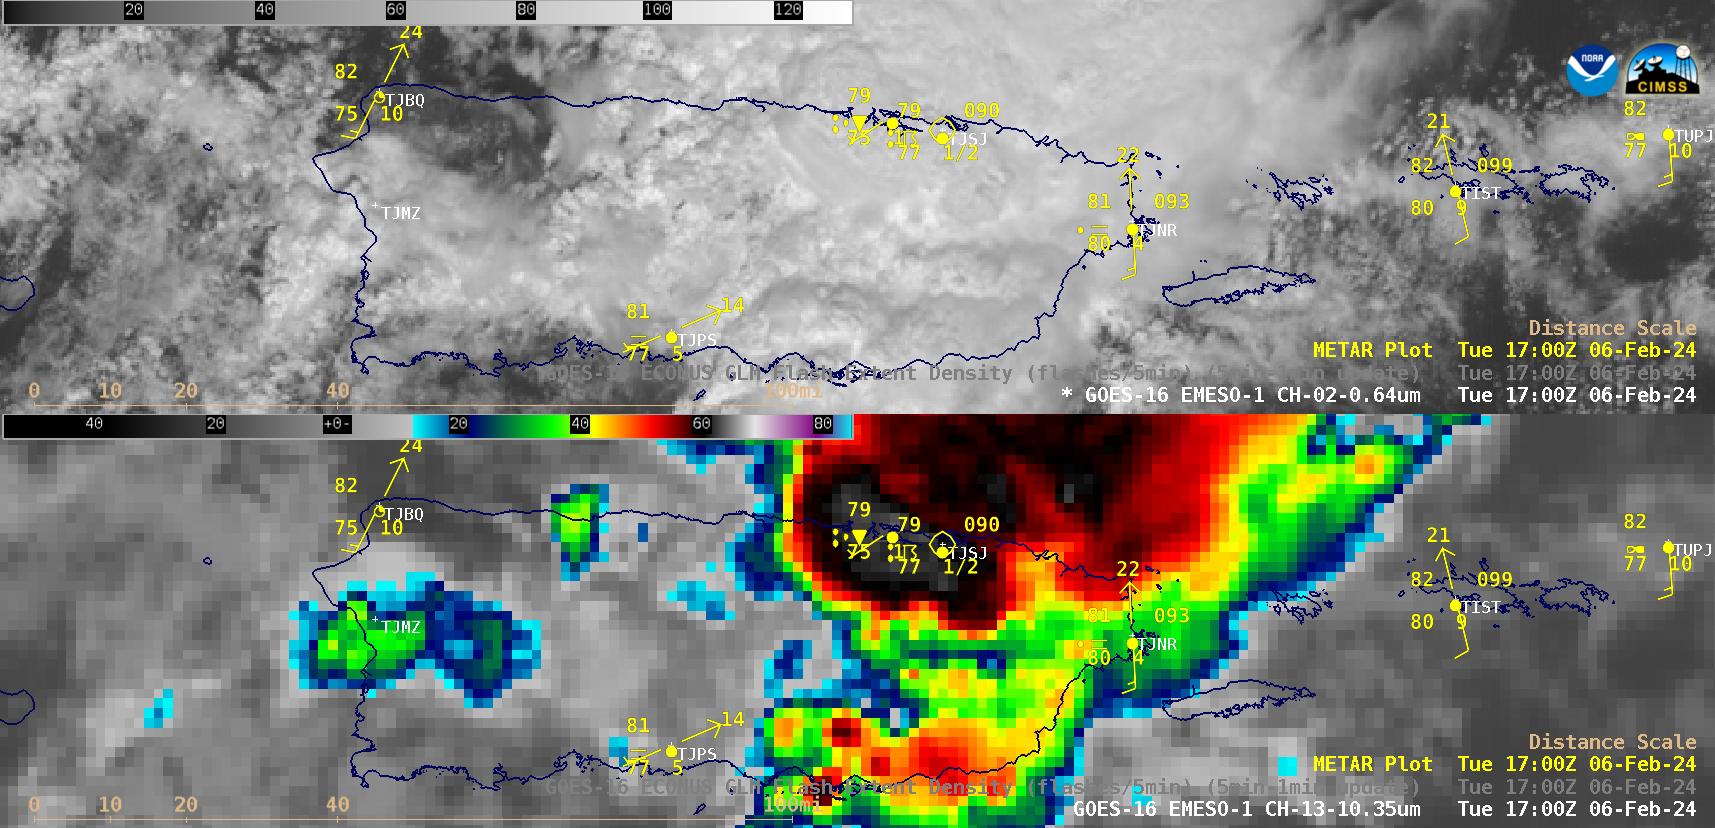
1-minute Mesoscale Domain Sector GOES-16 (GOES-East) “Red” Visible (0.64 µm) and “Clean” Infrared Window (10.3 µm) images (above) showed thunderstorms that moved across Puerto Rico and the US Virgin Islands on 06 February 2024. These storms produced up to 4-5 inches of rainfall in parts of central Puerto Rico, with wind gusts as high as... Read More
1-minute GOES-16 “Red” Visible (0.64 µm, top) and “Clean” Infrared Window (10.3 µm, bottom) images, from 1600-2200 UTC on 06 February [click to play animated GIF | MP4]
1-minute Mesoscale Domain Sector GOES-16 (GOES-East) “Red” Visible (0.64 µm) and “Clean” Infrared Window (10.3 µm) images (above) showed thunderstorms that moved across Puerto Rico and the US Virgin Islands on 06 February 2024. These storms produced up to 4-5 inches of rainfall in parts of central Puerto Rico, with wind gusts as high as 41 kts (47 mph).
These thunderstorms were fueled by a plume of tropical moisture that was moving north-northeastward from northern South America, which passed directly over Puerto Rico during the entire day — as depicted by the MIMC TPW product (below).
MIMIC Total Precipitable Water product, hourly from 0300 UTC on 06 February to 0200 UTC on 07 February
As tropical storm Nat moves away from the Samoan Islands and towards Tahiti, another Invest area, 98P, has developed north of the Samoan Islands. The animation above, from the MIMIC Total Precipitable Water site (link), shows a cyclonically-rotating concentration of moisture just north of Samoa, and moving east-southeastward toward Olosega... Read More
MIMIC Total Precipitable Water fields, 1900 UTC 5 February – 1800 UTC 6 February 2024 (Click to enlarge)
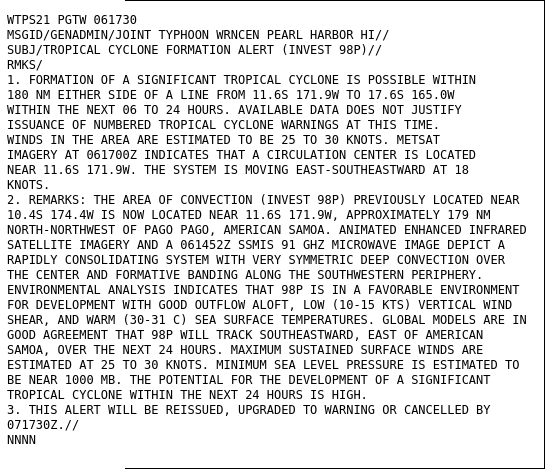
As tropical storm Nat moves away from the Samoan Islands and towards Tahiti, another Invest area, 98P, has developed north of the Samoan Islands. The animation above, from the MIMIC Total Precipitable Water site (link), shows a cyclonically-rotating concentration of moisture just north of Samoa, and moving east-southeastward toward Olosega and Ta’u. The Tropical Cyclone Formation Alert (TCFA) graphic (click here for text explanation) from the Joint Typhoon Warning Center (link), below, moves the center of the disturbed weather towards those islands. skirting the larger islands of Samoa. Flood watches and Heavy Surf Warnings are in effect for all of American Samoa.
Tropical Cyclone Formation Alert graphic, 1730 UTC on 6 February 2024 (Click to enlarge)
Invest area 98P near Samoa and derived fields and satellite imagery that can be used to diagnose the strength and motion of the system. See text above for details (Click to enlarge)
Scatterometry is a useful tool to find circulation centers, but observations over the center must happen! The animation below (from this source) shows MetopB and MetopC observations in the past 2 days. The circulation of Tropical Cyclone Nat is sampled well on the 5th, but the region north of Samoa, where 98P is developing, has not had good coverage.
MetopB and MetopC ASCAT observations, 5-6 February 2024 (Click to enlarge) The nominal times of the ASCAT observations are shown in blue along the bottom of the plot
However, HY-2B and HY-2C satellites from China (available at this website), shown below, had good coverage over the region, as shown below. The 0930 UTC image shows the circulation (with much stronger winds towards the Equator) associated with 98P.
HY-2B and HY-2C Scatterometer winds, 0330, 0630, 0930 UTC on 6 February 2024 (Click to enlarge)GOES-West Night Microphysics (at night) and True-Color imagery (during daytime) 1640-2030 UTC on 6 February 2024
GOES-West imagery (taken from the CSPP Geosphere site) over the South Pacific on 6 February, above, shows 98P north of American Samoa, and Tropical Storm Nat to the east. Nat is showing the effects of increasing shear as the low-level circulation starts to emerge from beneath the deep convection by the end of the animation. One of the GOES-West mesosectors has been positioned over Samoa to monitor the evolution of the system. A 2-hour animation, below, of visible imagery shows the active convection, and low-level flow to the northwest (north of Tutuila).
GOES-18 Mesoscale Sector #2 Visible Imagery (Band 2, 0.64 µm), 1835 – 2105 UTC on 6 February 2024 (Click to enlarge)
Added, 2200 UTC: Advisories on Tropical Depression 11P have started from JTWC and on Tropical Cyclone 08F from the Fiji RSMC. Despite the different numbers, they’re the same system.
The animation below (source), from 2130 UTC 6 February to 0120 UTC 7 February, shows the continued spin-up of the Tropical Depression in American Samoa waters. The GLM does not show lightning near the center of the storm. Meanwhile, Tropical Storm Nat, to the east, continues to exhibit characteristics of a sheared storm, with the low-level circulation separated from convection.
GOES-18 GeoColor animation with GLM FED overlain, 2136 UTC 6 February – 0126 UTC 7 February 2024 (Click to enlarge)
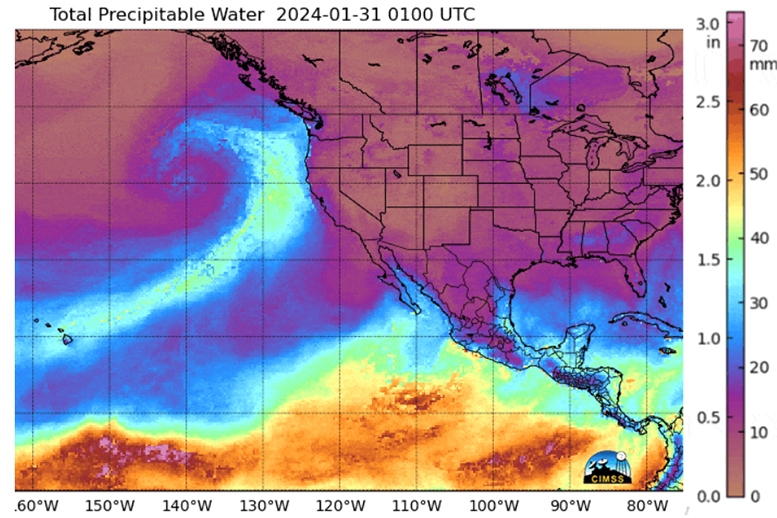
2024 has seen several strong storms hit the U.S. West Coast delivering repeated rounds of widespread rains and mountain snow, with Southern California experiencing the heaviest rainfall totals. Total Precipitable Water imagery (MIMIC TPW) conveying data acquired by microwave sensors on polar-orbiting satellites is a key tool for meteorologists tracking atmospheric... Read More
2024 has seen several strong storms hit the U.S. West Coast delivering repeated rounds of widespread rains and mountain snow, with Southern California experiencing the heaviest rainfall totals. Total Precipitable Water imagery (MIMIC TPW) conveying data acquired by microwave sensors on polar-orbiting satellites is a key tool for meteorologists tracking atmospheric rivers associated with these storm systems, as seen in this loop from 30 January to 6 February.
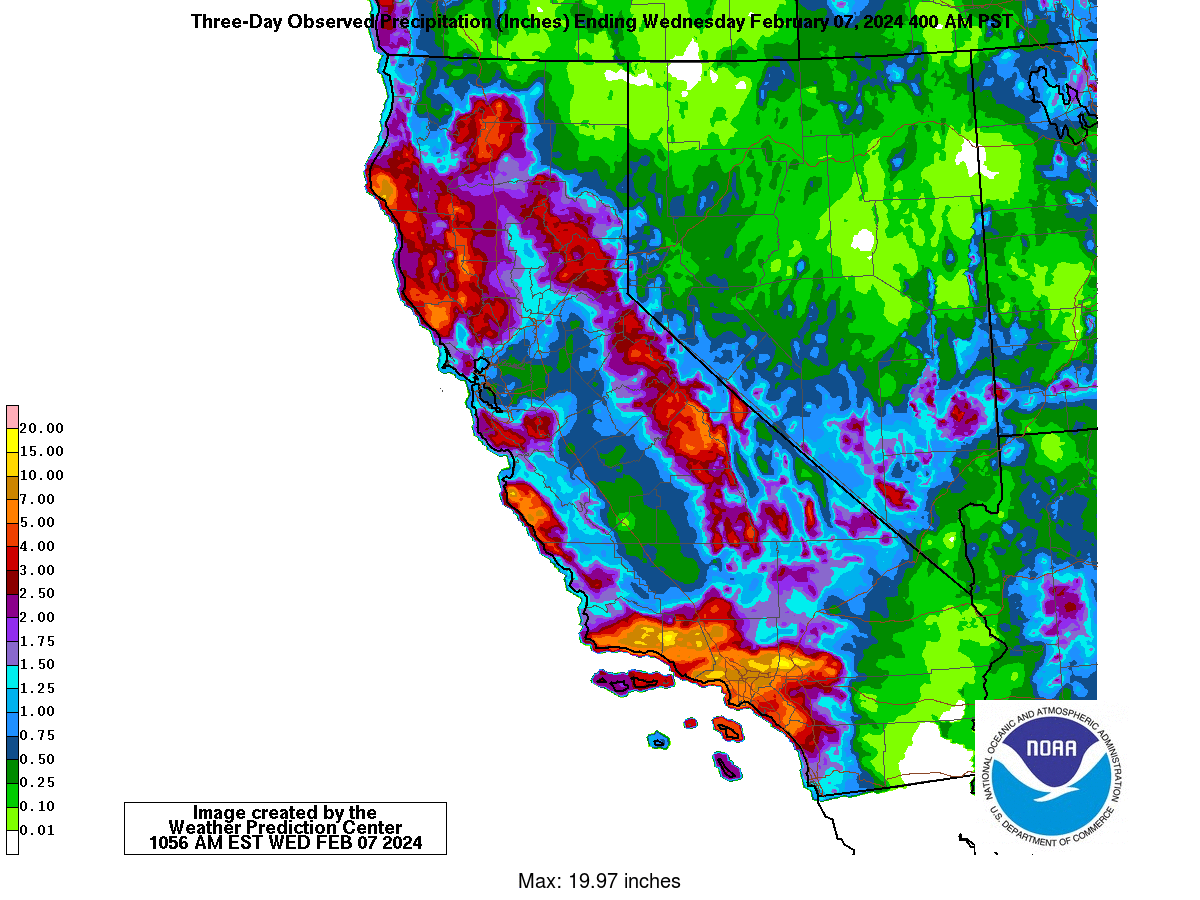
Numerous daily rainfall records have been set so far this year. Below are 3-day observed precipitation totals across the state of California ending at 4am PST on February 7th, with an impressive maximum of 19.97 inches from southwest California.
GOES-18 (GOES West) monitors all storms over the Pacific Ocean and U.S. West Coast. The following animation toggles between Mid-level Water Vapor (ABI band 9) and Air Mass RGB imagery on January 31st.
A second storm directed a significant Atmospheric River at southern California on the 3rd and 4th of February as seen in the following loop of GOES West Water Vapor imagery.
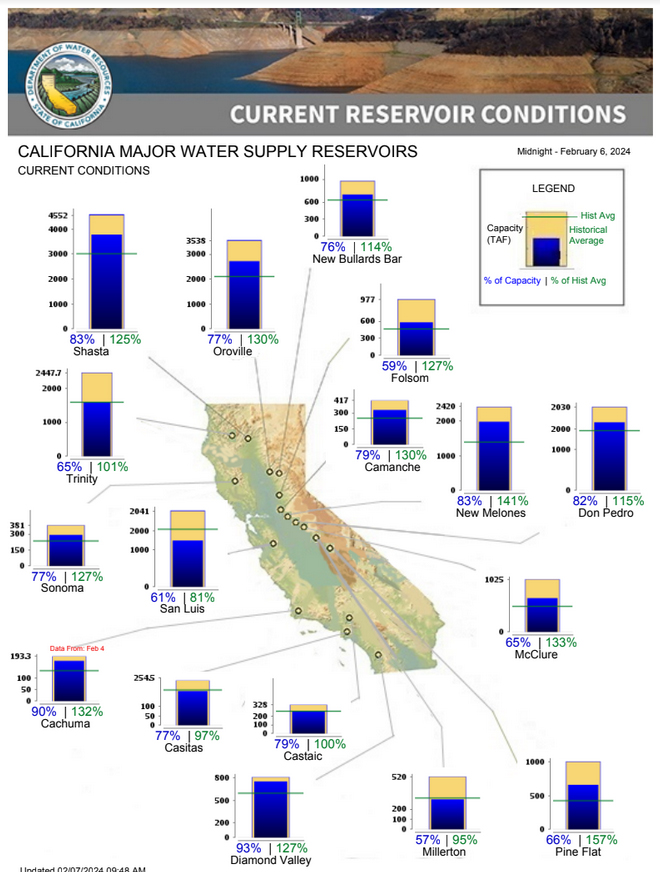
As seen in the accompanying graphic, a majority of the major water supply reservoirs in California are at or above historical averages, an astonishing rebound from the dire drought conditions at the end of 2022. This turn-around commenced last winter when an historic run of nine atmospheric rivers inundated California between December 2022 and January 2023.
Now the concern has shifted to damaging floods, falling trees, mudslides and debris flows.

