At the CIMSS Satellite Blog, we occasionally get emails from our readers. Yesterday’s (6 February 2024) email included this one:
I was doing some forecasting for the Canadian Arctic today and noticed a very
impressive blowing snow signature on satellite; not that blowing snow is
uncommon up there, but rather that the signature was so strong given the lower
resolution and parallax at that latitude.
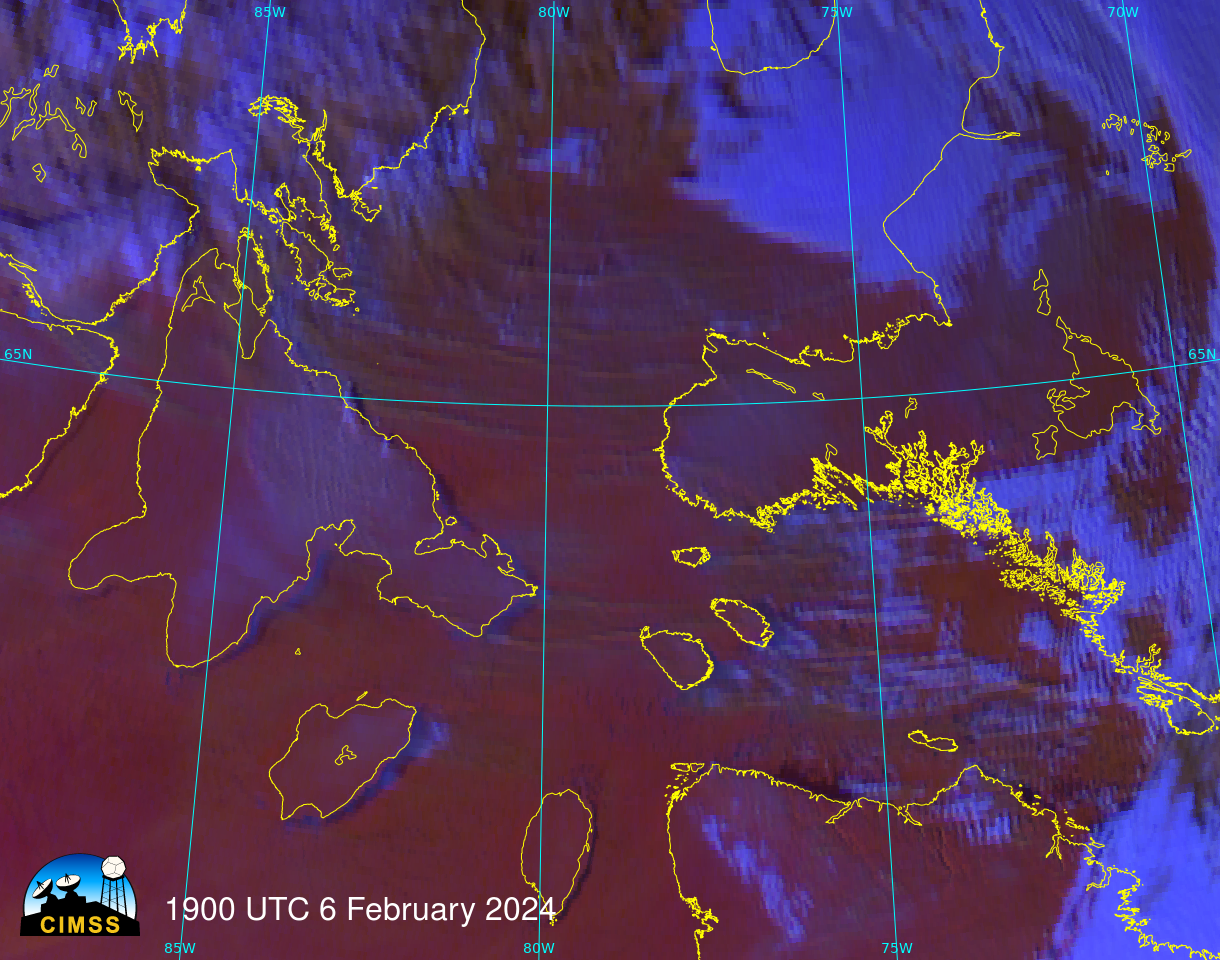
The email included this link to the CIRA SLIDER, where a Day Snow Fog image loop was displayed, including the frame below. The linear structures that appear in the RGB between, for example, Southampton and Nottingham Islands (here’s a map with islands labeled) are characteristic of blowing snow. (See this blog post for more information on RGB detection of blowing snow) Other linear features are north of Southampton Island.
This was happening south of strong storm (with a central pressure of 991 mb) even farther north than northern Hudson Bay, shown in the map below.
The Day Snow Fog Quick Guide (here, one of many Quick Guides developed over the years by scientists at CIMSS, CIRA and SPORT) describes the components of the RGB. I decided to create the RGB using CSPPGeo‘s geo2grid software, and the way to do that is to insert definitions into two different yaml files within the geo2grid file structure.
First, define the RGB in $GEO2GRID_HOME/etc/polar2grid/composites/abi.yaml by adding the lines below. I called this Day Snow Fog RGB ‘dsfog’: the ‘Red’ component is Band 3 (0.86 µm); the ‘Green’ component in Band 5 (1.61 µm); the blue component is a difference field, Band 7 – Band 13 (3.9 µm – 10.3 µm). When invoking geo2grid, the -p dsfog flag tells the software to create Day Snow Fog imagery.
  dsfog:
    compositor: !!python/name:satpy.composites.GenericCompositor
    prerequisites:
      - name: C03
      - name: C05
      - compositor: !!python/name:satpy.composites.DifferenceCompositor
        prerequisites:
        - name: C07
        - name: C13
    standard_name: dsfog
Then, assign bounds and gamma in $GEO2GRID_HOME/etc/polar2grid/enhancements/abi.yaml, shown below. Band 3 reflectance values range from 0 to 100, band 5 reflectance values range from 0 to 70, and the Band 7 – Band 13 brightness temperature difference ranges from 0 to 30oC. In addition, a gamma of 1.7 is applied to each of the RGB bands.
  dsfog_abi:
    standard_name: dsfog
    name: dsfog
    operations:
      - name: stretch
        method: !!python/name:satpy.enhancements.stretch
        kwargs:
          stretch: crude
          min_stretch: [0.0, 0.0, 0.0]
          max_stretch: [100.0, 70.0, 30.0]
      - name: gamma
        method: !!python/name:satpy.enhancements.gamma
        kwargs:
          gamma: [1.7, 1.7, 1.7]
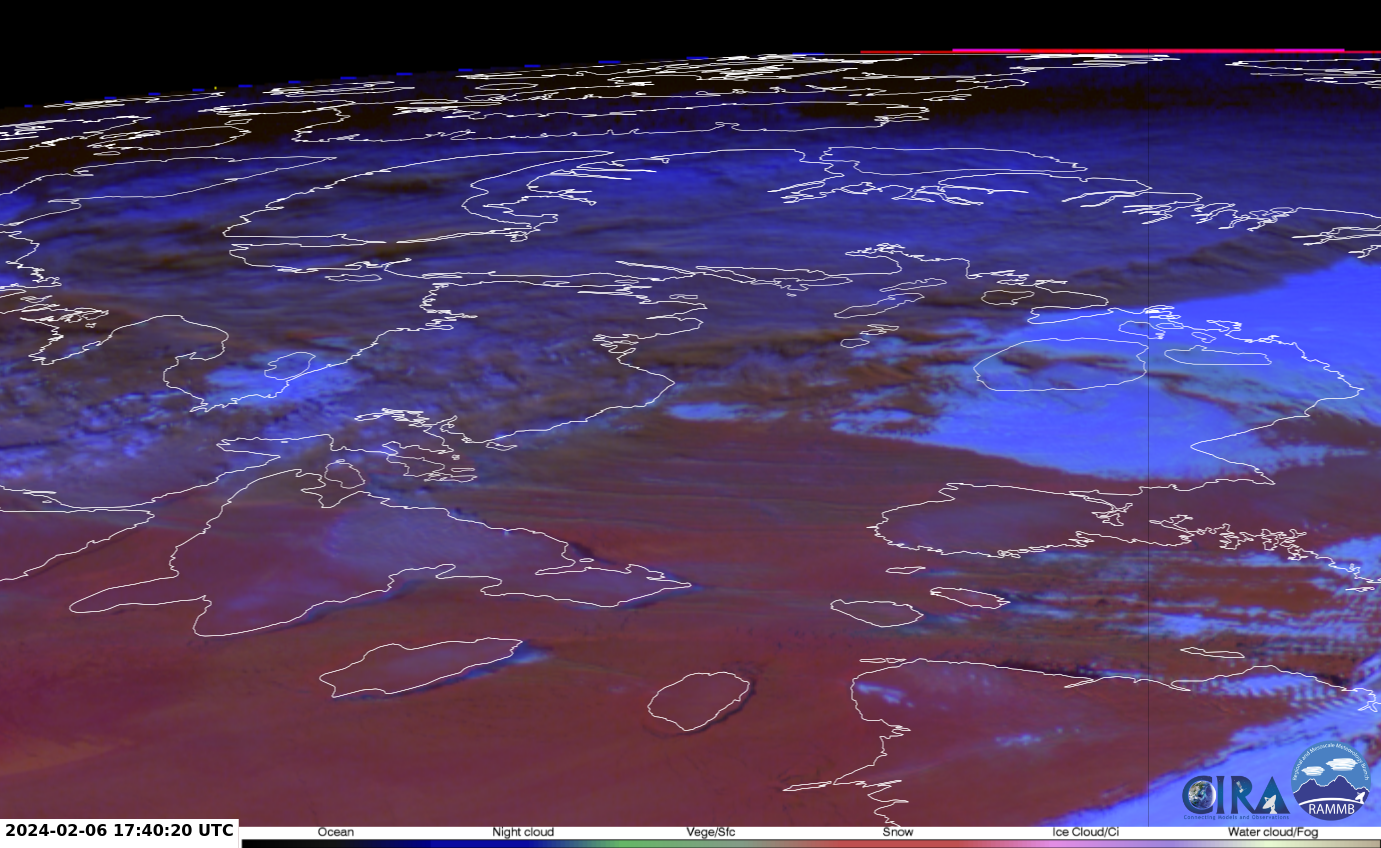
Use the p2g_grid_helper.sh shell script to define a grid (‘MyMap’, defined in ‘MyMap.yaml’ as used in the geo2grid call below) onto which data will be displayed. Then two geo2grid calls create the imagery and put georeferencing onto it. I used ImageMagick to annotate the imagery, and the animation is shown below. Characteristic linear features that are a bit greener than the underlying red surface show where blowing snow is occurring. In the absence of surface observations, this can give important information.
$GEO2GRID_HOME/bin/geo2grid.sh -r abi_l1b -w geotiff -g MyMap --grid-configs MayMap.yaml -p dsfog -f /path/to/goes16/abi/L1b/RadF/*s2024037[time]*
../add_coastlines.sh --add-coastlines --coastlines-resolution f --add-grid --grid-D 5.0 5.0 --grid-d 5.0 5.0 --grid-text-size 14 GOES-16_ABI*dsfog*.tif
Another (higher-contrast) version of the GOES-16 Day Snow-Fog RGB along with the Day Cloud Phase Distinction RGB was also created using Geo2Grid, as shown below. The higher-contrast RGB imagery depicted the areal coverage of horizontal convective roll clouds — which often highlight the presence of blowing snow — a bit more clearly as they streamed eastward from Southampton Island (and even Coats Island, just to the south). The higher contrast also helped to accentuate the polynyas that were slowly opening just downwind of the islands.
GOES-16 Day Snow-Fog RGB (left) and Day Cloud Phase Distinction RGB (right) images from 1500-2050 UTC on 06 February (courtesy Scott Bachmeier CIMSS) [click to play animated GIF | MP4]
Thanks to Brad Vrolijk for alerting us to this far north event!
View only this post Read Less


