This website works best with a newer web browser such as Chrome, Firefox, Safari or Microsoft
Edge. Internet Explorer is not supported by this website.
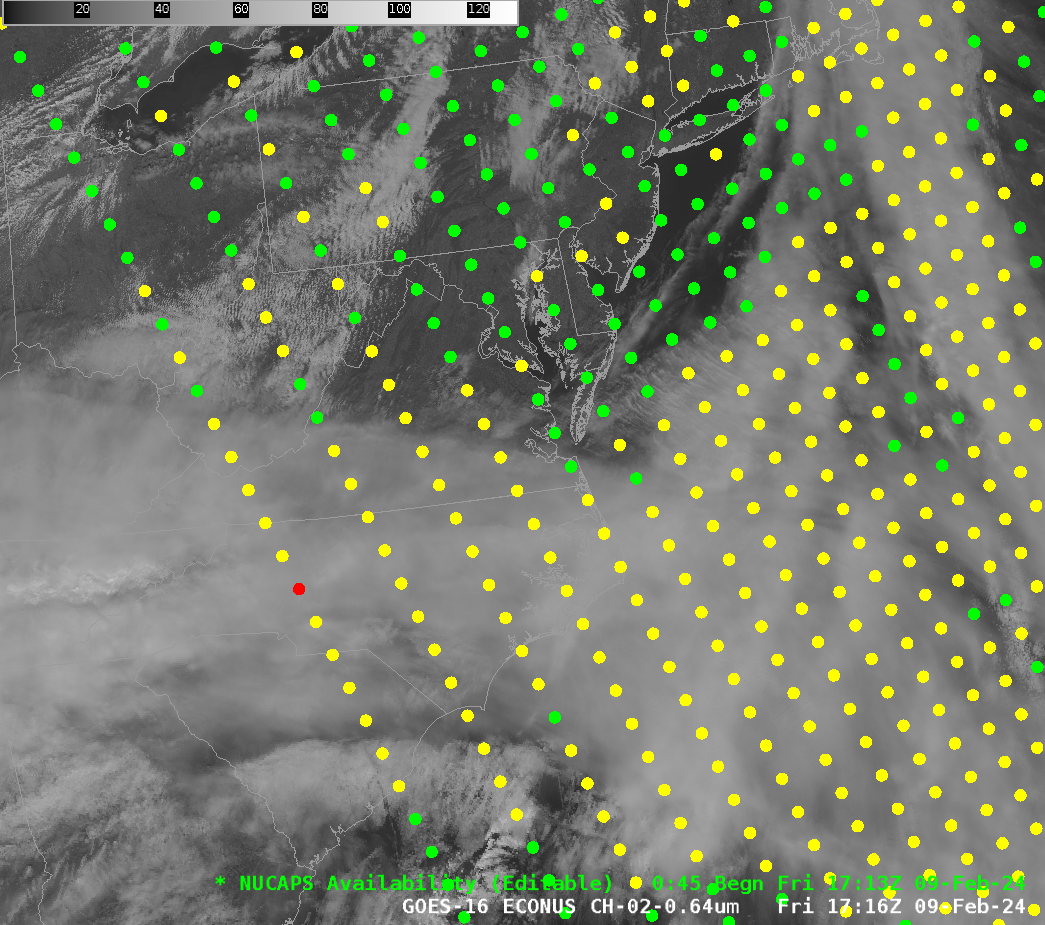
After an outage of about a week brought on by an anomaly in NOAA-20 (since fixed), NUCAPS profiles have re-appeared in AWIPS workstations, starting with the 1713 UTC overpass over the Eastern United States, shown above. One use for NUCAPS is to gauge how well a forecast is evolving. For... Read More
NUCAPS Sounding Availability, 1713 UTC on 9 February with a location near New York City highlighted (click to enlarge)
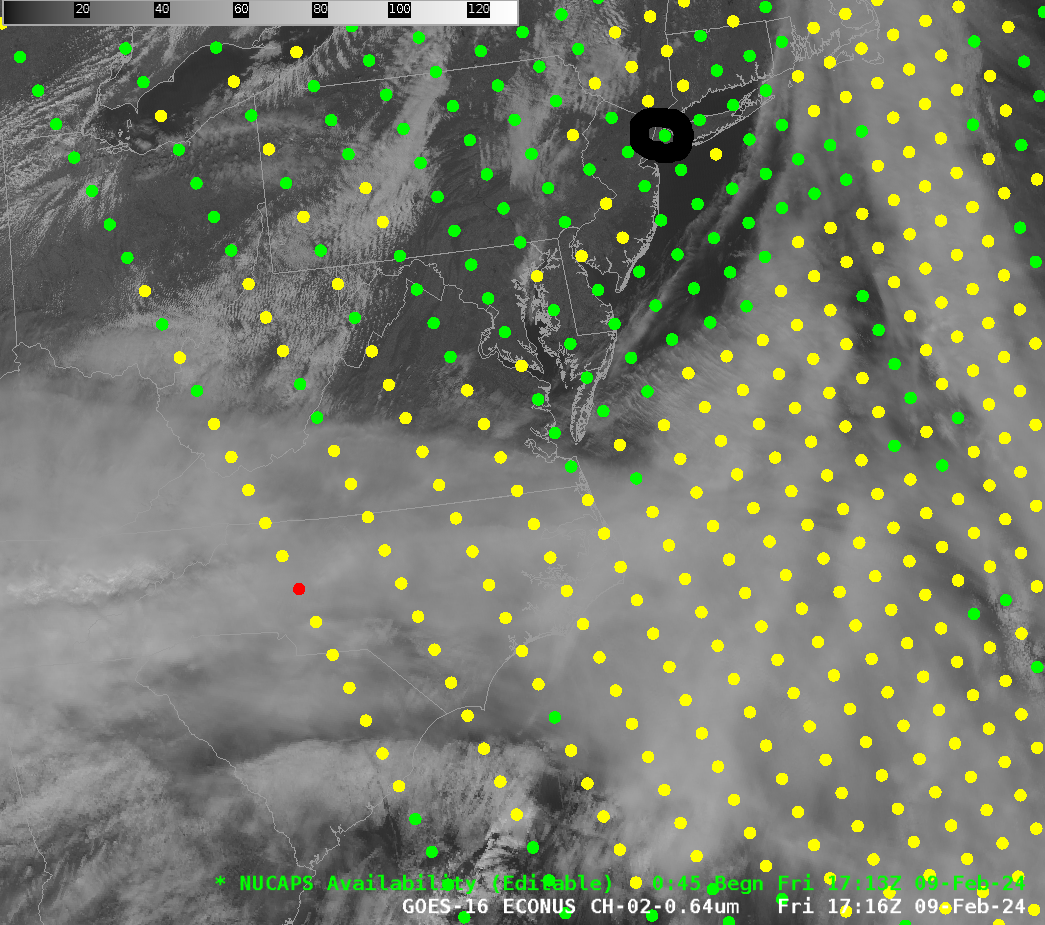
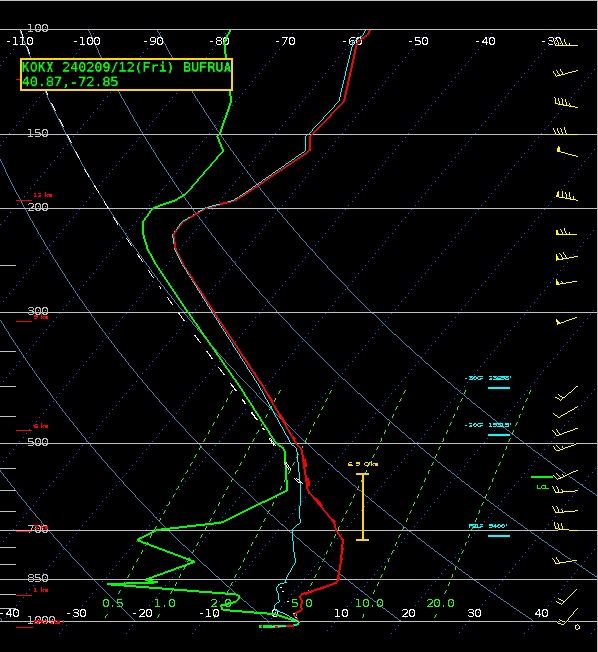
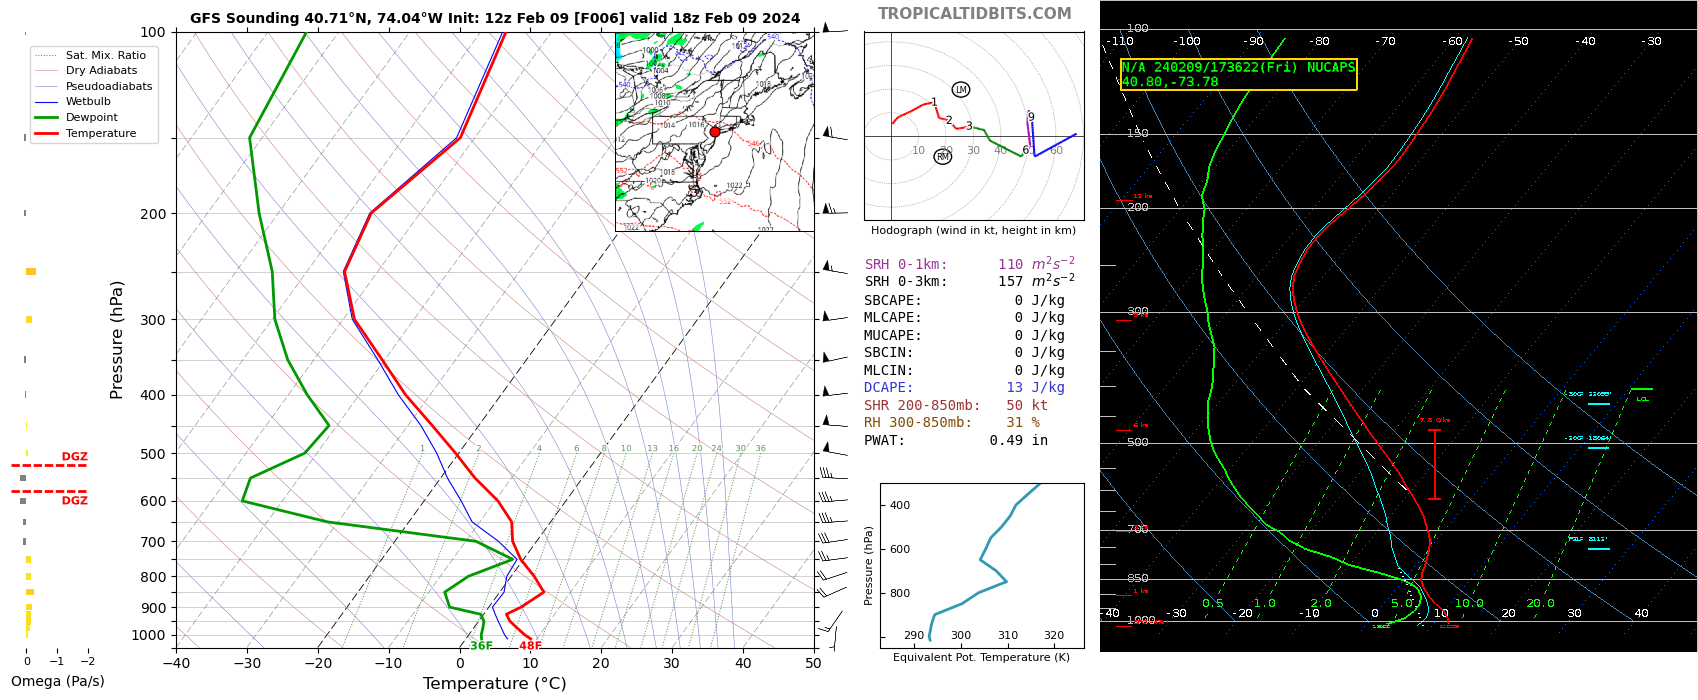
After an outage of about a week brought on by an anomaly in NOAA-20 (since fixed), NUCAPS profiles have re-appeared in AWIPS workstations, starting with the 1713 UTC overpass over the Eastern United States, shown above. One use for NUCAPS is to gauge how well a forecast is evolving. For example, consider the point near New York City, highlighted by the circle in the image above. The 1200 UTC sounding from OKX (Upton, NY) is shown below.
Rawinsonde at Upton, NY, 1200 UTC on 9 February 2024 (Click to enlarge)GFS Forecast profiles near Upton NY from the 1200 UTC simulation, 00h, 06h and 12h. (Click to enlarge)
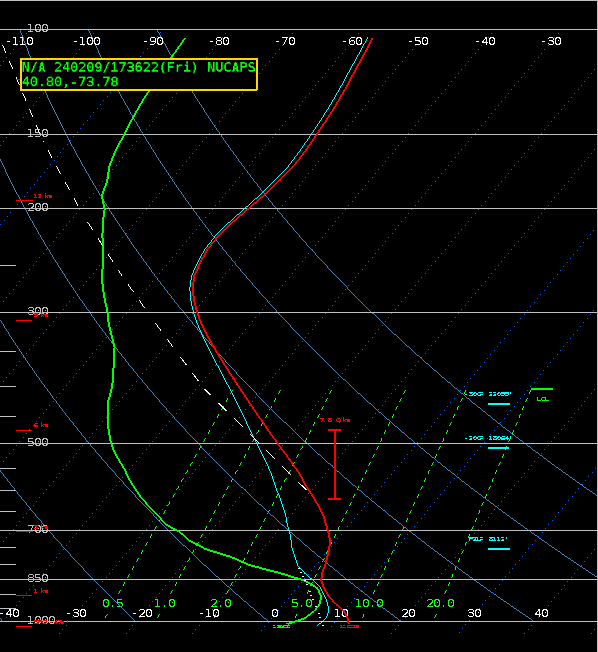
GFS forecasts for the profile show a considerable change between 1200 and 1800 UTC valid times (i.e., 00h and 06h) as shown above; in particular strong drying aloft is indicated. NUCAPS profiles can help a forecaster understand if the model evolution is occurring in reality. The NUCAPS profile below, from the point circled in black at top (the profile to the right in the figure below), does show significant drying aloft by 1800 UTC that compares favorably aloft with the forecast profile (left). There are discrepancies closer to the boundary layer.
GFS Forecast Profile, 1800 UTC, and NUCAPS Profile, 1736 UTC, both near New York City, on 9 February 2024 (click to enlarge)
Welcome back NUCAPS profiles — and gridded NUCAPS fields!
The US Drought Monitor for islands in the western Pacific Ocean, below, shows moderate to severe drought in some of the islands, especially those farthest from the Equator. Is there anything on the horizon that might bring rains?MIMIC Total Precipitable Water fields, below, show mostly dry conditions over the western Pacific with... Read More
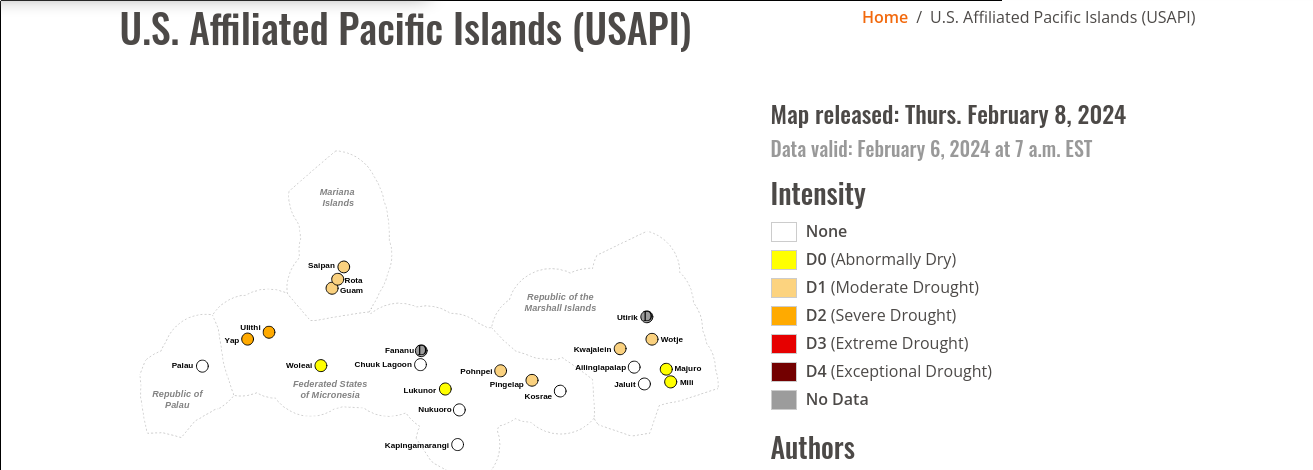
The US Drought Monitor for islands in the western Pacific Ocean, below, shows moderate to severe drought in some of the islands, especially those farthest from the Equator. Is there anything on the horizon that might bring rains?
Drought Monitor output for The Marianas, Micronesian and Marshall Islands, 6 February 2024 (Click to enlarge)MIMIC Total Precipitable Water, 1400 UTC 8 February to 1300 UTC 9 February 2024 (Click to enlarge)
MIMIC Total Precipitable Water fields, below, show mostly dry conditions over the western Pacific with the notable exception of an impulse moving westward at 5oN latitude from 175oW to 175oE in the animation above. It is approaching Majuro at the end of the animation above (Majuro is at 7oN 171oE). What are the chances of tropical development with that rapidly-moving system. Shear is generally low over the system, and decreasing, and a small vortex is apparent at 850 mb.
Shear and Shear Tendency over the western north Pacific Ocean, 1200 UTC on 9 February 2024 (Click to enlarge)
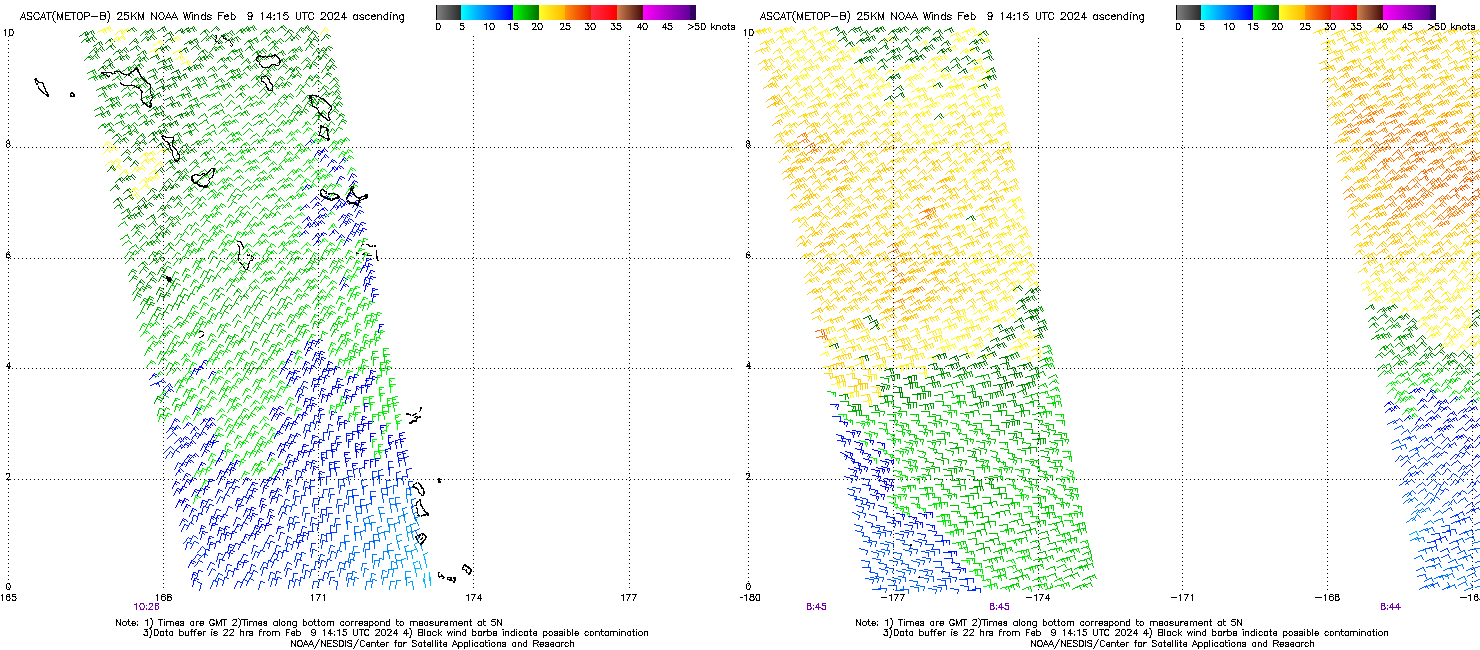
Scatterometry (from MetopB and MetopC), can show information about low-level circulations. In this case, for example, ASCAT winds from MetopB winds at 1036 UTC — the western swath shown below — suggest a shear line, as winds shift from northeasterly to northerly around 4oN Latitude. In addition, at the western edge of the swath at 0845 UTC, winds shift from southeasterly to northeasterly. That is, there is surface convergence near 3oN, 177oW.
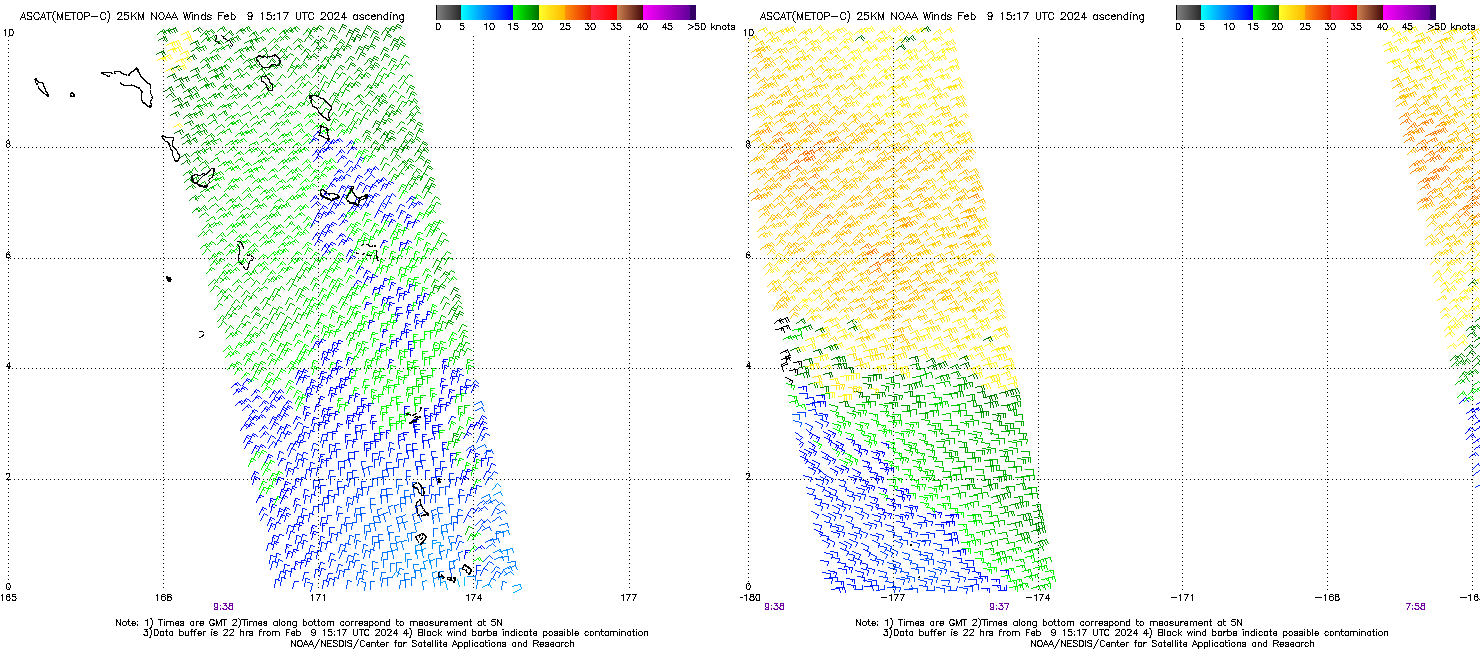
MetopB ASCAT swaths, 0843 UTC (right hand side) and 1026 UTC (left hand), 9 February 2024 (Click to enlarge)MetopC ASCAT swaths, 0938 UTC, 9 February 2024 (Click to enlarge)
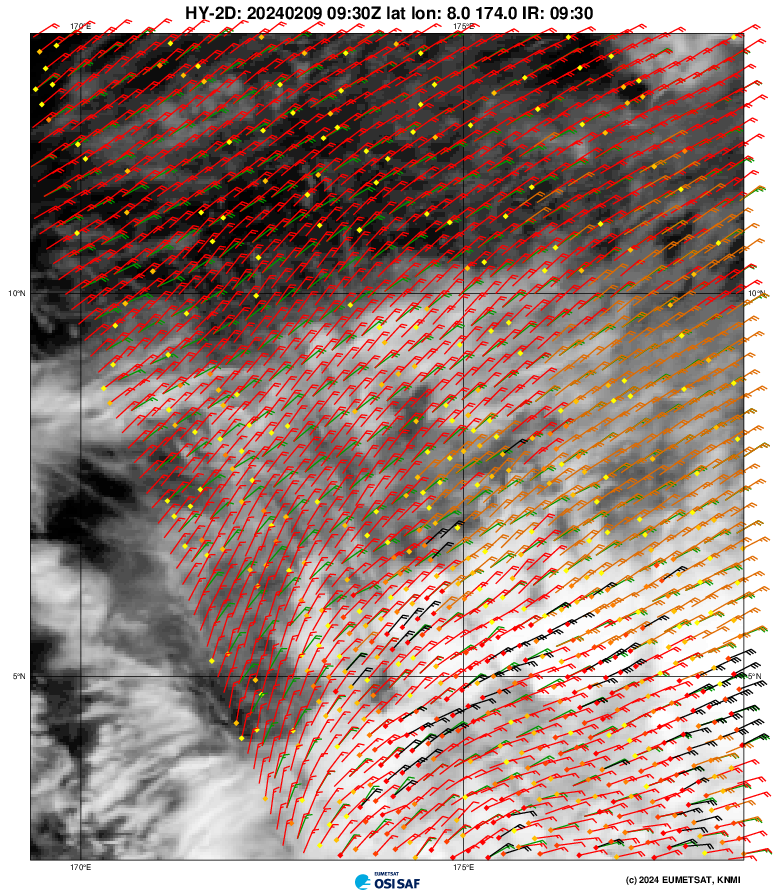
MetopC ASCAT winds at 0938 UTC, above, show the shear line perhaps more distinctly just east of 180o. The stronger winds — plotted in yellow — are from the east-northeast. The weaker winds in blue from the southeast. In the western swath, winds shift gradually from northeasterly north of 6oN to more northerly south of about 3oN. You will notice that a gap in observations is apparent just west of the dateline in both MetopB and MetopC ASCAT plots. Data from HY-2C can fill in region as shown below (from this website) shows the northeast winds curving to northerly winds.
HY-2D scatterometry winds, 0930 UTC, 9 February 2024 (Click to enlarge)
A conclusion one might draw is that a region of enhanced moisture will continue to propagate (without much further development) across the tropical Pacific with an enhanced shower threat south of 10oN from 170oE to 150oE over the next few days.
The Storm Prediction Center placed portions of the upper Midwest United States in a marginal risk of severe weather on 8 February 2024 and issued two mesoscale discussion on the thunderstorm development, one at 2053 UTC, one at 2345 UTC. The graphic from the 2053 UTC MD is shown below. The animation above shows clean window infrared imagery overlain by the Level... Read More
GOES-16 Band 13 infrared (10.3 µm) imagery and clear-sky derived Lifted Index (scaled from -5 to 10), 1751-2246 UTC on 8 February 2024 (Click to enlarge)
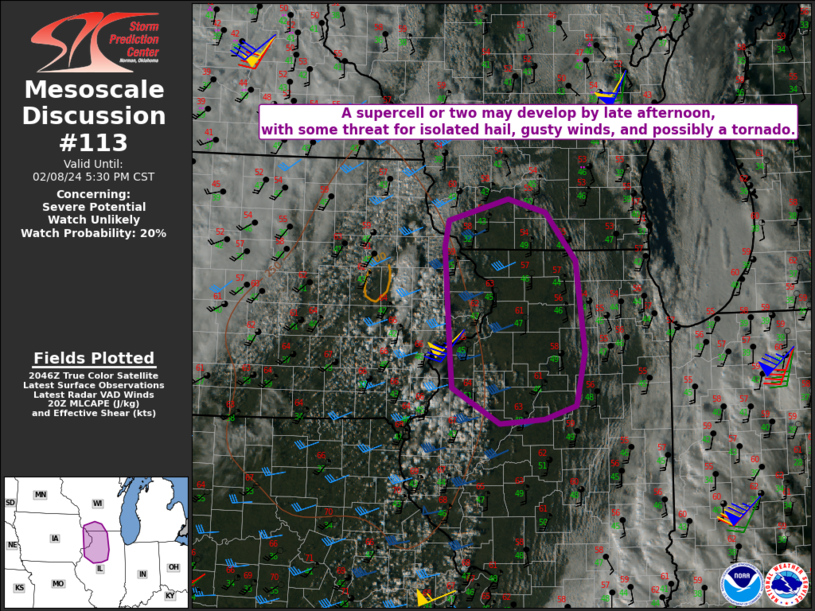
The Storm Prediction Center placed portions of the upper Midwest United States in a marginal risk of severe weather on 8 February 2024 and issued two mesoscale discussion on the thunderstorm development, one at 2053 UTC, one at 2345 UTC. The graphic from the 2053 UTC MD is shown below. The animation above shows clean window infrared imagery overlain by the Level 2 product Lifted Index (LI) that gauges the stability in the atmosphere. The AWIPS scaling for LI has been changed from the default to -5 to 10. Thunderstorms develop at the leading edge of the unstable air as it pushed into Wisconsin, and the first recorded February tornado in Wisconsin history was reported!
Mesoscale Discussion 113 issued 2053 UTC on 8 February 2024 (Click to enlarge)
GOES-16 Mid-level Water Vapor infrared imagery, below, shows the evolution of the atmosphere over the upper-midwest as the convection developed. As in the Window Channel imagery above, the swirl of the large upper-level cyclone moving through central Minnesota is obvious. A more subtle feature moving northeastward from northwest Missouri through southern Iowa and into northwest Illinois at the end of the animation might also be affecting the developing convection
GOES-16 Mid-level water vapor (Band 9, 6.95 µm) infrared imagery, 1806-2301 UTC on 8 February 2024 (Click to enlarge)
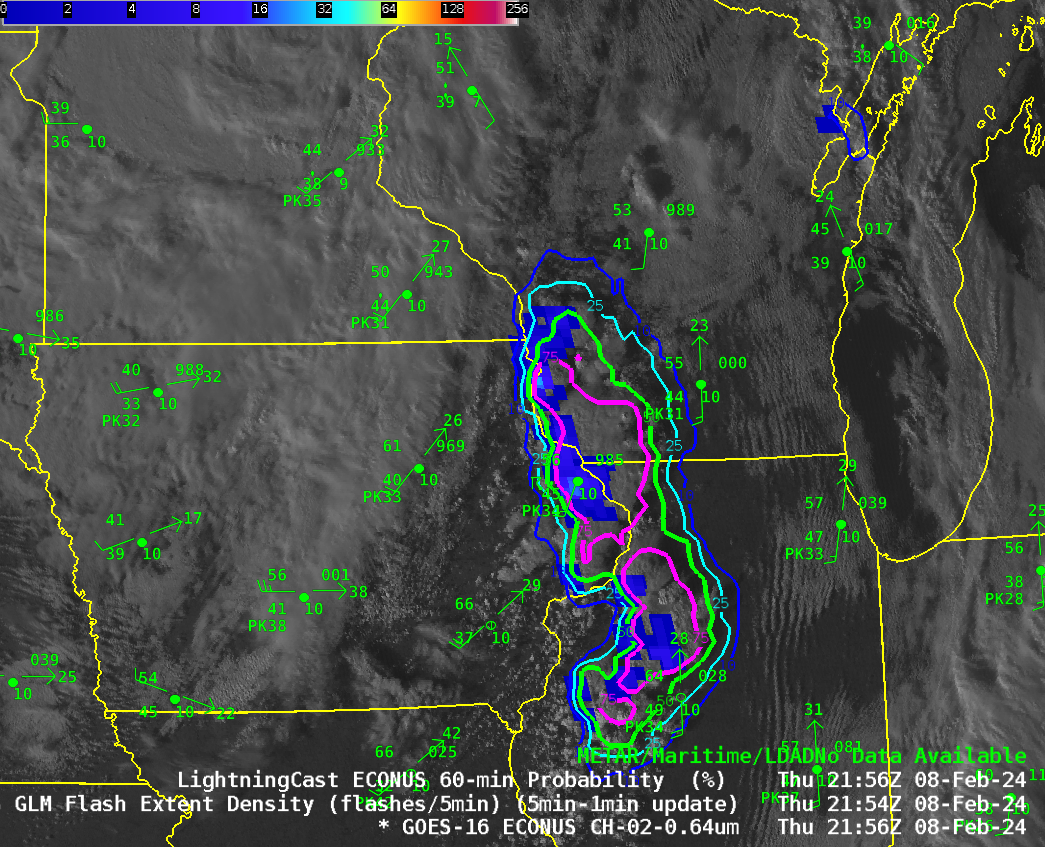
The animation below shows LightningCast probabilities contoured over visible imagery, and the probability product gave lead time in most cases during this unusual lightning event.
GOES-16 Visible Imagery (Band 2, 0.64 µm), LightningCast Probability, and surface observations, 1811-2306 UTC on 8 February 2024 (Click to enlarge)
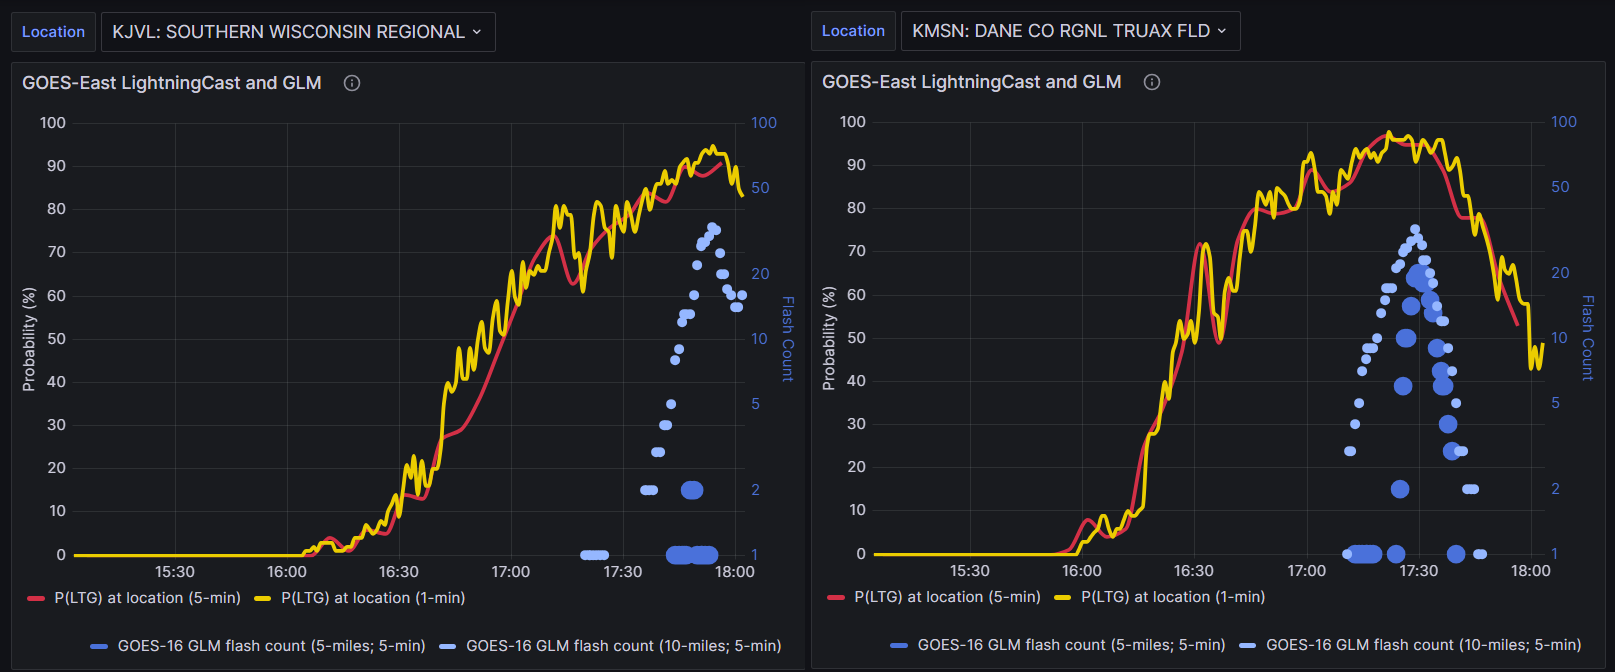
The LightningCast website (here) includes time series plots (‘Aviation Lightning Dashboards’) of Probabilities along with GLM observations. Data from Rock County (KJVL) and Dane County (KMSN) airports, below, show an increase in probabilities about an hour before the GLM observations occurred.
Time Series plots of LightningCast Probabilities and GLM observations at KJVL (left) and KMSN (right), 8 February 2024, times (CST) as indicated (x-axis) (Click to enlarge)
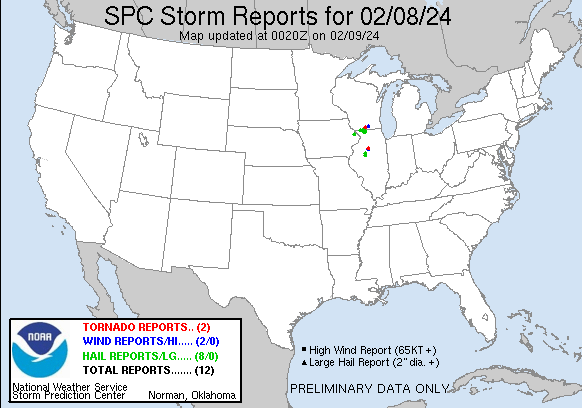
The most unusual aspect of this convective line in southern Wisconsin was the tornado it produced (link), as shown below. The 2337 UTC time of the tornado is after the animations shown above. Did ProbSevere give information for this tornado?
Preliminary SPC Storm Reports, 8 February 2024 (Click to enlarge)
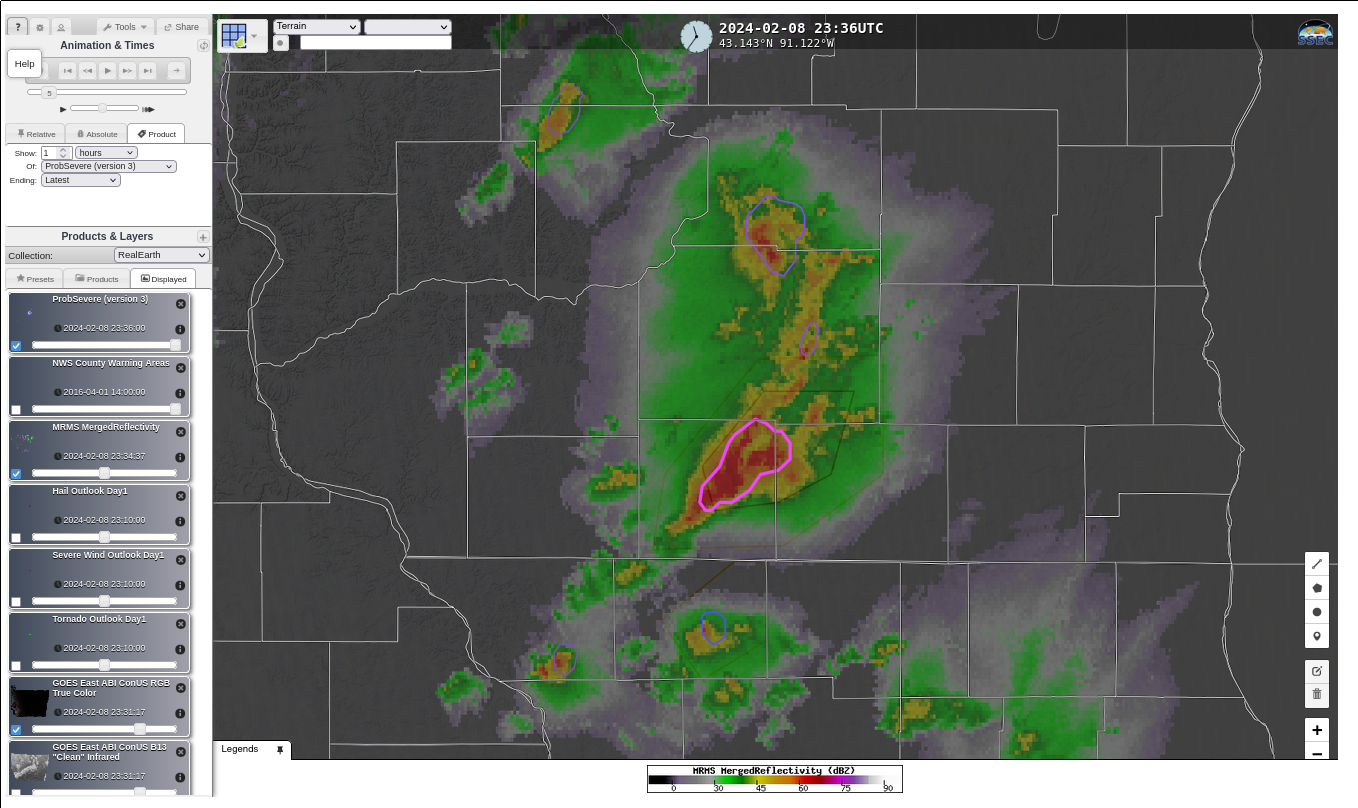
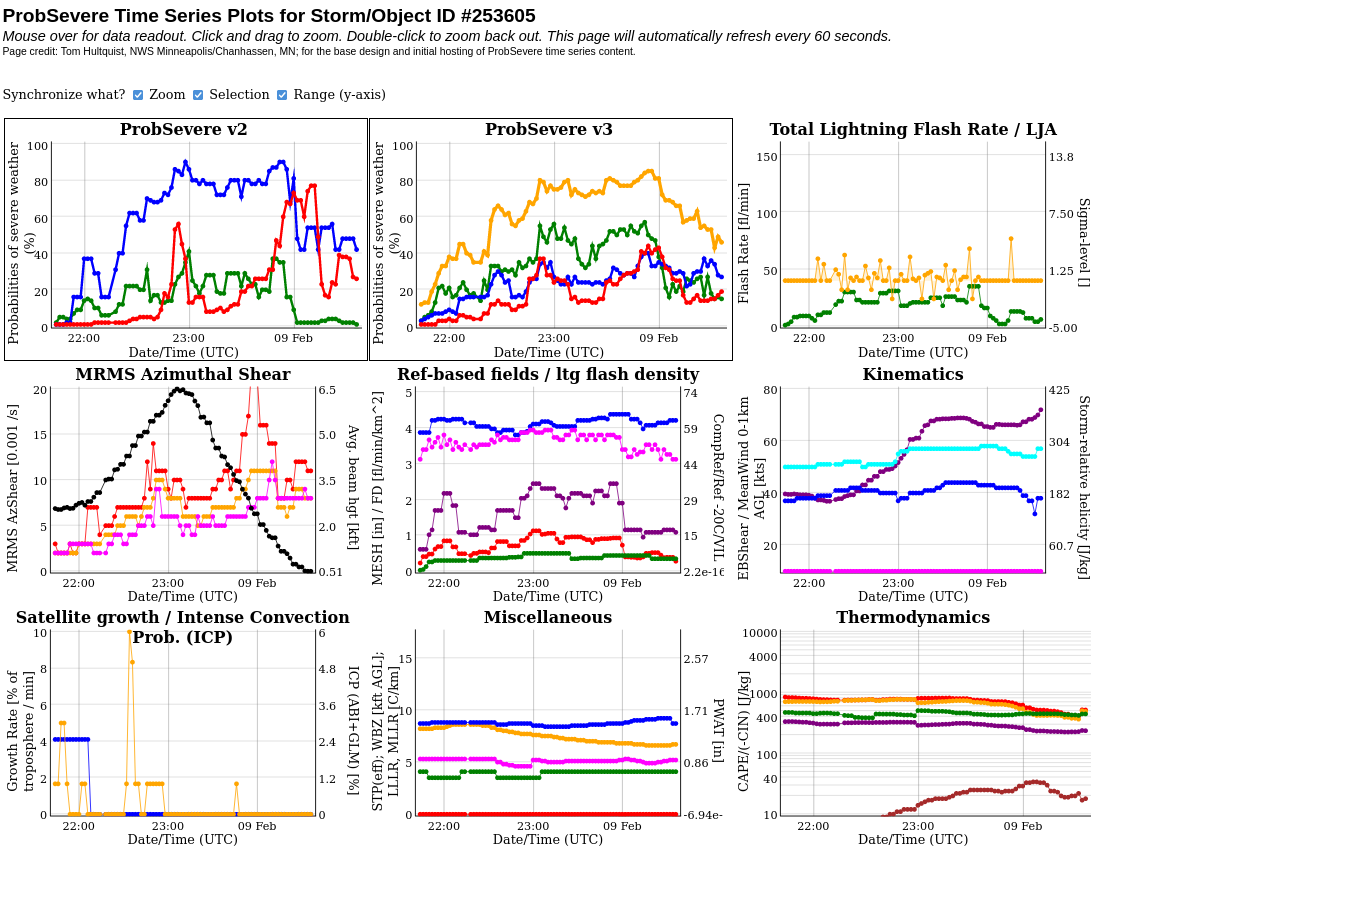
ProbSevere version 3 is available at this website and the screen-capture, below, shows the view at 2336 UTC, just before the tornado observation, when ProbSevere was at 70%. The time-series plot of the values within the ProbSevere object (#253605) is shown at bottom.
ProbSevere Version 3 display, 2336 UTC on 8 February 2024 (Click to enlarge)ProbSevere readouts for Object 253605 associated with the tornado in Green County, WI (Click to enlarge)
It’s difficult to isolate a signal in ProbSevere that unilaterally says a tornado is present. Storm-relative helicity (the purple line in the Kinematics plot) and Environmental Bulk Shear (the cyan line in the Kinematics plot) are suggestive, but no field shows a peak near 2337 UTC. Use products such a ProbSevere as a tool, along with others (satellite, radar, etc), to judge whether or not a warning is warranted. Note that a warning was issued for this cell at 2304 UTC on 8 February 2024.
GOES-16 Mesoscale Sector 2 observed the Midwest at 1-minute intervals on 8 February. Band 13 imagery, below (rescaled so that the coldest cloud brightness temperatures are -80o C vs. the default -109o C), shows the cold cloud tops associated with the strong convection moving from Lafayette into Green County in Wisconsin.
GOES-16 Mesosector 2 Band 13 infrared (10.3 µm) imagery , 2245-2345 UTC on 8 February 2024 (Click to enlarge)
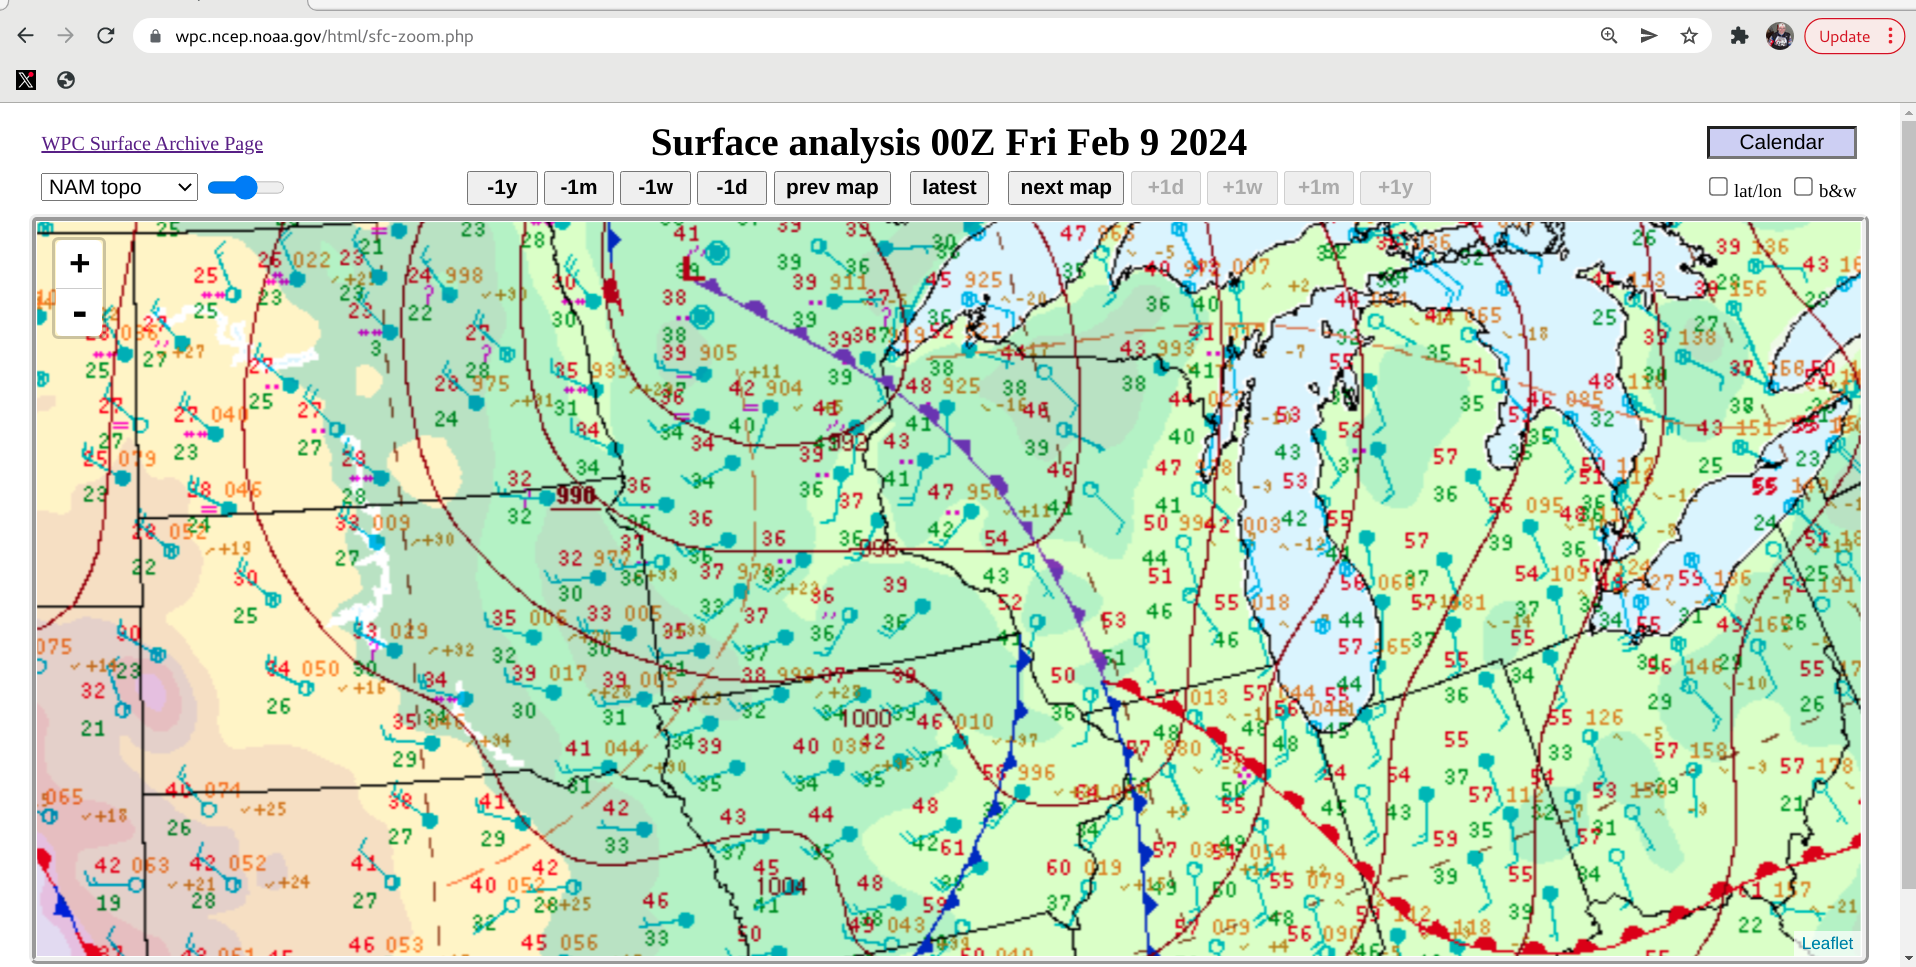
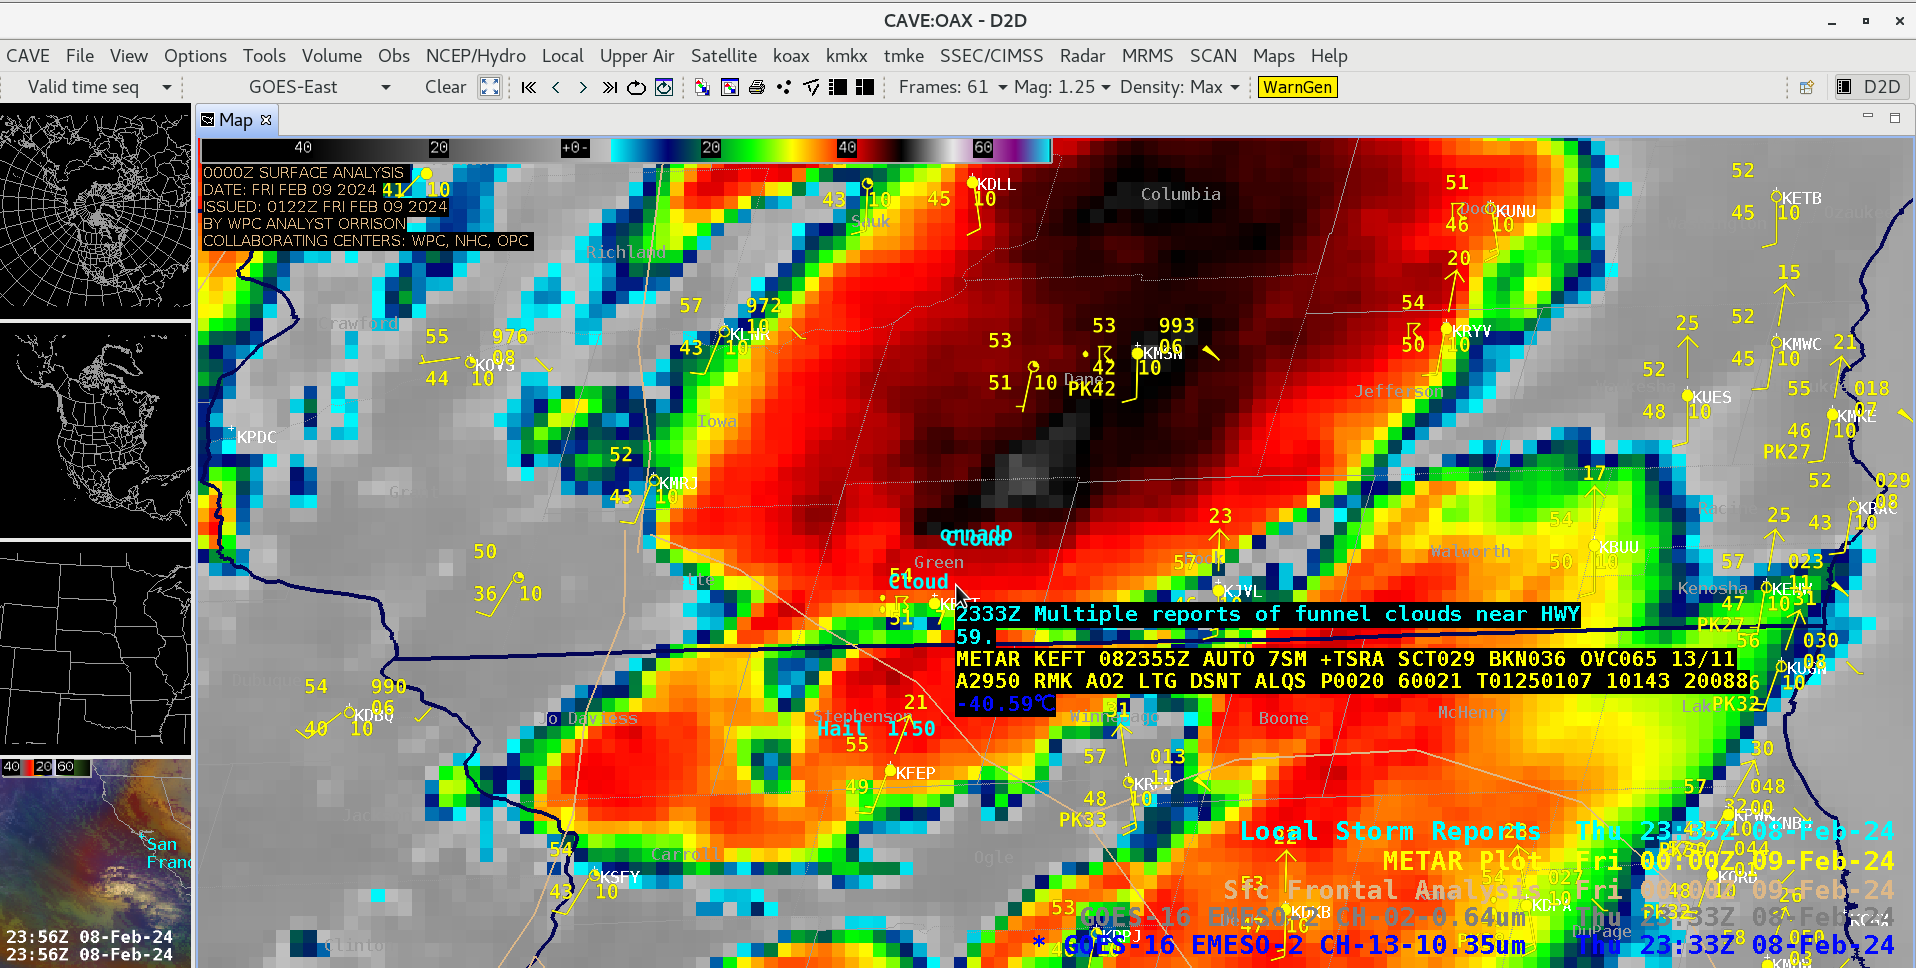
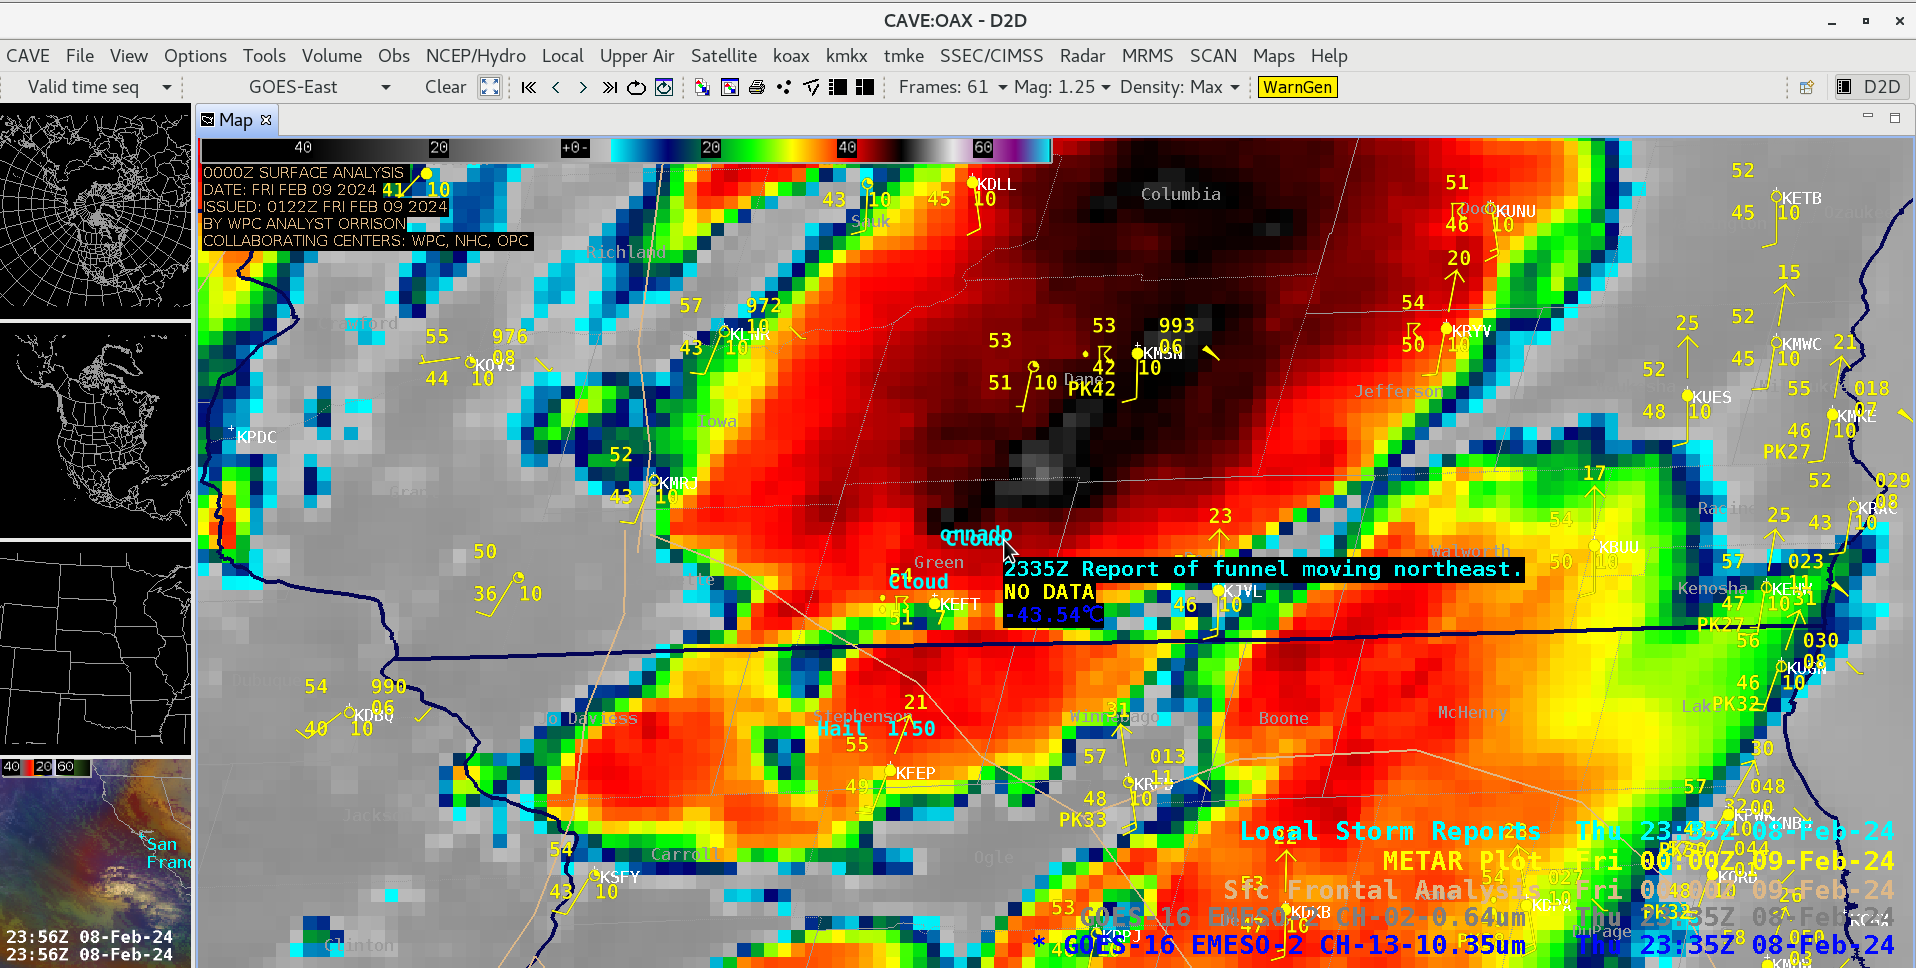
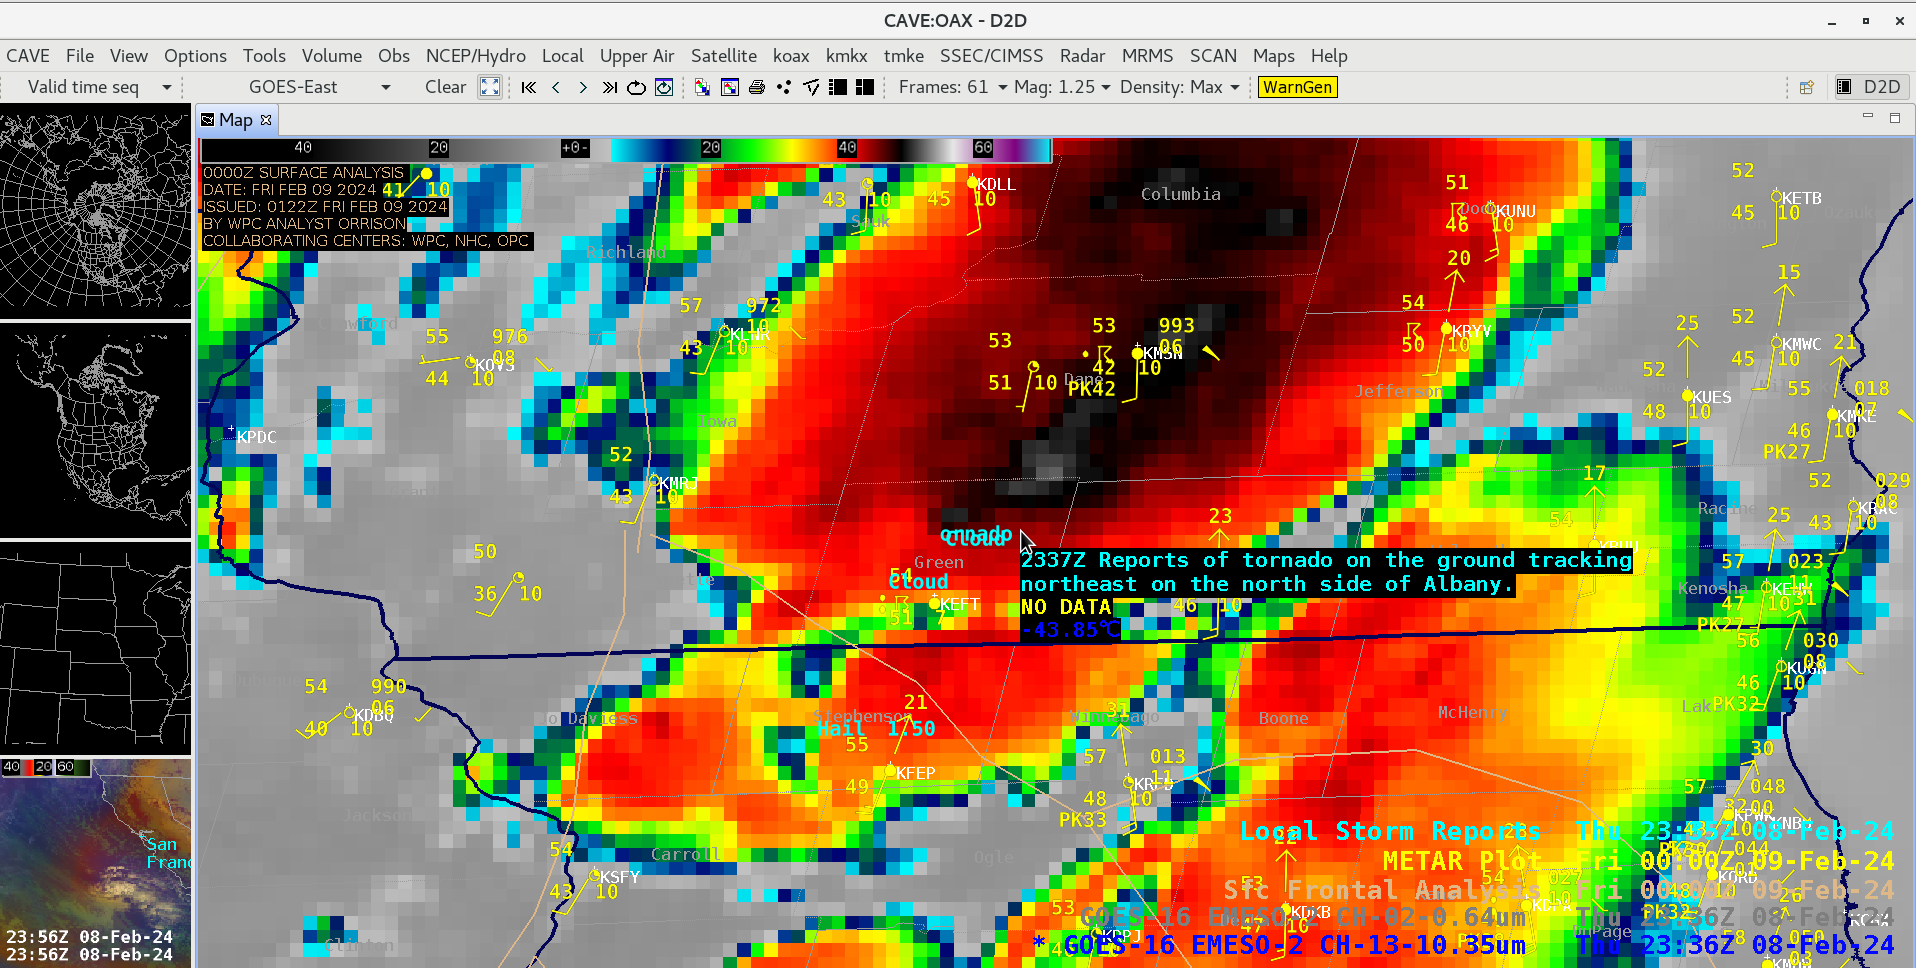
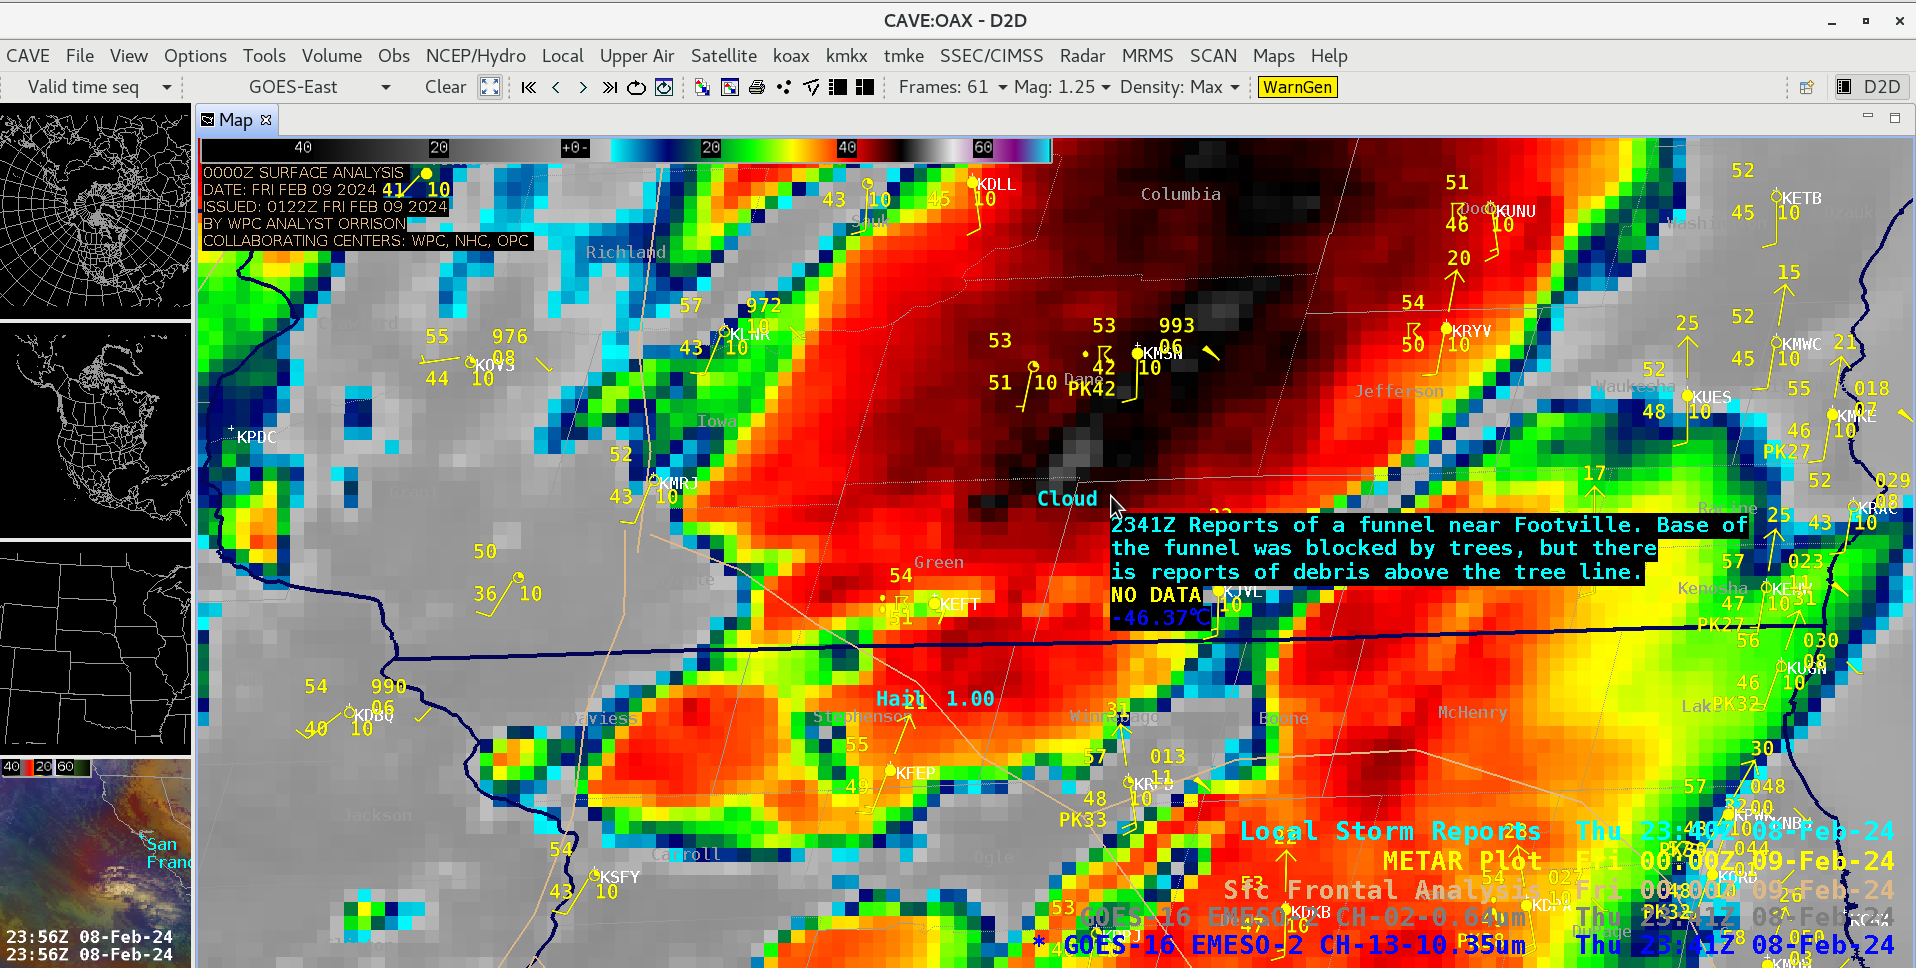
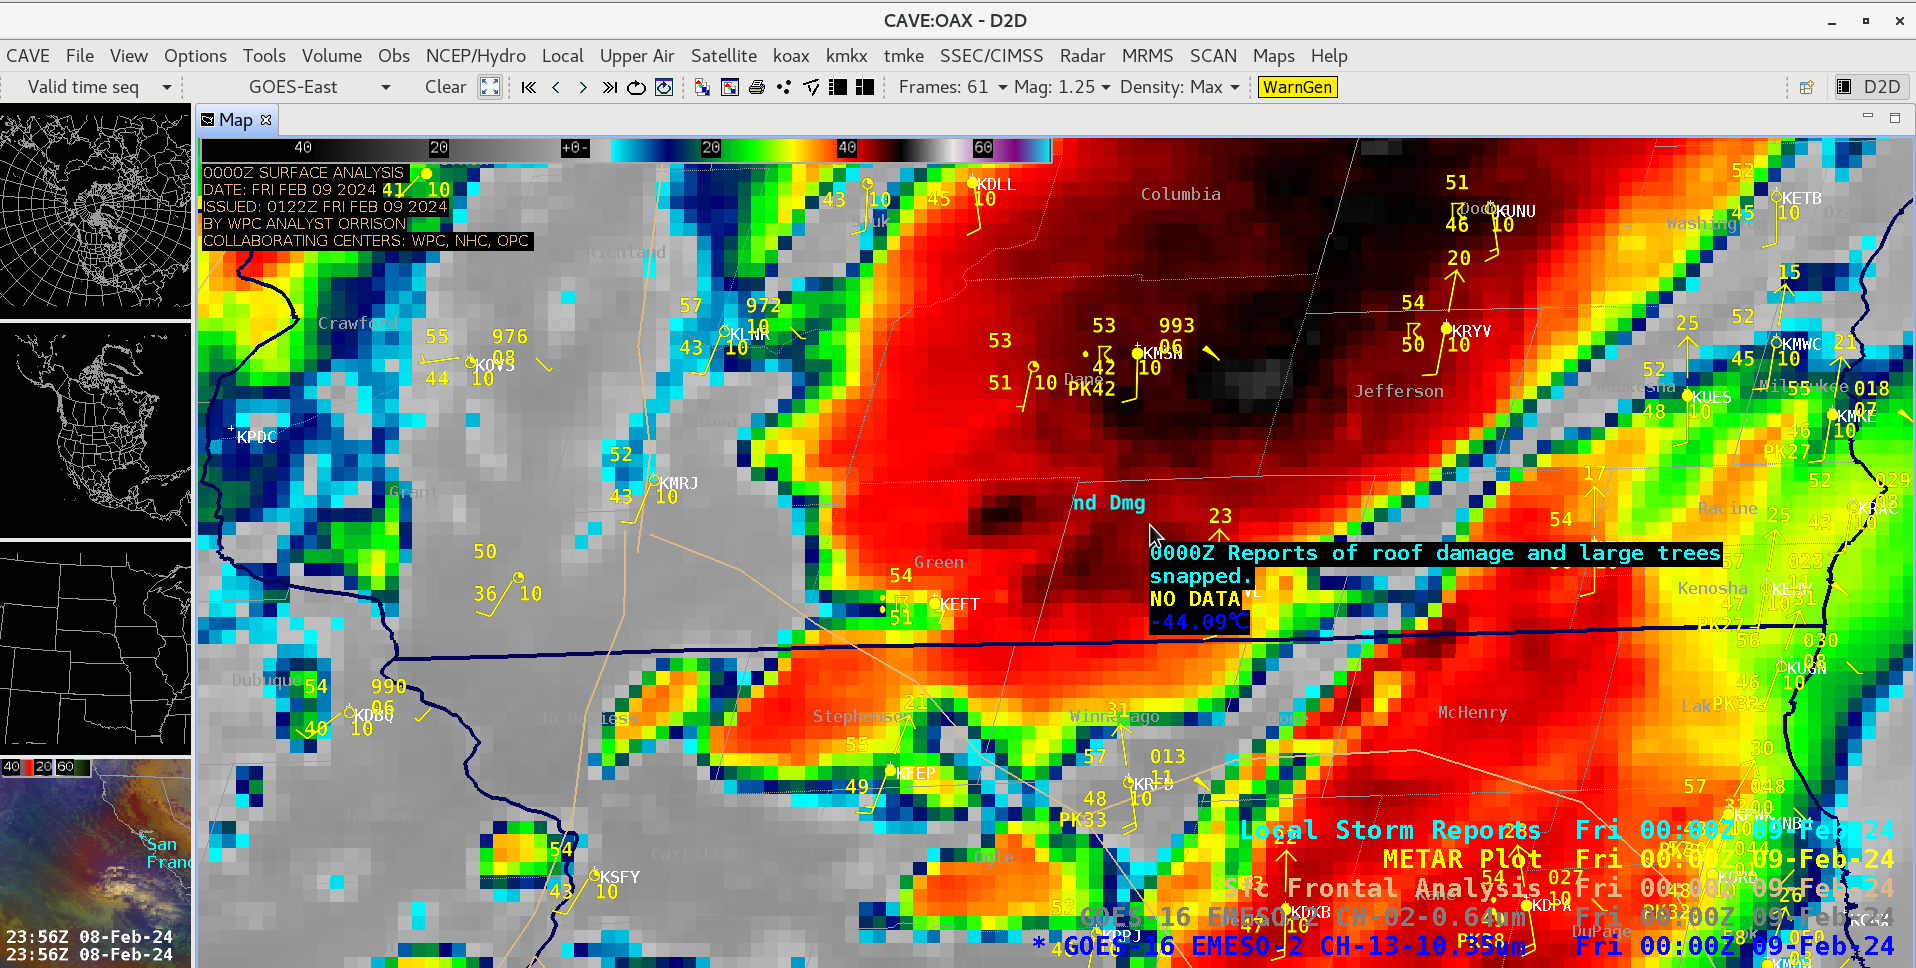
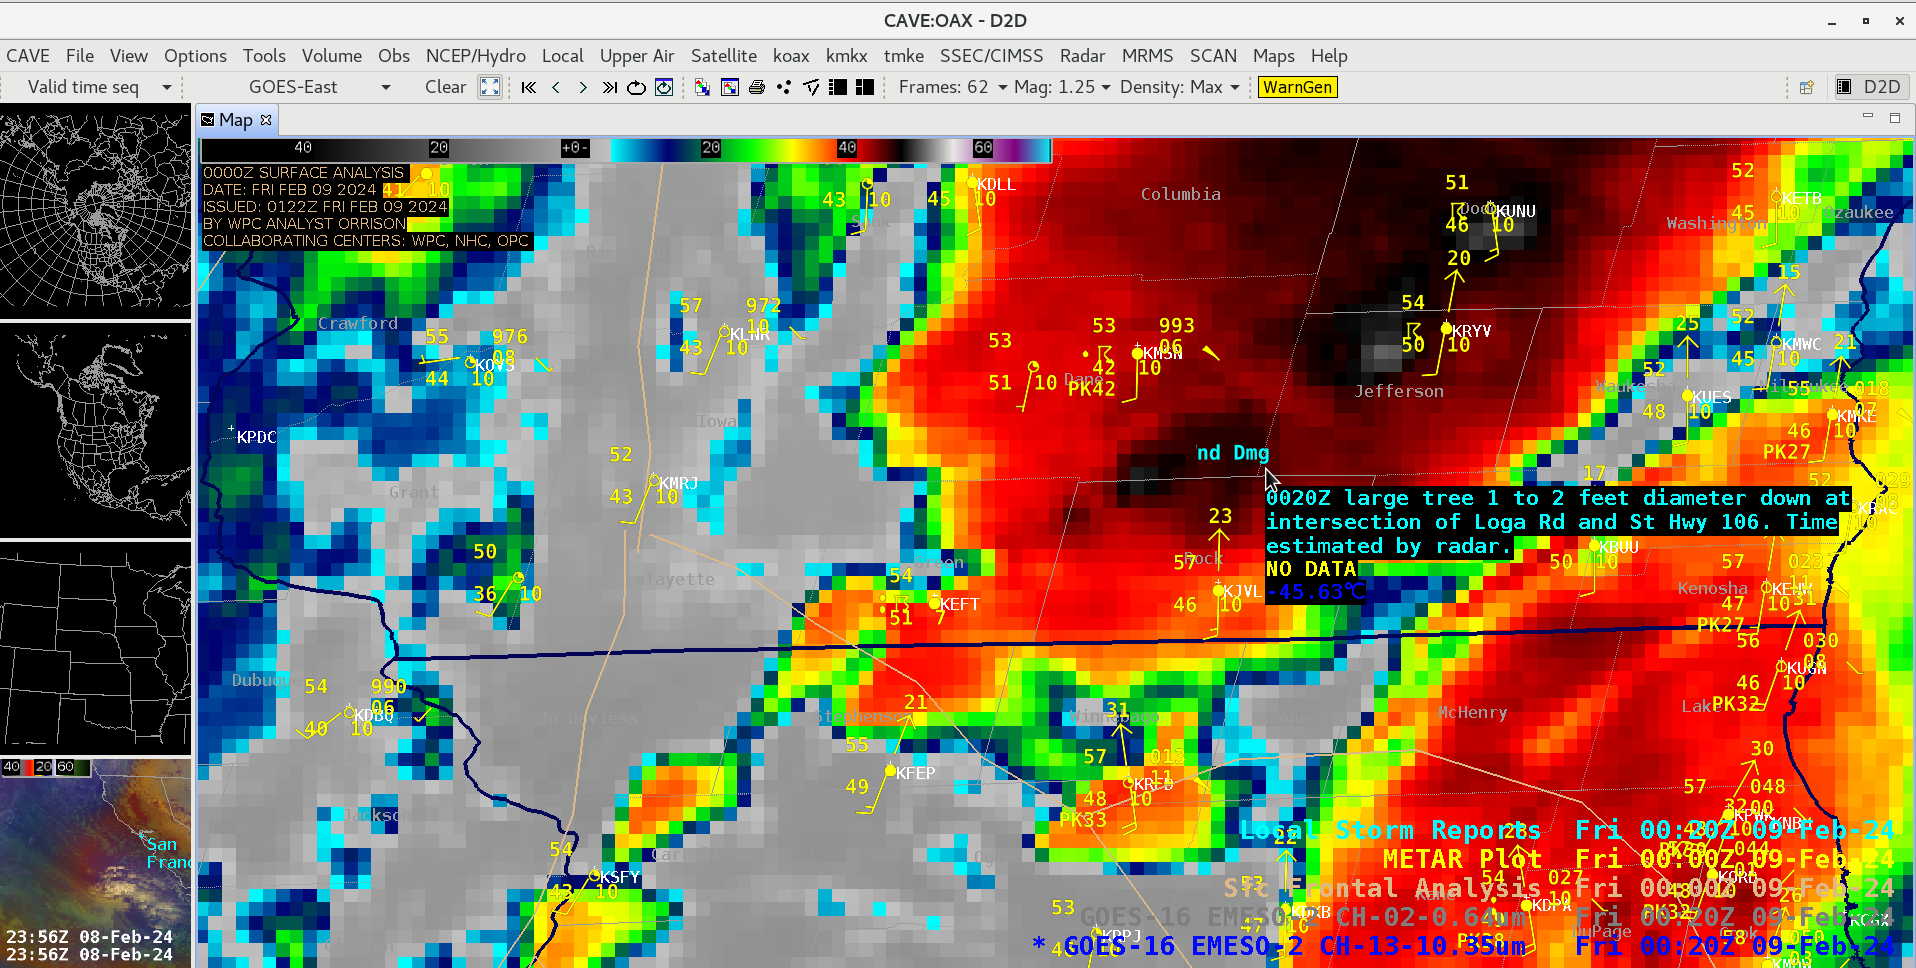
A closer look at 1-minute GOES-16 Visible and Infrared images centered over southern Wisconsin (below) included plots of Local Storm Reports — pulses of overshooting tops were evident in the vicinity of most of the reports of severe (or sub-severe) weather. The thunderstorms that produced wind/hail and two tornadoes across southern Wisconsin apparently developed just ahead of an approaching cold front / warm front intersection (WPC surface analysis). Here are a few AWIPS cursor samples of Local Storm Reports associated with the 2 tornadoes: 2333 UTC | 2335 UTC | 2336 UTC | 2341 UTC | 0000 UTC | 0020 UTC | Animation.
1-minute GOES-16 Visible and Infrared images with plots of surface reports, surface fronts and Local Storm Reports, from 2145 UTC on 08 February to 0111 UTC on 09 February (courtesy Scott Bachmeier, CIMSS) [click to play animated GIF | MP4]
1-minute GOES-16 ABI Sandwich Product with Tornado reports showing up in Northern Illinois as “T” and X for the eventual location of the tornado in Wisconsin. from 2100 UTC to 22:59 UTC on 08February (courtesy Mat Gunshor, CIMSS) [also available as a MP4]
The Sandwich Product is a composite image created by stacking visible light (0.64µm) and infrared (10.3 µm) channels. The resulting multi-dimensional image gives meteorologists and researchers an efficient way to study severe weather in near real-time with an added texture from the sandwich-like layers.
In this animation the preliminary tornado reports from SPC in Henry and Magnolia, Illinois are shown as a red “T” approximately when & where they were reported. The approximate location of the tornado on the north side of Albany, Wisconsin is shown as a red X at the end of the animation. The animation ends at 22:59 UTC, which is well before the tornado in Wisconsin was reported at 23:37 UTC (which was 5:37pm local, CST). The Sandwich Product is only useful during daylight hours.
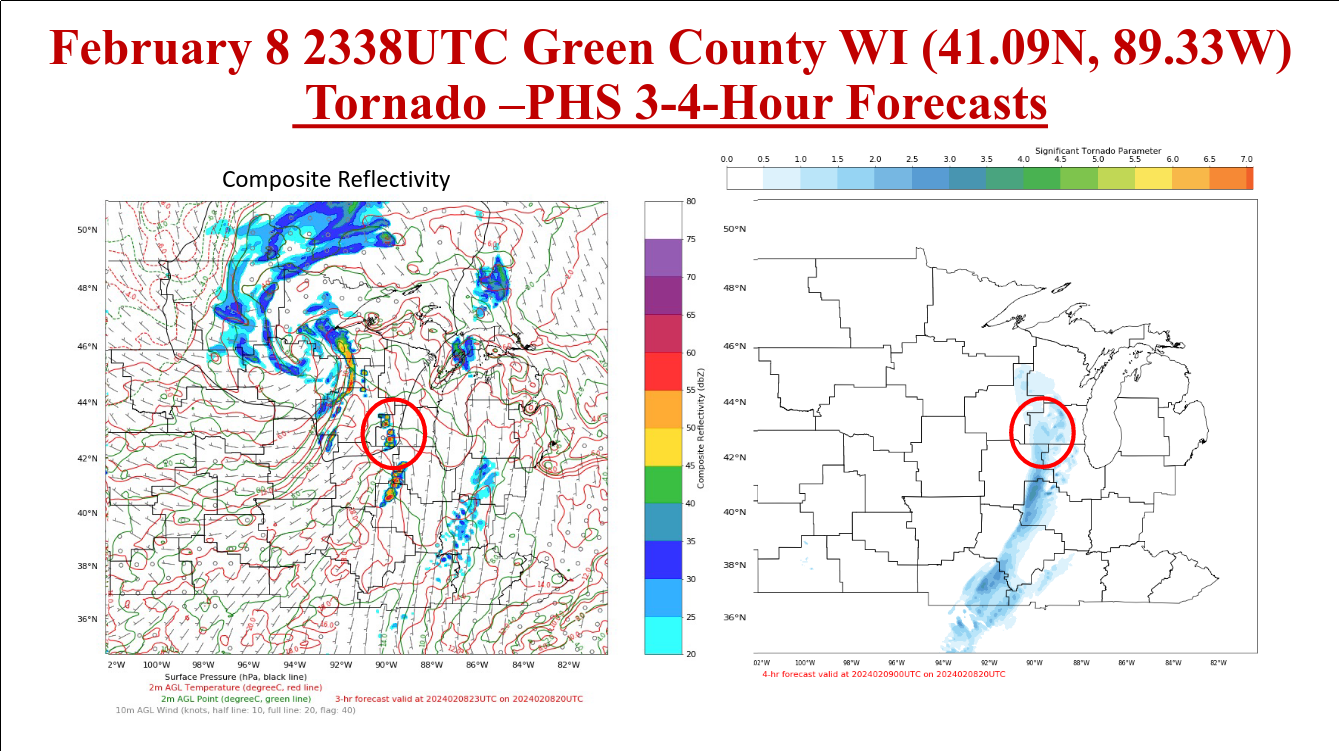
A model run that incorporates Polar Hyperspectral Soundings (that has been discussed on this blog, and at the Hazardous Weather Testbed) in the past gave good results with this strongly-forced event. The image below shows a 3-4 h forecast of composite reflectivity and Significant Tornado Parameter. Composite Reflectivity shows supercellular-like features, and also two separate locations of convection, one over southern Wisconsin, one over Illinois. The animations above (especially the Sandwich Product) also show those two main regions of convection. A model run initialized near 2000 UTC would include fine-scale moisture information from the early afternoon Polar overpasses that occurred that day (NOAA-20; NOAA-21), leading to a better definition of subsequent convection.
PHS model output forecasts of Composite Reflectivity (left) and Significant Tornado Parameter (right) valid at the time of the Evansville tornado (2338 UTC, Click to enlarge)
This event/set-up vaguely reminded the lead blog post author of this late-January 2023 event over Ohio, mostly because of the clear patch that allowed the used of derived stability indices!
The NWS forecast office in Milwaukee/Sullivan WI (WFO MKX) has a write-up on this event here, and a story map describing the event is available here.
A distinct hot thermal signature (black to yellow to red pixels) of a new Sundhnúkagígar fissure eruption on the Reykjanes Peninsula in southwestern Iceland was apparent in GOES-16 (GOES-East) Shortwave Infrared (3.9 µm) imagery on 08 February 2024 (above). Station identifier BIRK is Reykjavik Airport, and BIKF is Keflavik International Airport.Since the... Read More
GOES-16 Shortwave Infrared (3.9 µm) images, from 0550 -1610 UTC on 08 February [click to play animated GIF | MP4]
A distinct hot thermal signature (black to yellow to red pixels) of a new Sundhnúkagígar fissure eruption on the Reykjanes Peninsula in southwestern Iceland was apparent in GOES-16 (GOES-East) Shortwave Infrared (3.9 µm) imagery on 08 February 2024 (above). Station identifier BIRK is Reykjavik Airport, and BIKF is Keflavik International Airport.
Since the fissure eruption and subsequent lava flows began during the nighttime hours, the thermal signature also showed up well in GOES-16 Near-Infrared 1.61 µm and 2.24 µm imagery (below).
GOES-16 Near-Infrared “Snow/Ice” (1.61 µm, top), Near-Infrared “Cloud Particle Size” (2.24 µm, middle) and Shortwave Infrared (3.9 µm, bottom) images, from 0550-1030 UTC on 08 February [click to play animated GIF | MP4]

