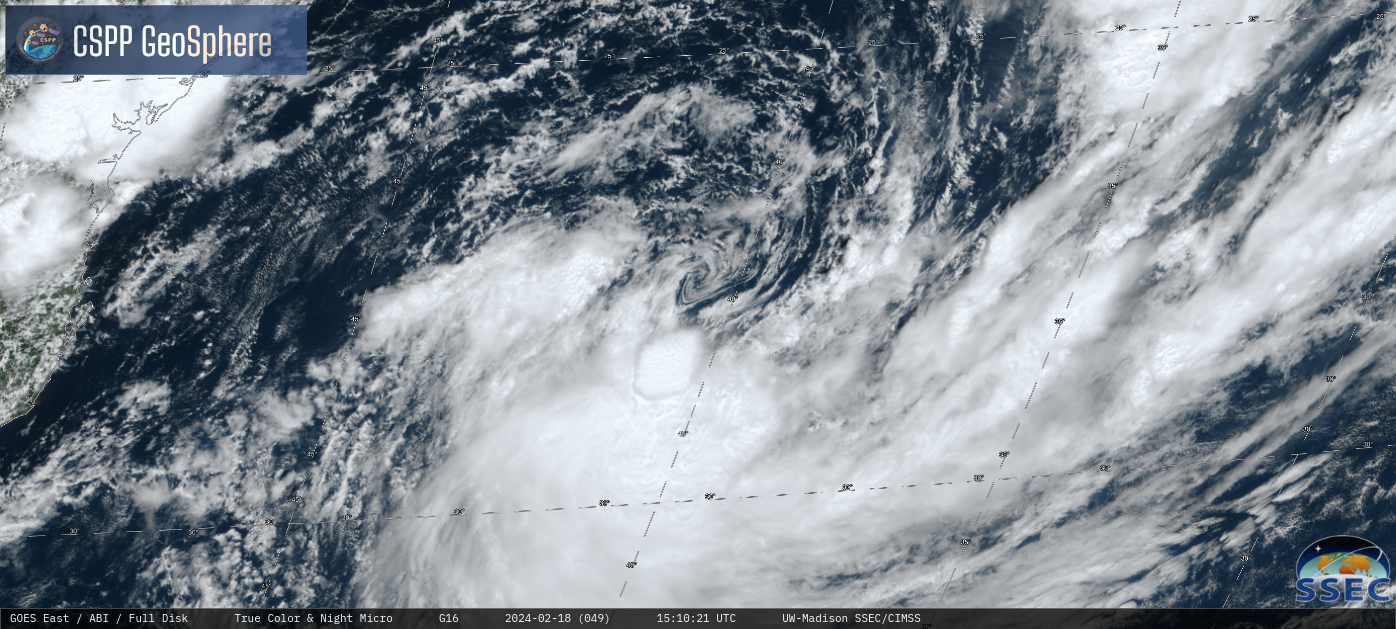
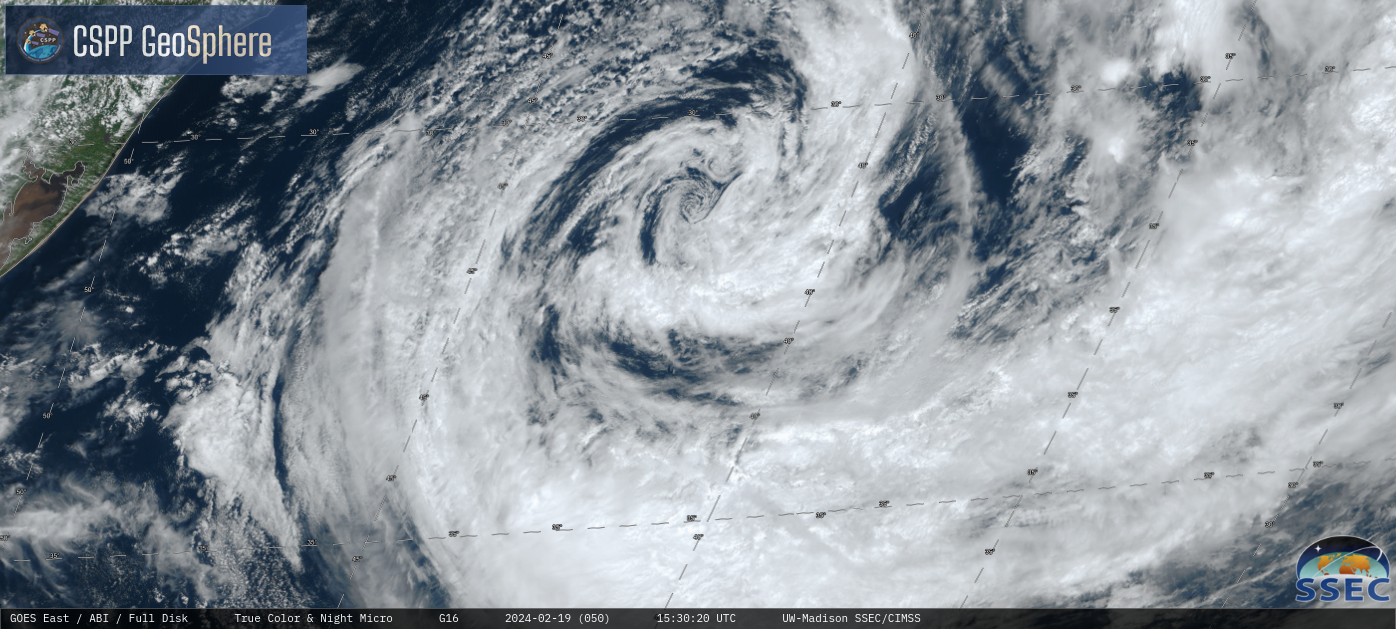
GOES-16 True Color RGB images from the CSPP GeoSphere site (above) showed multiple mesoscale vortices embedded within the exposed Low-Level Circulation Center (LLCC) of a Tropical Depression off the southeast coast of Brazil on 18 February 2024. This disturbance continued to organize and gradually intensify during the day and into the... Read More

GOES-16 True Color RGB images on 18 February [click to play MP4 animation]
GOES-16 True Color RGB images from the
CSPP GeoSphere site
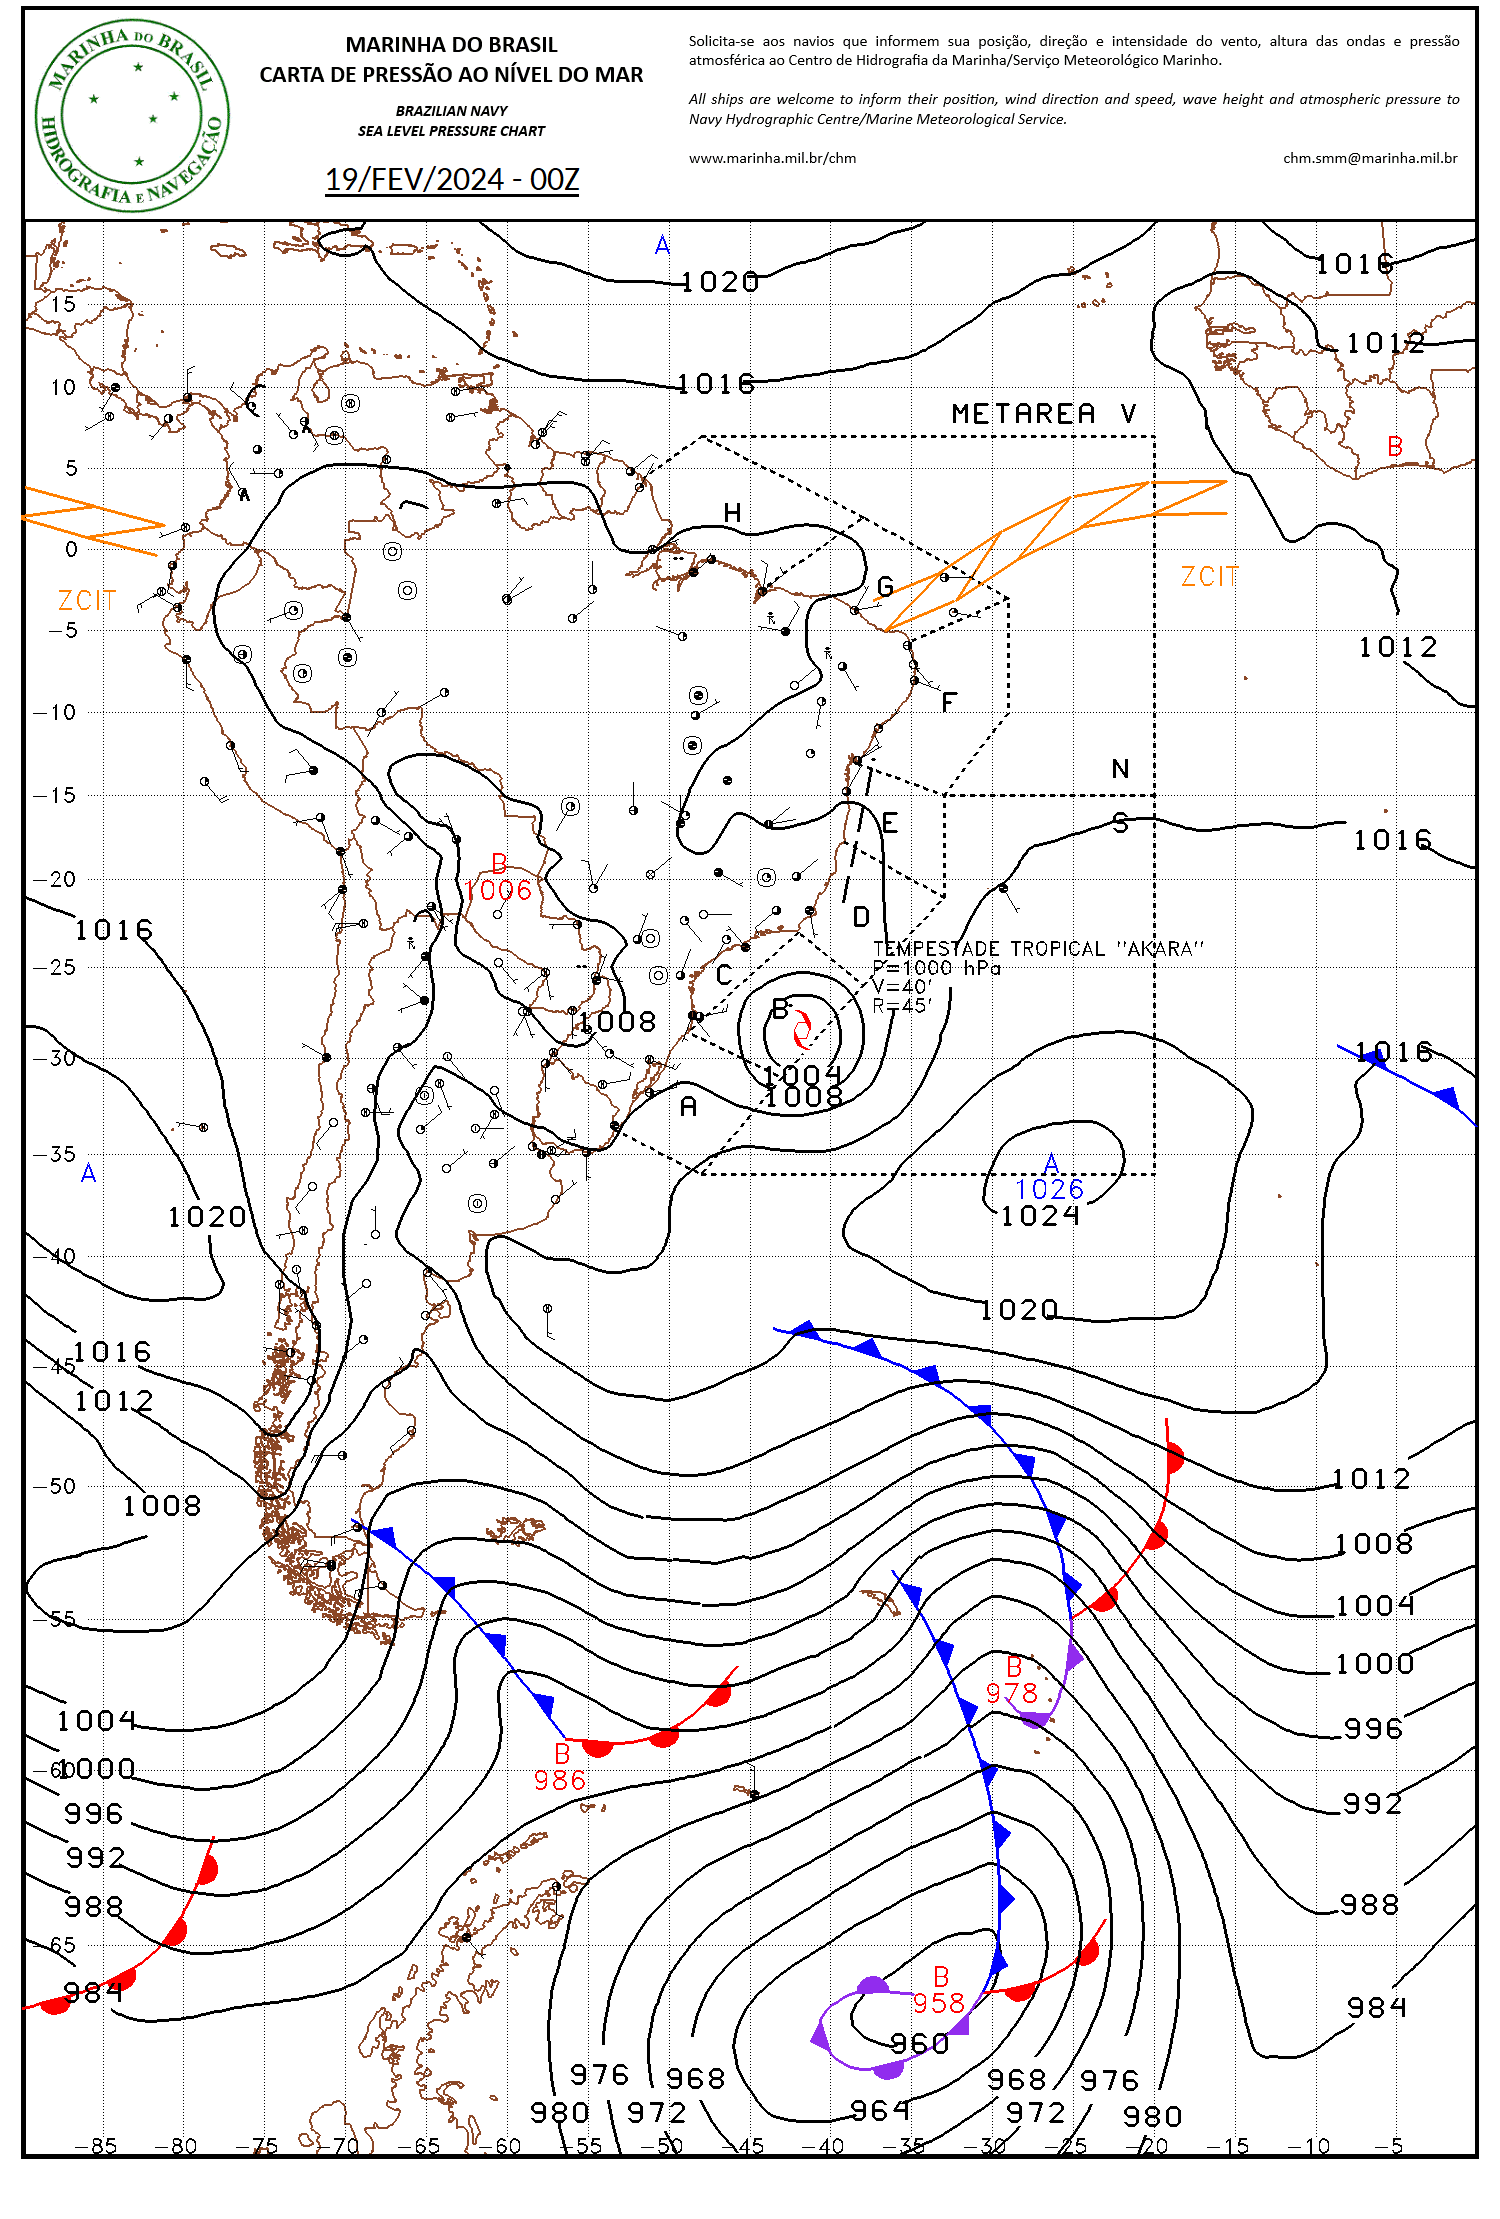
(above) showed multiple mesoscale vortices embedded within the exposed Low-Level Circulation Center (LLCC) of a Tropical Depression off the southeast coast of Brazil on 18 February 2024. This disturbance continued to organize and gradually intensify during the day and into the evening hours — with part of the LLCC being drawn beneath deep convection in the SW quadrant of the system — becoming
Tropical Storm Akará at 0000 UTC on 19 February (
surface analysis |
warning text). Tropical Storms in the South Atlantic are relatively rare — the last was
Tropical Storm Iba in 2019.
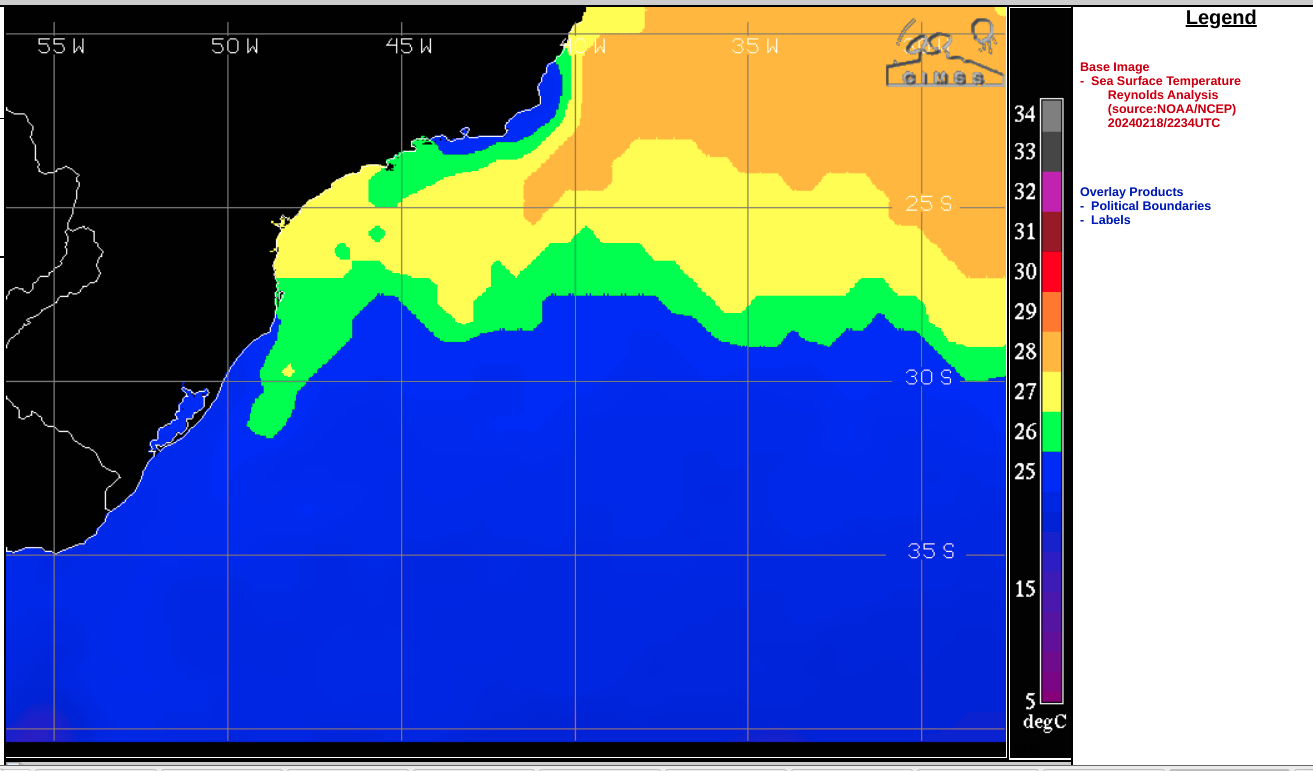
A sequence of Meteosat-10 Water Vapor images with an overlay of deep-layer wind shear from the CIMSS Tropical Cyclones site (below) indicated that Akará was located within a corridor of relatively low shear — a factor that favored intensification. Sea Surface Temperature values in the area where Akará first developed (near 25ºS latitude, 40ºW longitude) were around 27ºC.
Meteosat-10 Water Vapor images, with an overlay of deep-layer wind shear streamlines and contours, on 18 February [click to play animated GIF | MP4]
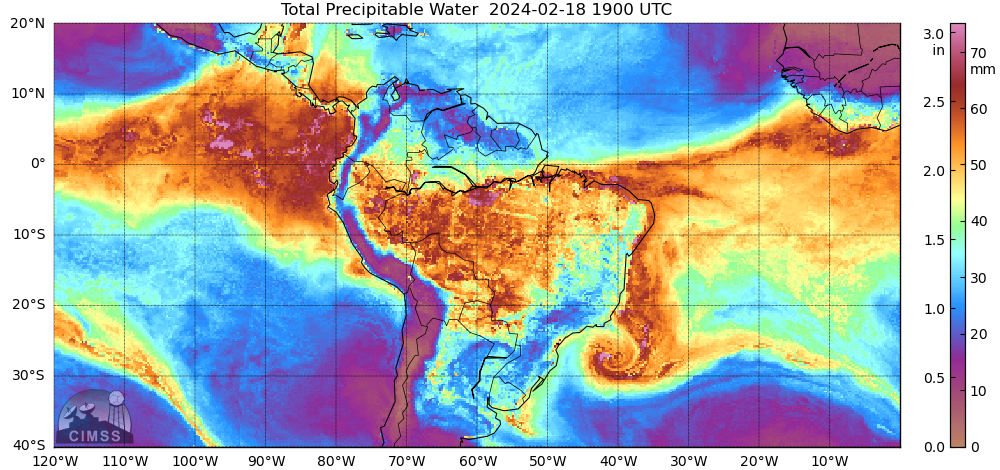
A 6-day animation of the
MIMIC Total Precipitable Water product — from 13-18 February
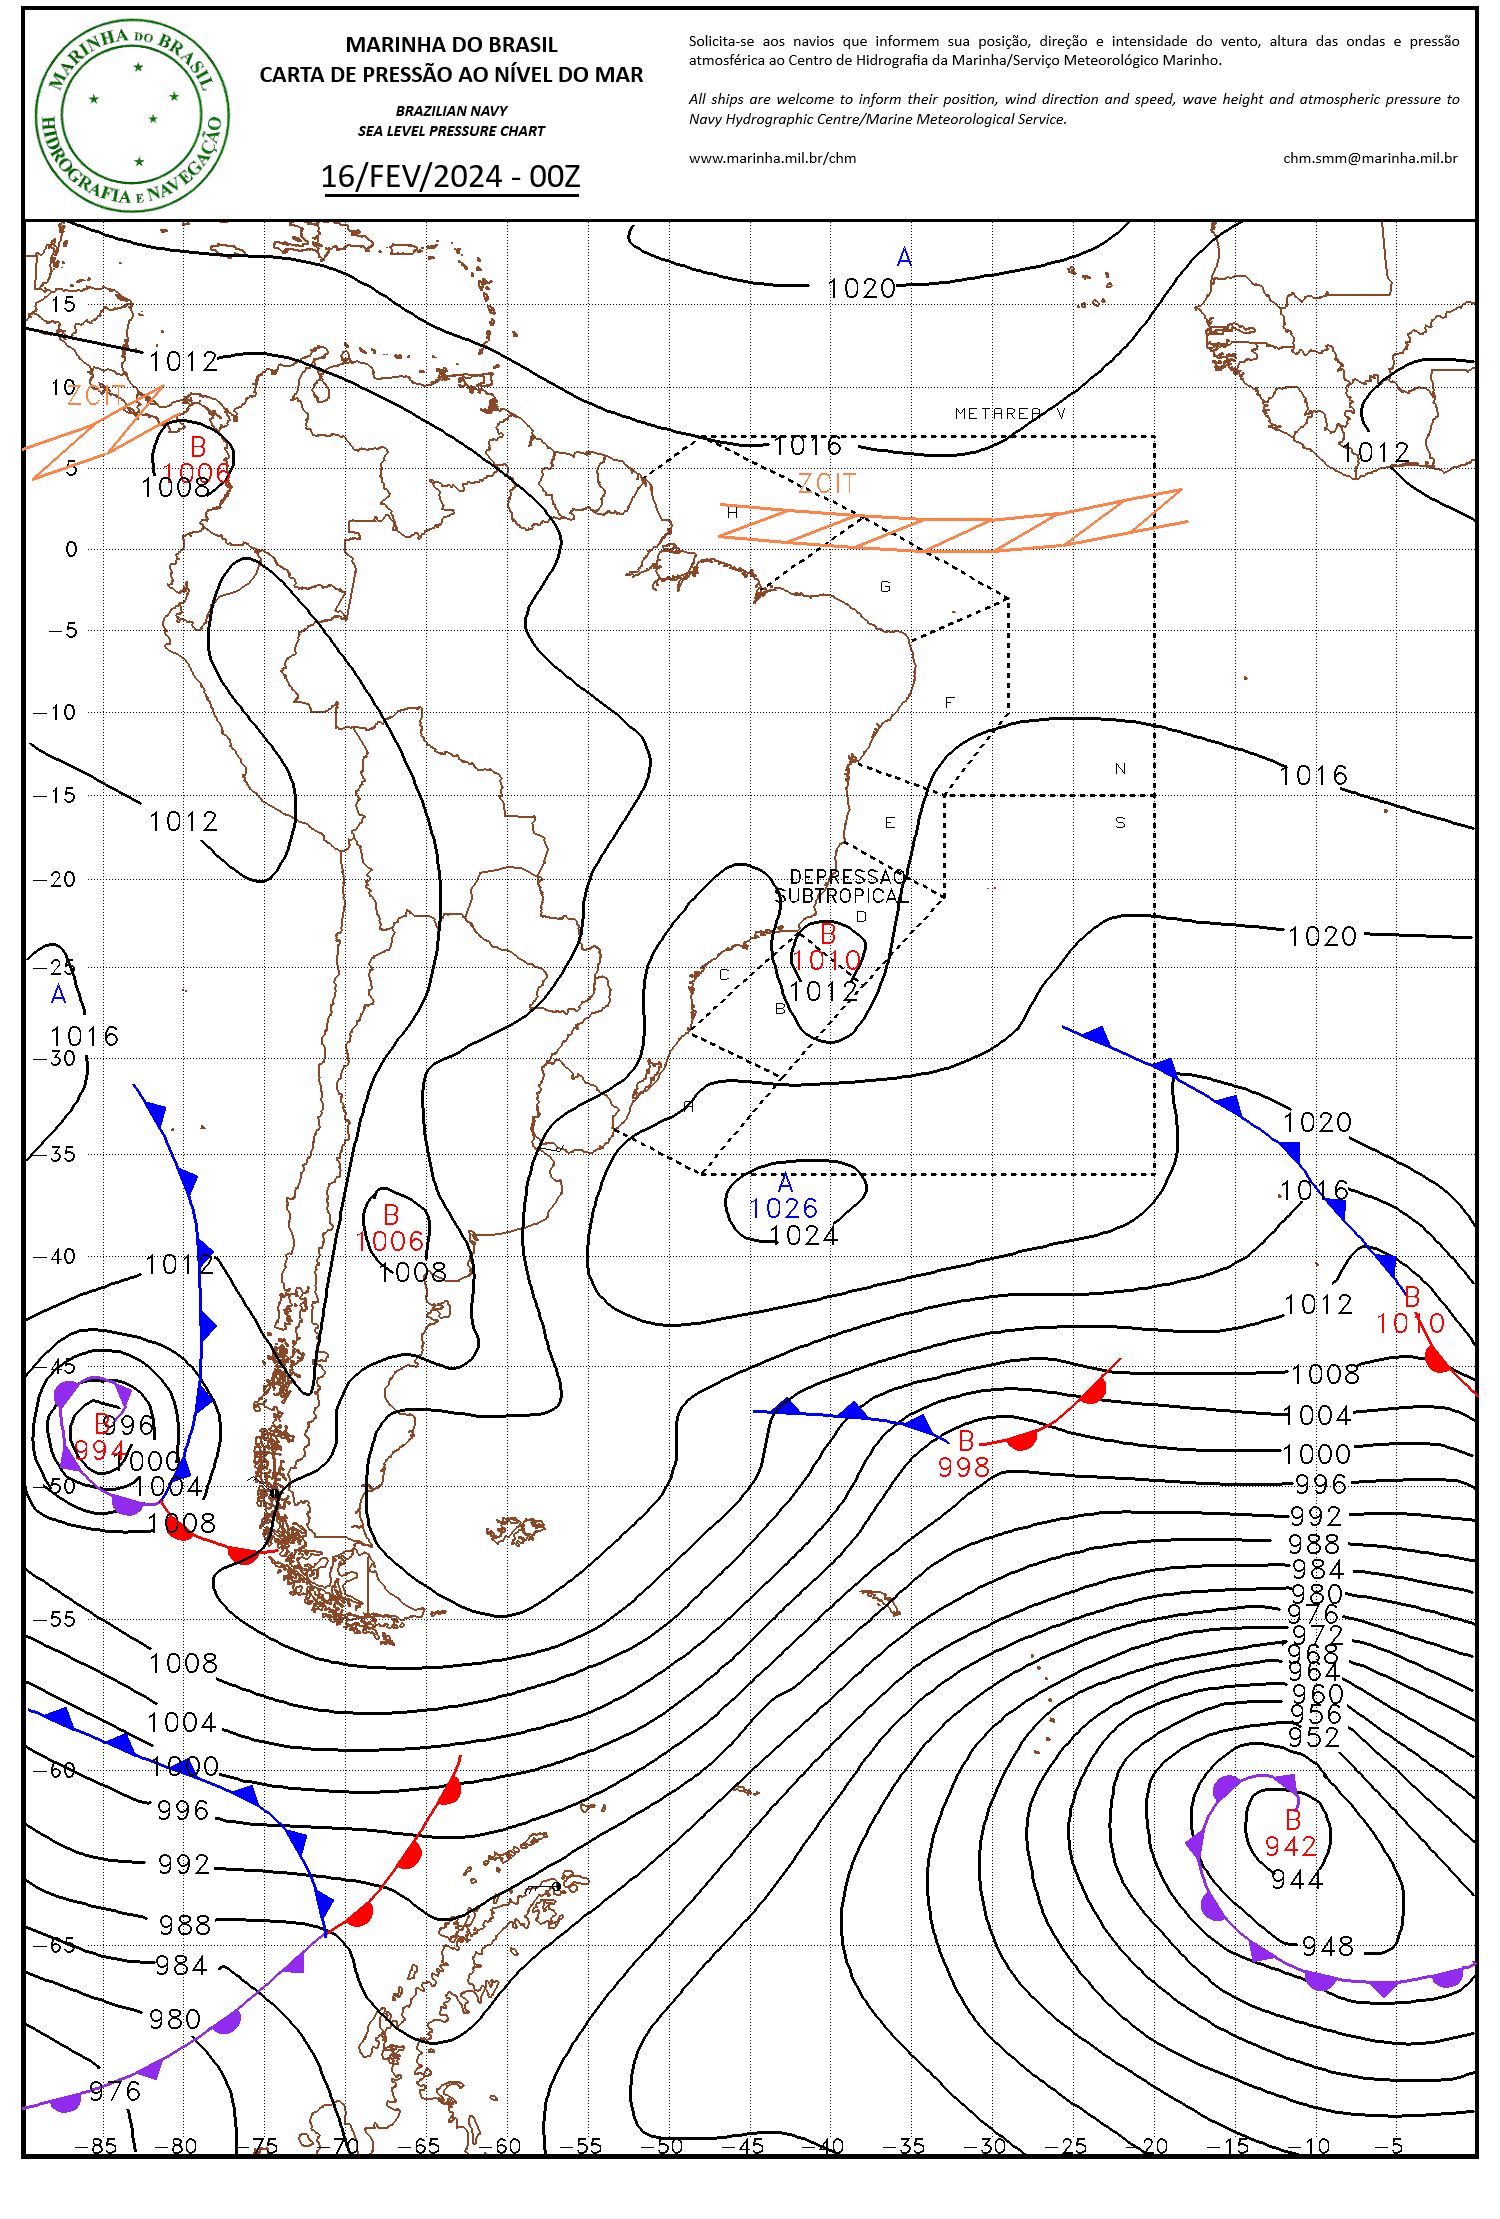
(below) — showed that Akará first began to develop along the trailing edge of a stalled cold front that had been moving northward (
surface analyses). Beginning on 15 February, a broad plume of moisture from the tropics began to move south along the coast of Brazil — which then fed into the circulation of the developing tropical disturbance (which formed as a subtropical depression on
16 February), helping it to intensify.
MIMIC Total Precipitable Water product, from 13-18 February [click to play animated GIF | MP4]
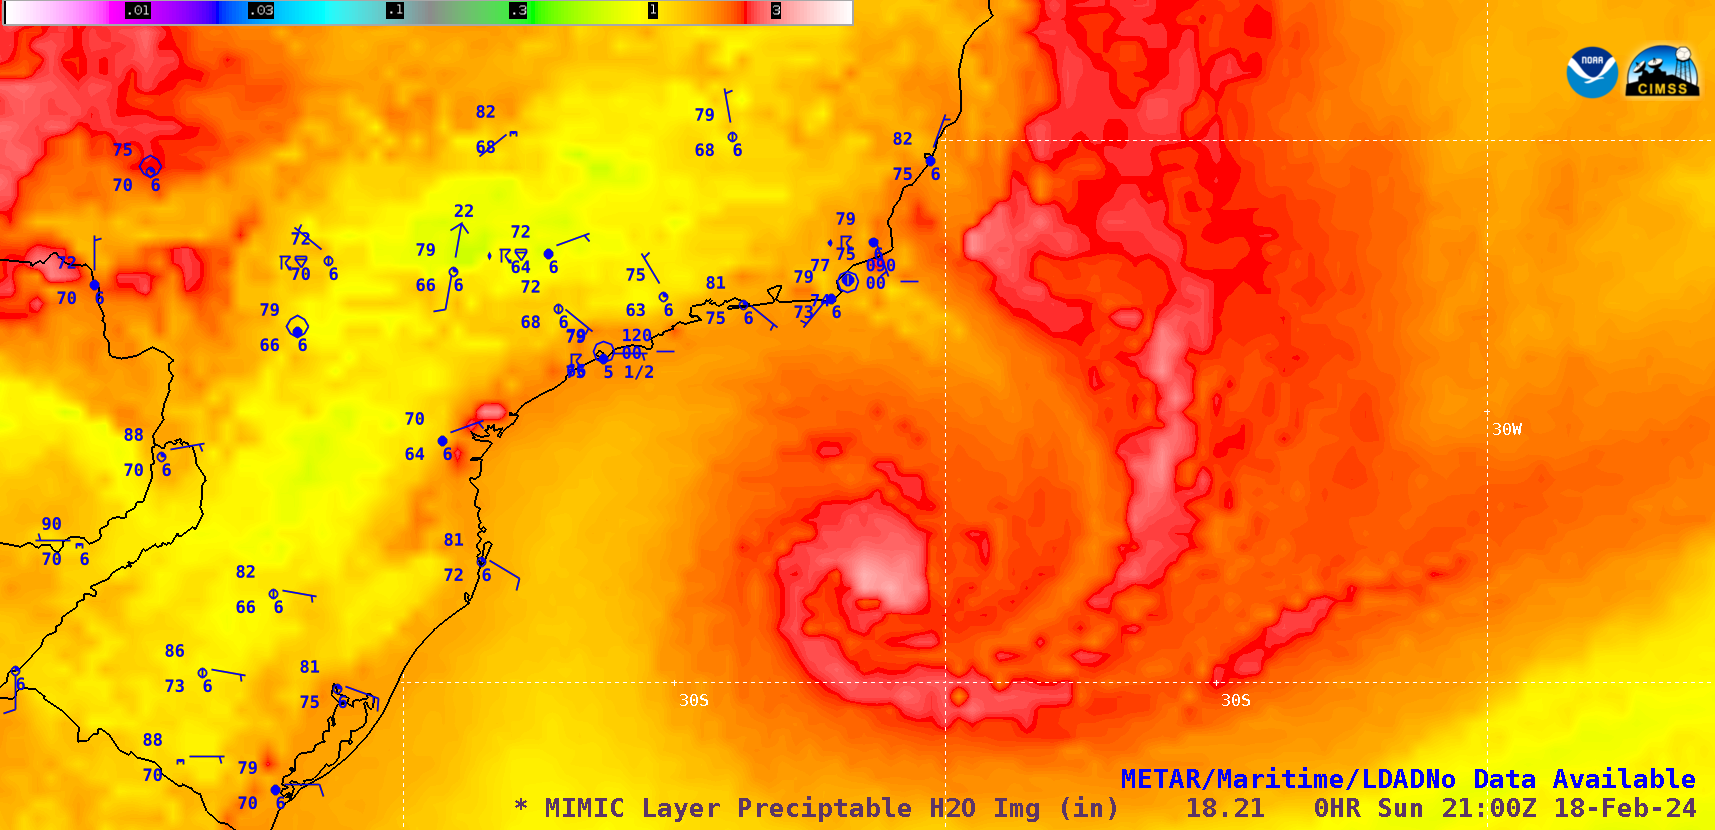
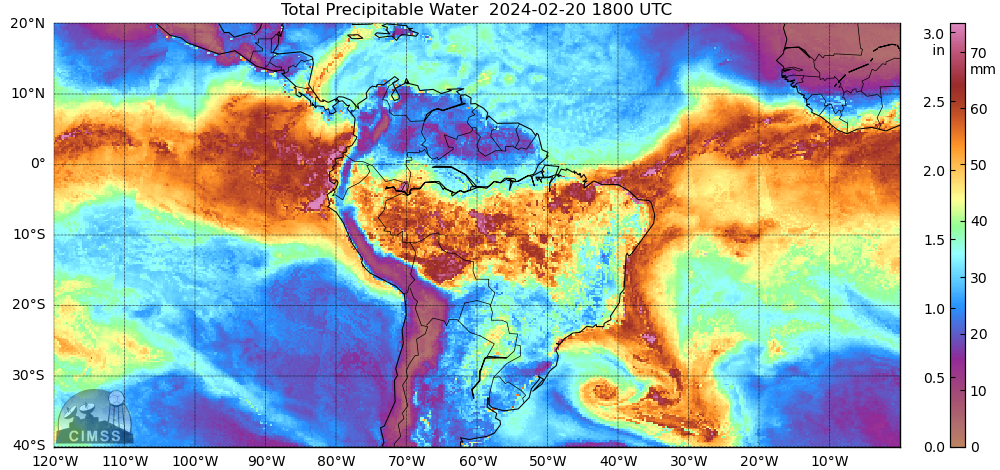
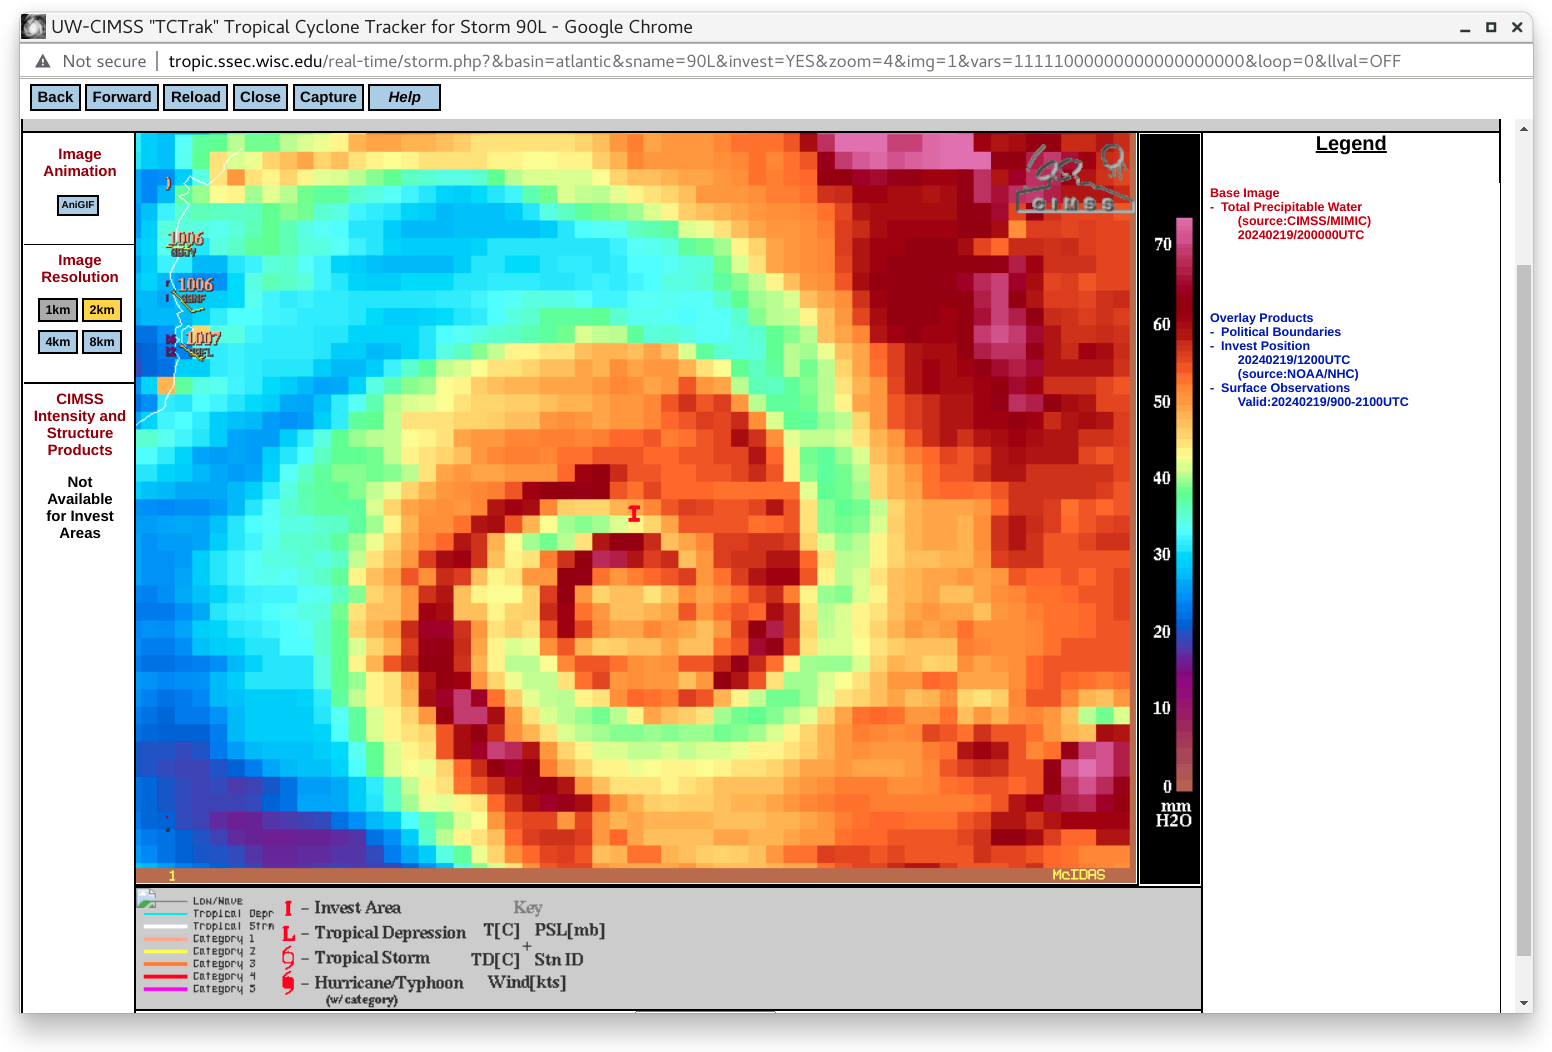
A closer view of the MIMIC Total Precipitable Water product
(below) included plots of surface and ship reports from 13-18 February. Maximum TPW values within the circulation of Akará on 18 February were around 3.5 inches (brighter shades of white). The relatively compact system was far enough offshore to not have any adverse impacts (such as strong winds) that showed up in any of the surface/ship reports.
MIMIC Total Precipitable Water product with plots of surface and ship reports, from 13-18 February [click to play animated GIF | MP4]
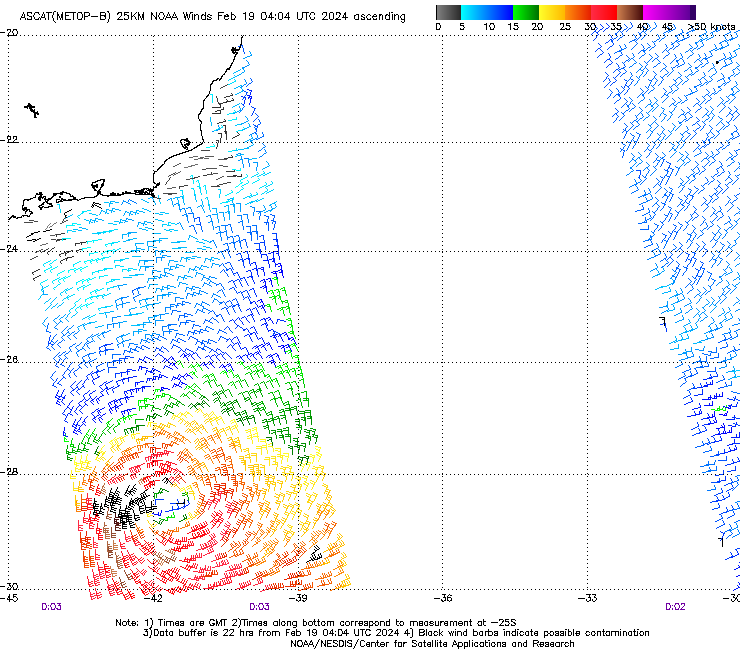
Surface wind information from Metop-B/C ASCAT and GCOM-W1 AMSR2
(below) showed the flow within portions of the developing tropical disturbance during the 17-18 February period (
source). The circulation of Akará was well-sampled by Metop-B ASCAT at
0003 UTC on 19 February, just after it reached Tropical Storm intensity.
ASCAT surface scatterometer winds from Metop-B and Metop-C, on 17-18 February
GCOM-W1 AMSR2 surface wind speeds, on 17-18 February
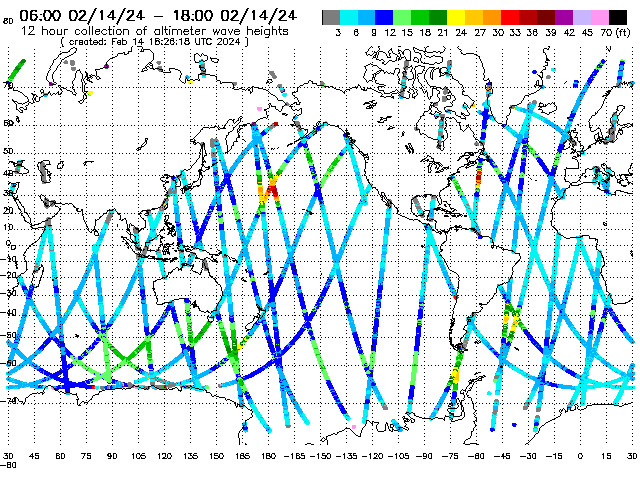
Significant Wave Height values derived by Sentinel-3A increased from 11.27 ft at 1216 UTC on 17 February to 14.98 ft at 0038 UTC on 18 February (below) — along the southern periphery of what was still a subtropical depression.
Significant Wave Height derived from Sentinel-3A, at 1216 UTC on 17 February and 0038 UTC on 18 February
===== 19 February Update =====
GOES-16 True Color RGB images on 19 February [click to play MP4 animation]
GOES-16 True Color RGB images
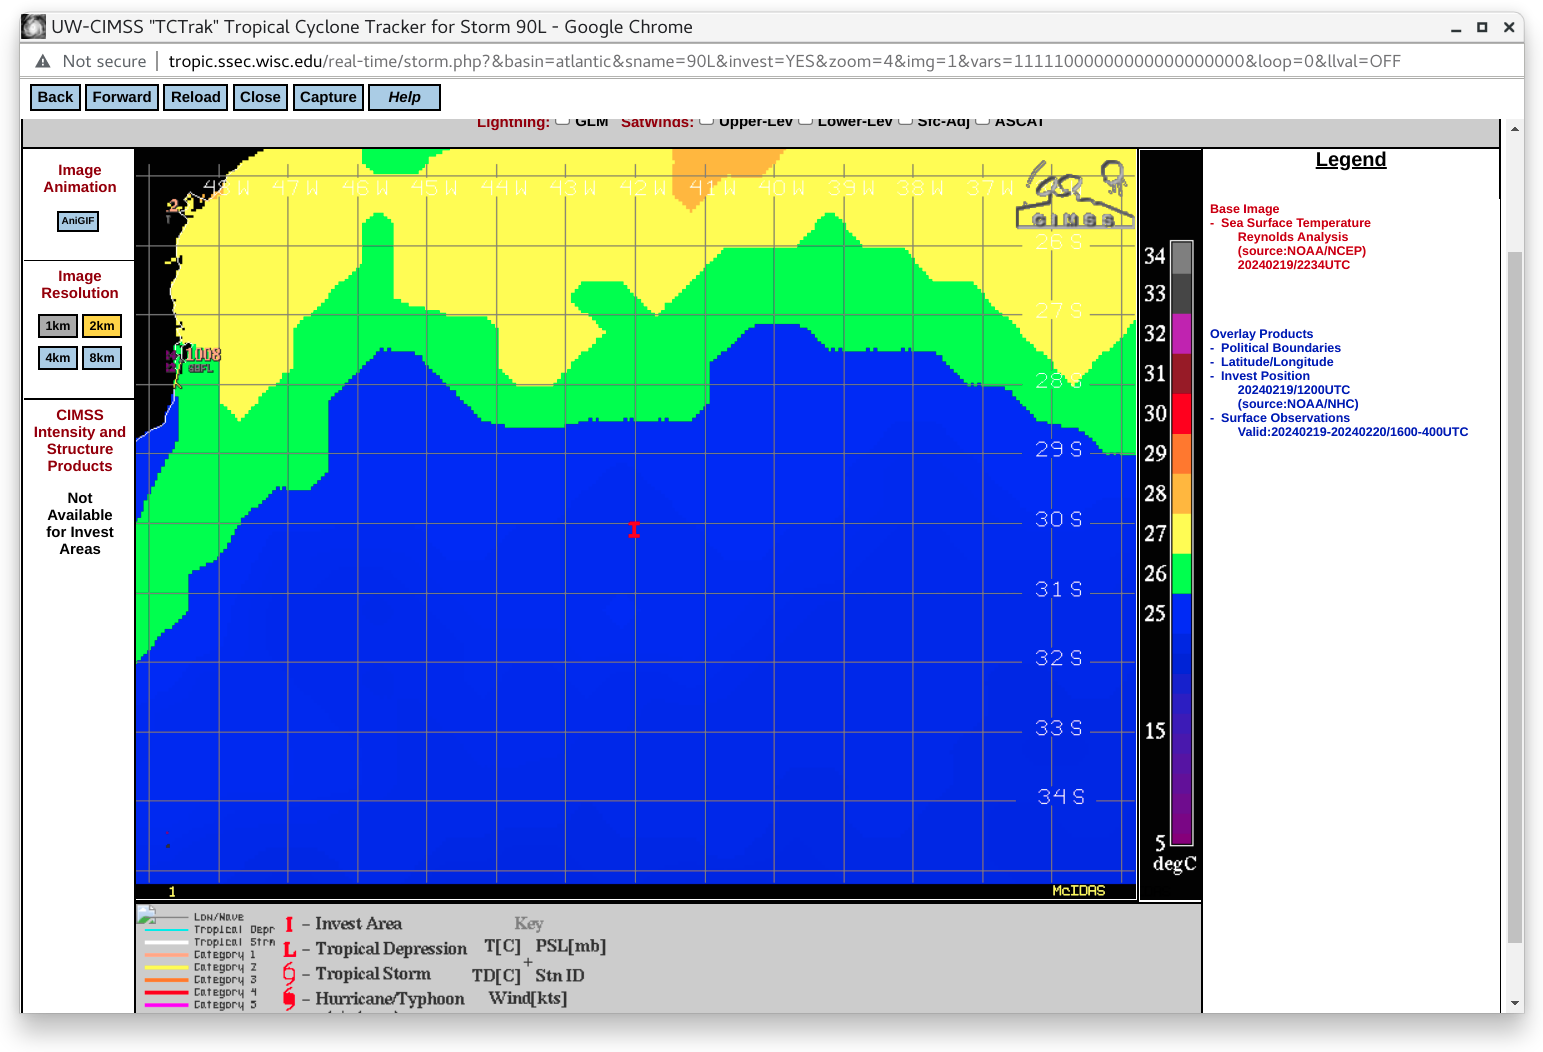
(above) showed that there was a notable lack of sustained deep convection near the exposed LLCC on 19 February — this was likely due to an increase in shear in the vicinity of Akará
(below). The tropical storm had also moved far enough south to be located over colder water, where
Sea Surface Temperature values were only around 25ºC.
GOES-16 Infrared Window images, with an overlay of deep-layer wind shear at 1700 UTC on 19 February
===== 20 February Update =====
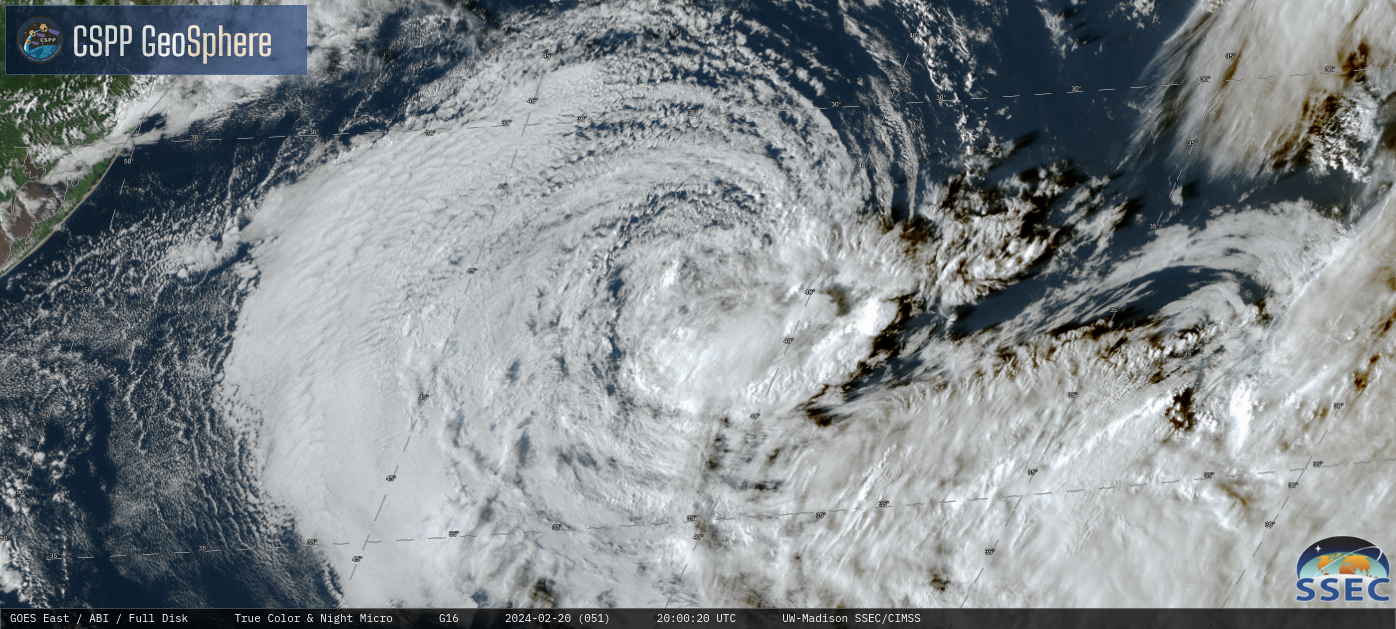
GOES-16 True Color RGB images on 20 February [click to play MP4 animation]
For the second consecutive day, sustained deep convection failed to develop near the exposed LLCC of Akará
(above). The MIMIC TPW product
(below) indicated that a ribbon of dry air had begun to wrap into the circulation of the tropical storm, beginning on
19 February.
MIMIC Total Precipitable Water product, from 13-20 February [click to play animated GIF | MP4]
Akará was then downgraded to a Tropical Depression as of 0000 UTC on 21 February
(below).
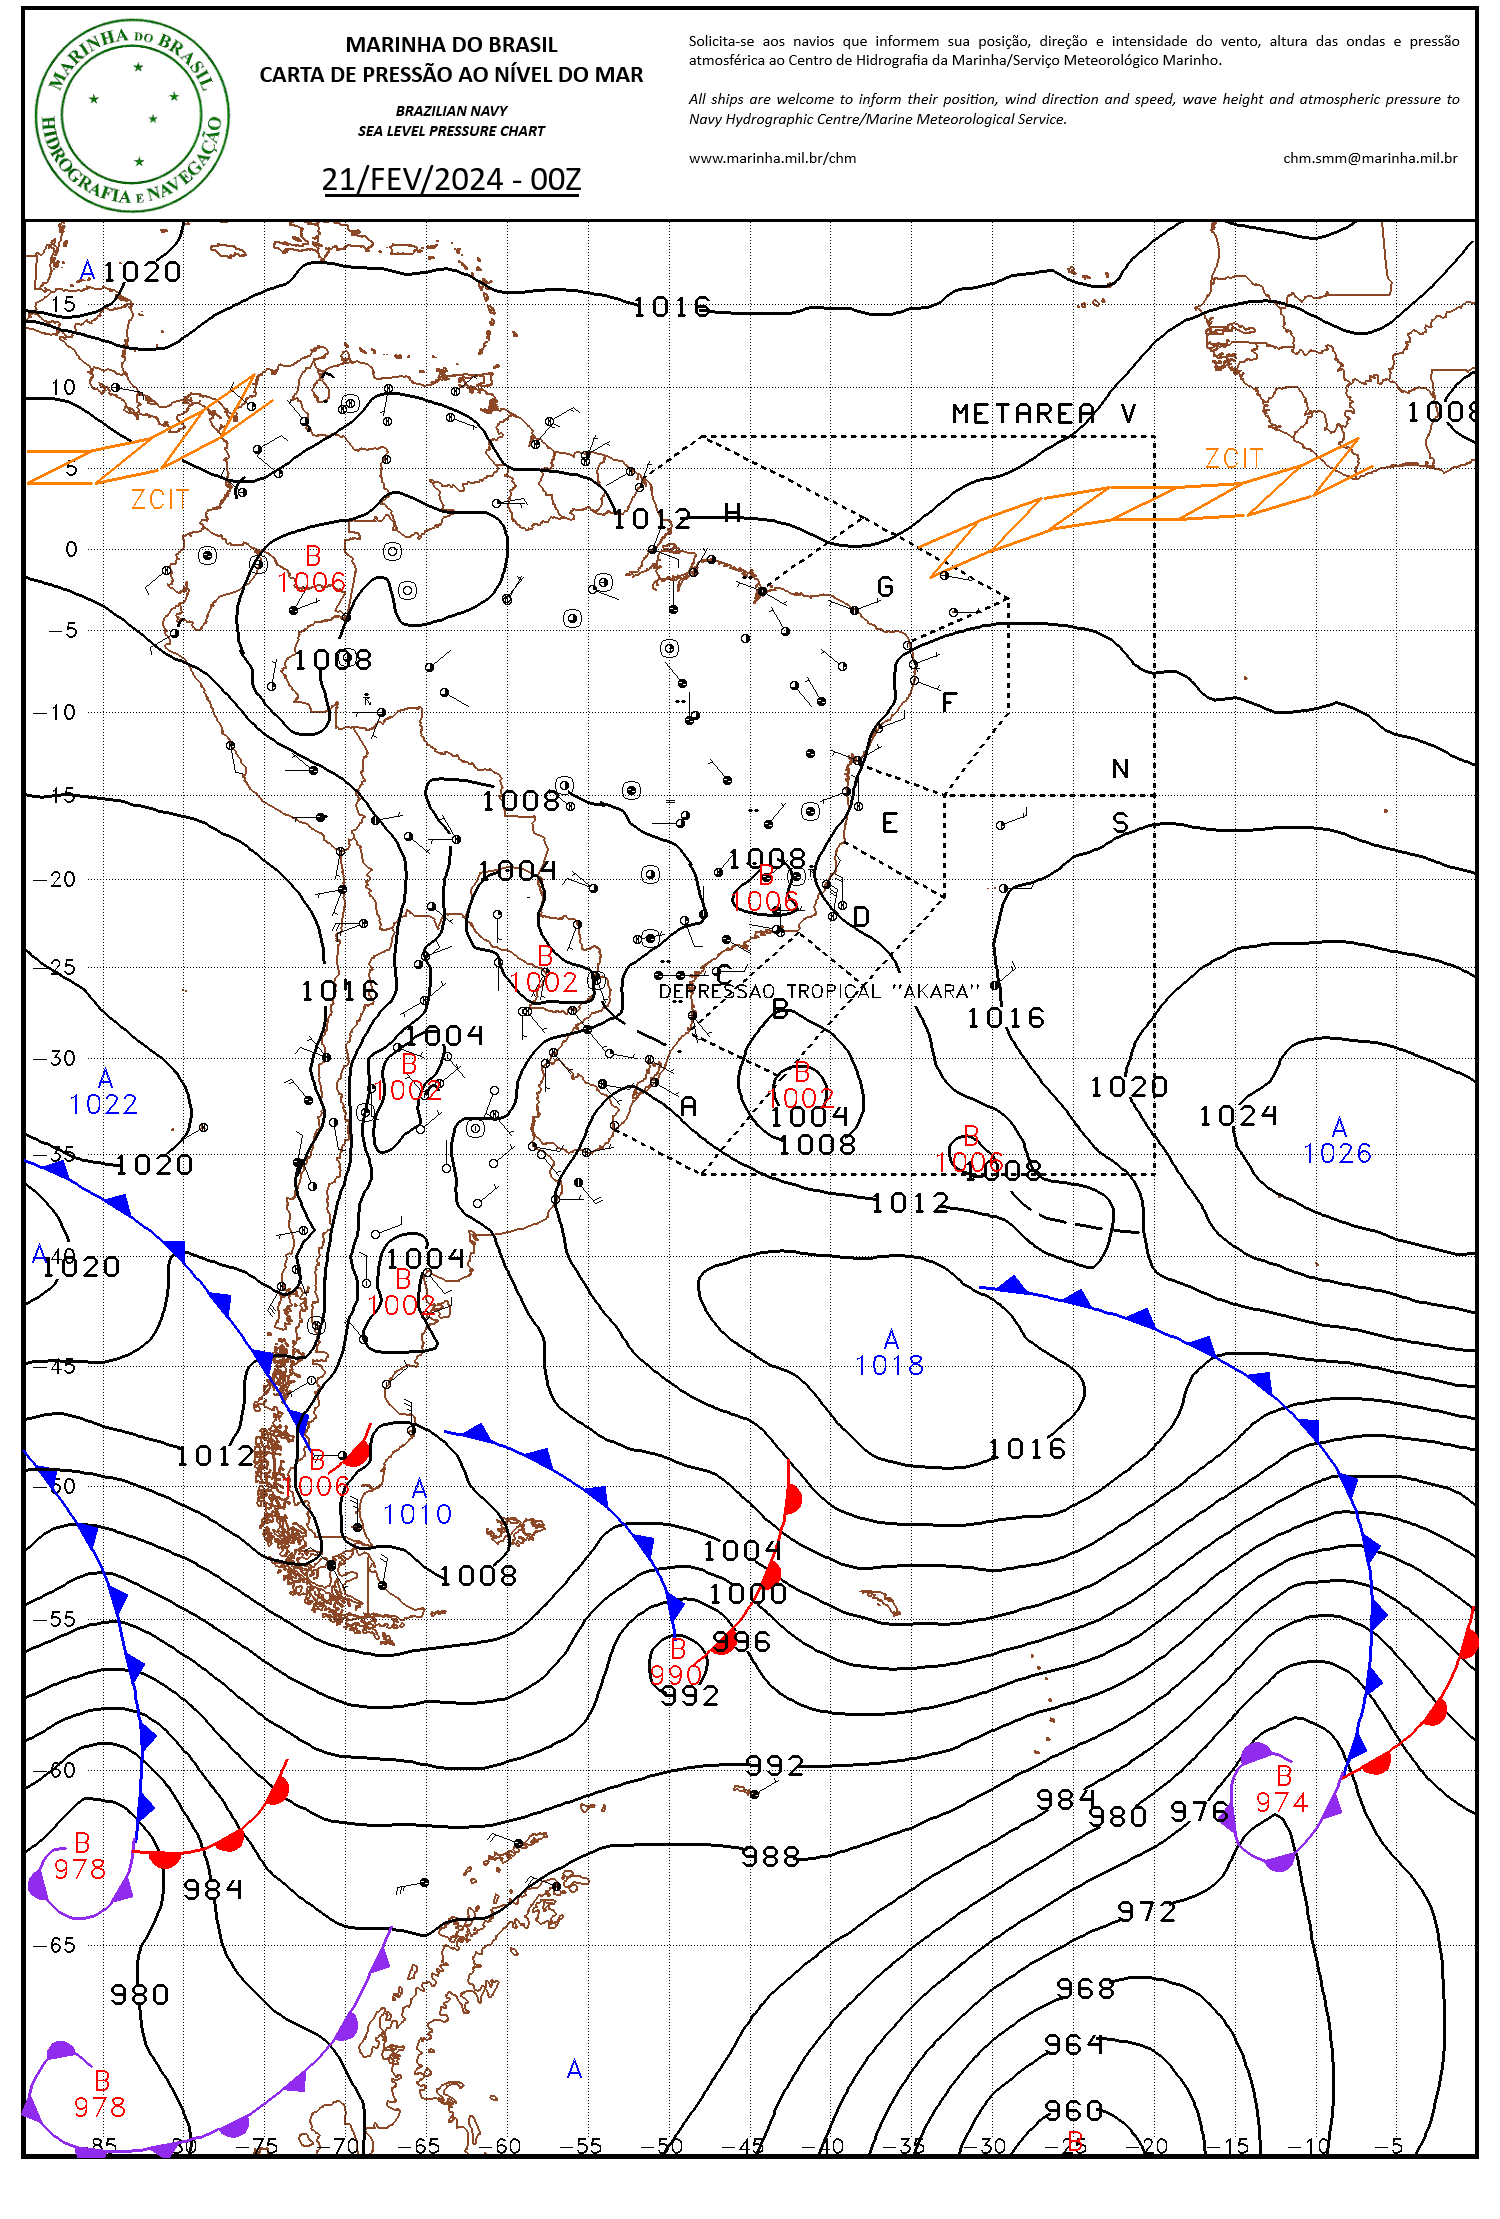
Surface analysis at 0000 UTC on 21 February [click to enlarge]
View only this post
Read Less


