This website works best with a newer web browser such as Chrome, Firefox, Safari or Microsoft
Edge. Internet Explorer is not supported by this website.
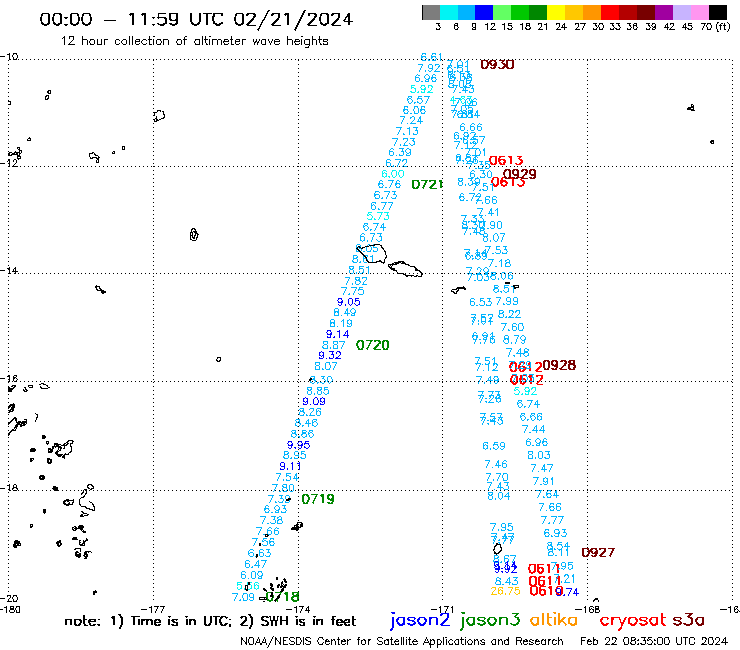
Significant Wave Height observsations near Samoa, 21 February 2024 (Click to enlarge)
The ‘manati’ website (https://manati.star.nesdis.noaa.gov/) is a helpful NOAA/NESDIS/STAR website that includes different observations from Polar-Orbiting satellites including, as shown above, Altimetric Observations of Significant Wave Height. Observations from three different satellites are shown in the image, including Jason3 (0718-0722 UTC), Cryosat (0610-0614 UTC) and Sentinel-3A (0927-0930 UTC). This post will help you anticipate where tomorrow’s observations from these satellites will occur. In other words, if you know where the observations are today, can you guess where they will be tomorrow (or the next day?)
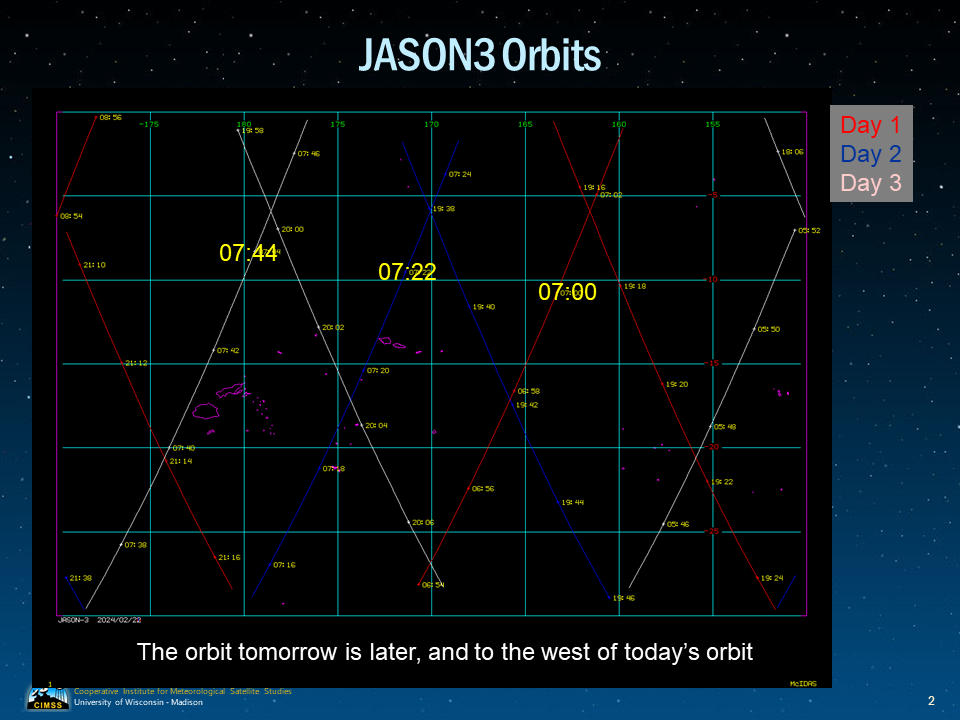
To answer this question, I downloaded the Two-Line-Element files (using the ‘SATCAT’ ability at celestrak.org) and used NAVDISP commands in McIDAS-X. The imagery below shows 3 consecutive days of JASON-3 orbits over the south Pacific. Based on this figure, the orbit for ‘tomorrow’ — in blue — will be later and to the west of ‘today’s orbit (in red) and the even further west and later on the day after tomorrow. (Note that ‘Day 2’ below corresponds to the Jason orbit shown above). From day to day, Jason-3 orbits cover a swath that is farther and farther west, and later in the day.
JASON-3A orbits over the south Pacific for three days in late February 2024 (Click to enlarge)
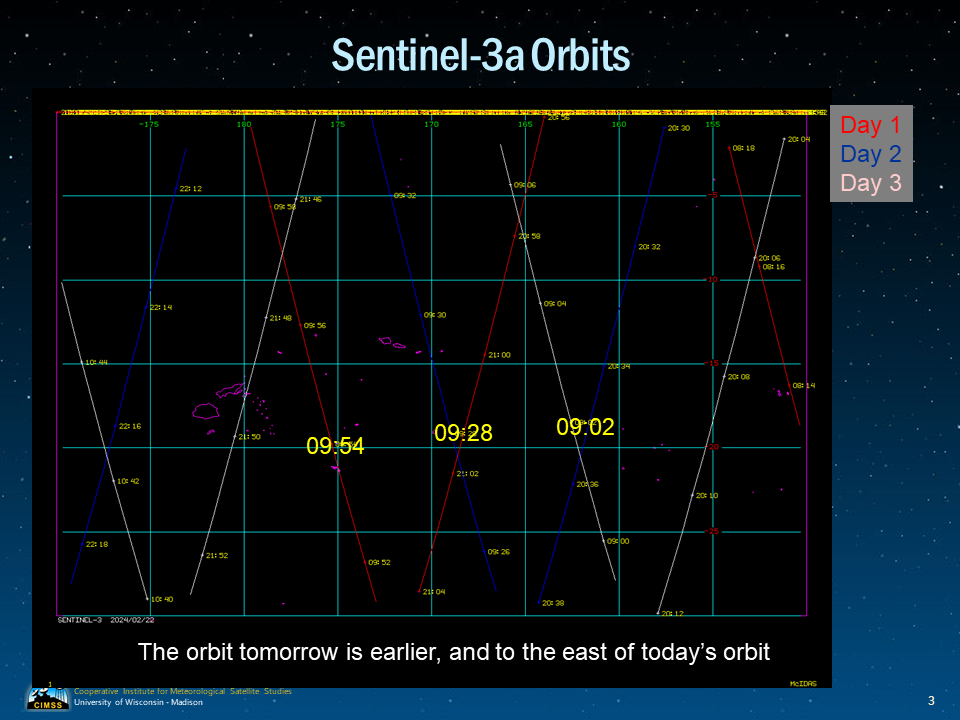
Sentinel-3A orbits evolve differently, as shown below. The Day 2 orbit is farther east and earlier than the Day 1 orbit. The blue line labeled 09:28 below is also shown in the image at the top of this blog post. From day to day, Sentinel orbits cover a swath that is farther and farther east, and earlier in the day.
Sentinel-3 orbits over the south Pacific for three days in late February 2024 (Click to enlarge)
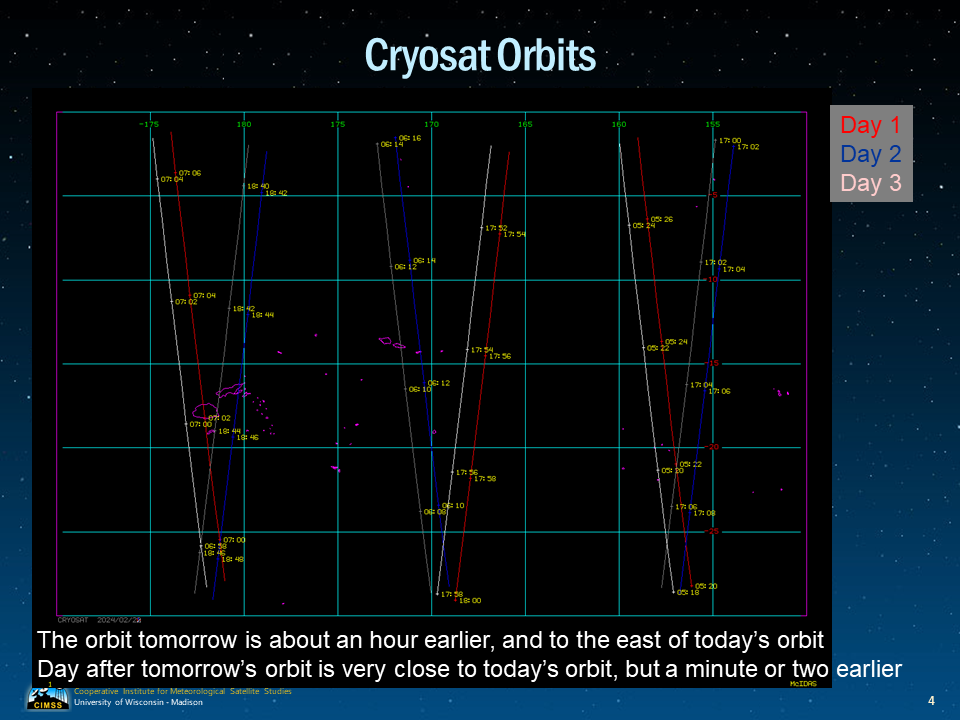
Cryosat orbits are also different. The figure below shows 4 days of orbits. Comparing the two orbits ‘Today’ and ‘Tomorrow’ shows that tomorrow’s orbit is about an hour earlier than today’s and farther east. Look at the ‘Red’ orbit that moves through Fiji at 0700 UTC on Day 1; on Day 2, there is an orbit through American Samoa at 0613 UTC (as also shown in the figure up top). Note on Day 3, however, that a near-overlap of the Day 1 orbit is occurring through Fiji.
Cryosat orbits over the south Pacific for four days in late February 2024 (Click to enlarge)
Use this information to anticipate where tomorrow’s overpass will be (or where yesterday’s overpass was!) when you’re looking at the Significant Wave Height.
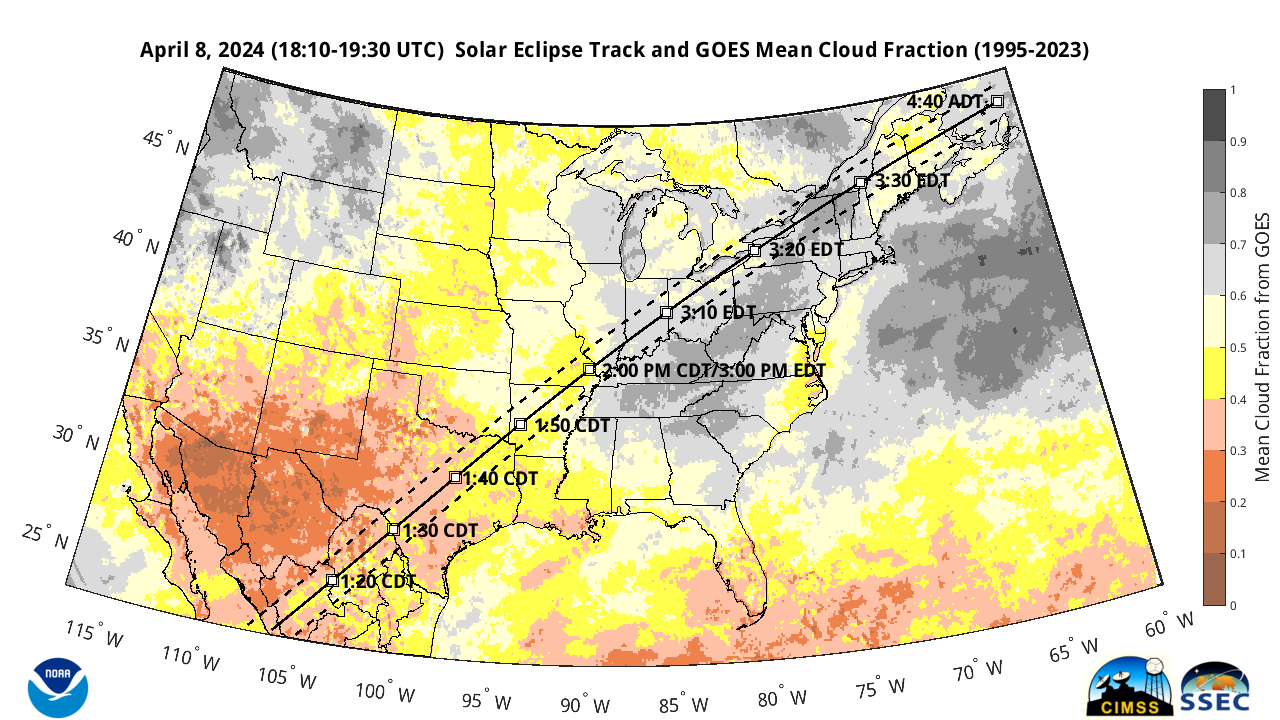
The Washington Post liked our previous GOES cloud climatology image so much they created their own version from our data and of course it looks fantastic! They know how to make good science look good! Please check out their story. Thank you to the Washington Post’s Lauren Tierney for reaching out to us and highlighting the work of the CIMSS cloud science team.
This presented an opportunity to update our GOES climatology figure. Enterprise Cloud Products were produced using NOAA’s Clouds from AVHRR Extended (CLAVR-x) processing framework at the University of Wisconsin, CIMSS. It turns out we have data that covers part of Atlantic Canada. New Brunswick and Nova Scotia to be specific, mostly cut out of the previous version unfortunately. One of the primary goals of the CIMSS Satellite Blog is to educate people and we usually learn new things along the way. For example, the author recently learned about the Atlantic Time Zone (note the final time marked on the map is in Atlantic Daylight Time or ADT). This also prompted the author to figure out how to put Canadian Province and Mexican State borders on maps in Matlab, so we can help our neighbors a bit.
Mean GOES Cloud Fraction from 1995 – 2023 on April 8th. Eclipse track shows the path of solar eclipse totality for April 8, 2024 and locations of totality with times in local time zones. (Click to enlarge)
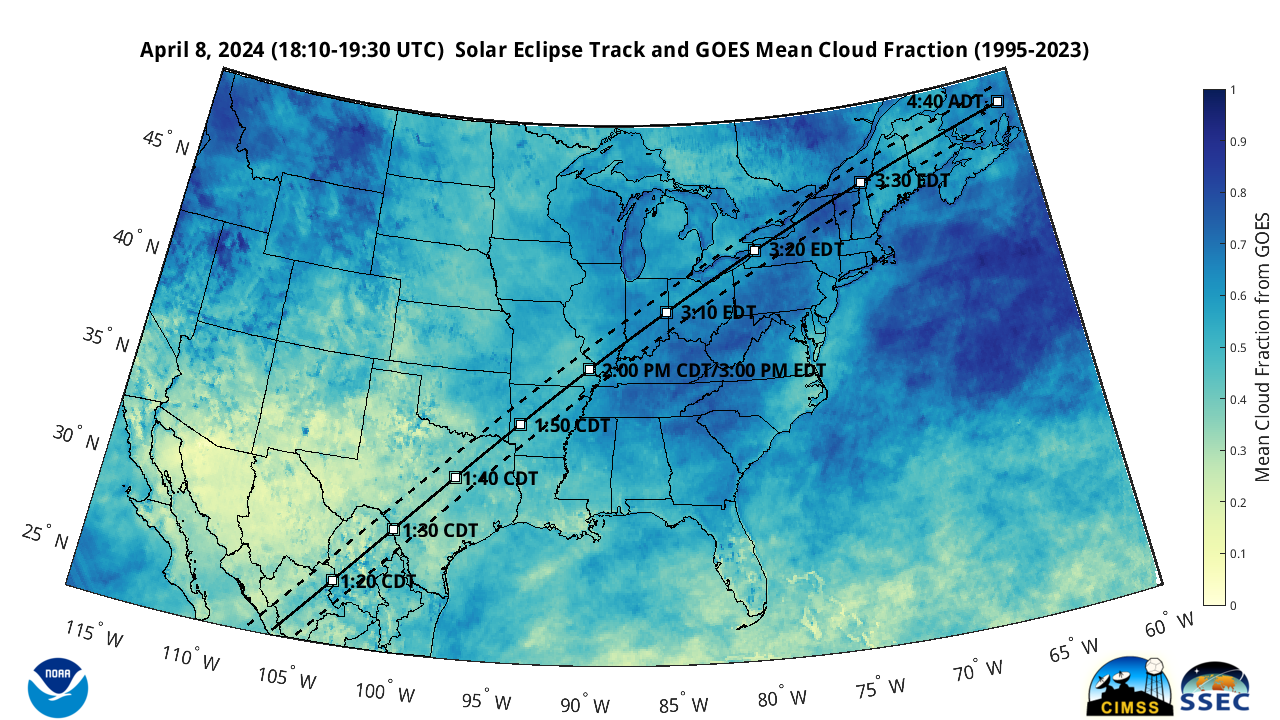
Some people have expressed an interest in seeing these climatology data with a prettier color enhancement. The Washington Post version is really fantastic, but here’s the same data with a progressive colormap:
Mean GOES Cloud Fraction from 1995 – 2023 on April 8th. Probably still not suitable for framing. Eclipse track shows the path of solar eclipse totality for April 8, 2024 and locations of totality with times in local time zones. (Click to enlarge)
Notice the totality part of the eclipse goes by pretty fast, from the Pacific Ocean, across Mexico, across the contiguous USA, and past Canada into the Atlantic Ocean in about 25-30 minutes! It also will pass right over Newfoundland, which unfortunately is outside the coverage area of our data. For any given location, totality only lasts a few minutes though the eclipse event is much longer than that. The National Centers for Environmental Information (NCEI) has an eclipse page with an interactive map from which you can get both their cloud climate analysis and the time/duration of the eclipse for many towns and cities in the USA (it’s not helpful for our neighbors). Our friends in Canada are getting ready too of course and you can find more information about viewing the eclipse in Canada from Dan Falk (@danfalk on X) and this neat YouTube video he made. Mexico seems likely to get the best cloud-free views and also the spot with the longest view of totality. For our Spanish speaking audience, you can learn more about the eclipse and what to expect in Mexico (probably clear skies! Longer duration eclipse) from this UnoTV YouTube video featuring Primoz Kajdic of Universidad Nacional Autonoma de Mexico.
You might be wondering what the difference is between our cloud climatology product and the NCEI one or any others you might see on the web? Ours is generated solely from GOES observations, a few hours from every April 8 from 1995-2023 and averaged. Some other cloud climatologies may include satellite observations, some do not, and some include other satellite platforms.
Going to see the eclipse? Remember to be safe! Don’t look at the sun directly without suitable eye protection! You maybe can get away with it during totality, but remember it doesn’t last long and ends rather suddenly. Let the SUVI stare at the sun, it’s built for that! Follow NASA’s safety guidelines.
Disclaimer on cloud climatology: this is not a real forecast and past clear or cloudy skies do not guarantee anything for April 8, 2024! You should check your local forecasts which are probably starting to get pretty accurate for clouds around April 6 and will be most accurate the morning of the eclipse. The eclipse itself can impact the amount of certain types of clouds. Most local meteorologists along the path are going to be paying attention to cloud cover, where good open places to view it will be, and what local plans are for schools, parks, etc. Be safe traveling to your view area!
Don’t miss it if you can help it! While partial solar eclipses are not too rare, total solar eclipses that go through your country are. For most of us in the U.S., it’s going to be a long time before we see another one. Alaska will see one in March 2033. Montana and North Dakota will see one in August 2044. The rest of the lower 48 will have to wait until August 2045 when an eclipse will traverse the contiguous U.S. from Florida to California. NASA has more information about future and past eclipses.
Finally, if you can’t see the eclipse, don’t fret. The web will be full of pictures from those who get the best cloud-free views. Check back here at the CIMSS blog where we will post animations of GOES ABI imagery of the shadow crossing CONUS and hopefully some SUVI animations of the full eclipse. We enjoy making images of solar eclipse shadows! For fun, here’s what an eclipse in 1984 with a similar, but more southern, path looked like from GOES-5:
Solar eclipse shadow seen in the GOES-5 Imager visible channel on May 30, 1984.
Thanks to Frank Espenak of NASA Goddard Space Flight Center (GSFC) for the prediction data on the eclipse path, including times.
CIMSS Scientists who work with JPSS data had numerous presentations at the American Meteorological Society’s Annual Meeting held at the end of January in Baltimore. This blog post discusses two poster by Rich Dworak who (along with co-authors) investigated how JPSS data can define winds and ice properties in the... Read More
CIMSS Scientists who work with JPSS data had numerous presentations at the American Meteorological Society’s Annual Meeting held at the end of January in Baltimore. This blog post discusses two poster by Rich Dworak who (along with co-authors) investigated how JPSS data can define winds and ice properties in the Arctic.
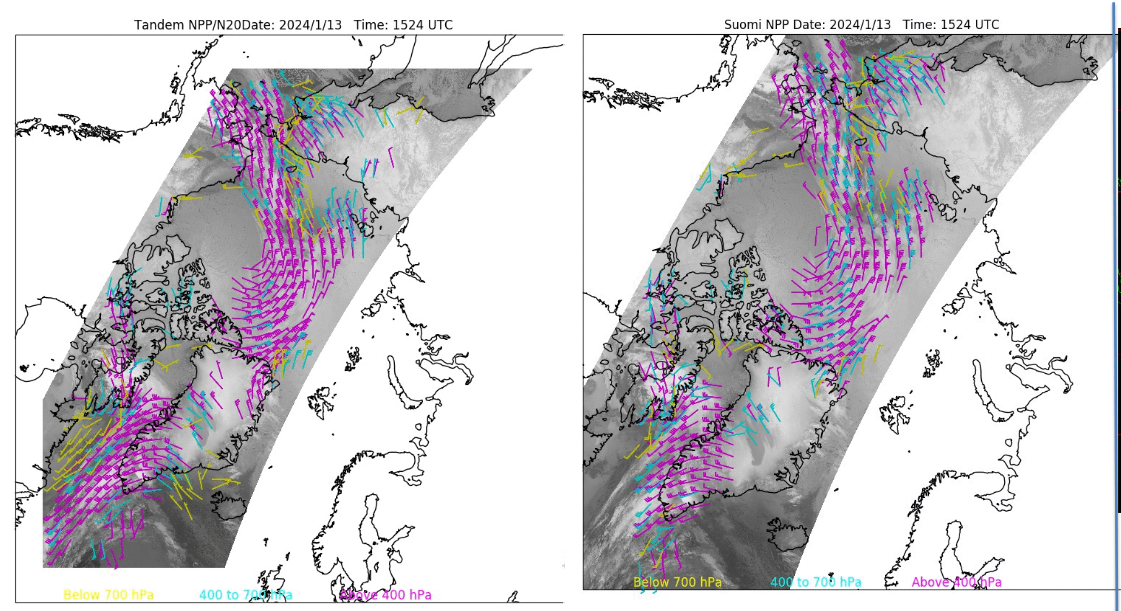
Atmospheric Motion Vectors can be computed from polar-orbiting satellites, and these give better spatial resolution over the Poles compared to geostationary data. Additionally, because Suomi-NPP and NOAA-20 have similar orbits, data from multiple satellites can be used in tracking atmospheric features; it is the translation of those features that is used to infer atmospheric motion. (The addition of NOAA-21 to the mix will improve things further) ‘Polar Tandem’ winds in the poster below refer to winds computed using both Suomi-NPP and NOAA-20 data; a better forecast results when such winds are input into a numerical model (NAVGEM in this case). SWIR winds use observations from 2.25 um (that is, M11 on VIIRS) on Suomi-NPP and NOAA-20; these computed low-level winds lead to improved model forecasts as well.
Dworak and (different) collaborators also work on cryosphere products, detailed in the poster below. These operational products combine all-weather AMSR-2 information with high-resolution VIIRS observations of surface ice. In particular this results in better observations and predictions of the sea ice edge.
Satellite winds that are based on this work are available in real time at this link. An example the includes both Suomi-NPP and NOAA-20 data is shown below (0748 UTC on 22 February 2024). These winds were also discussed in this recent blog post.
Atmospheric Motion Vectors, 0748 UTC on 22 February 2024, colored by height (Click to enlarge)
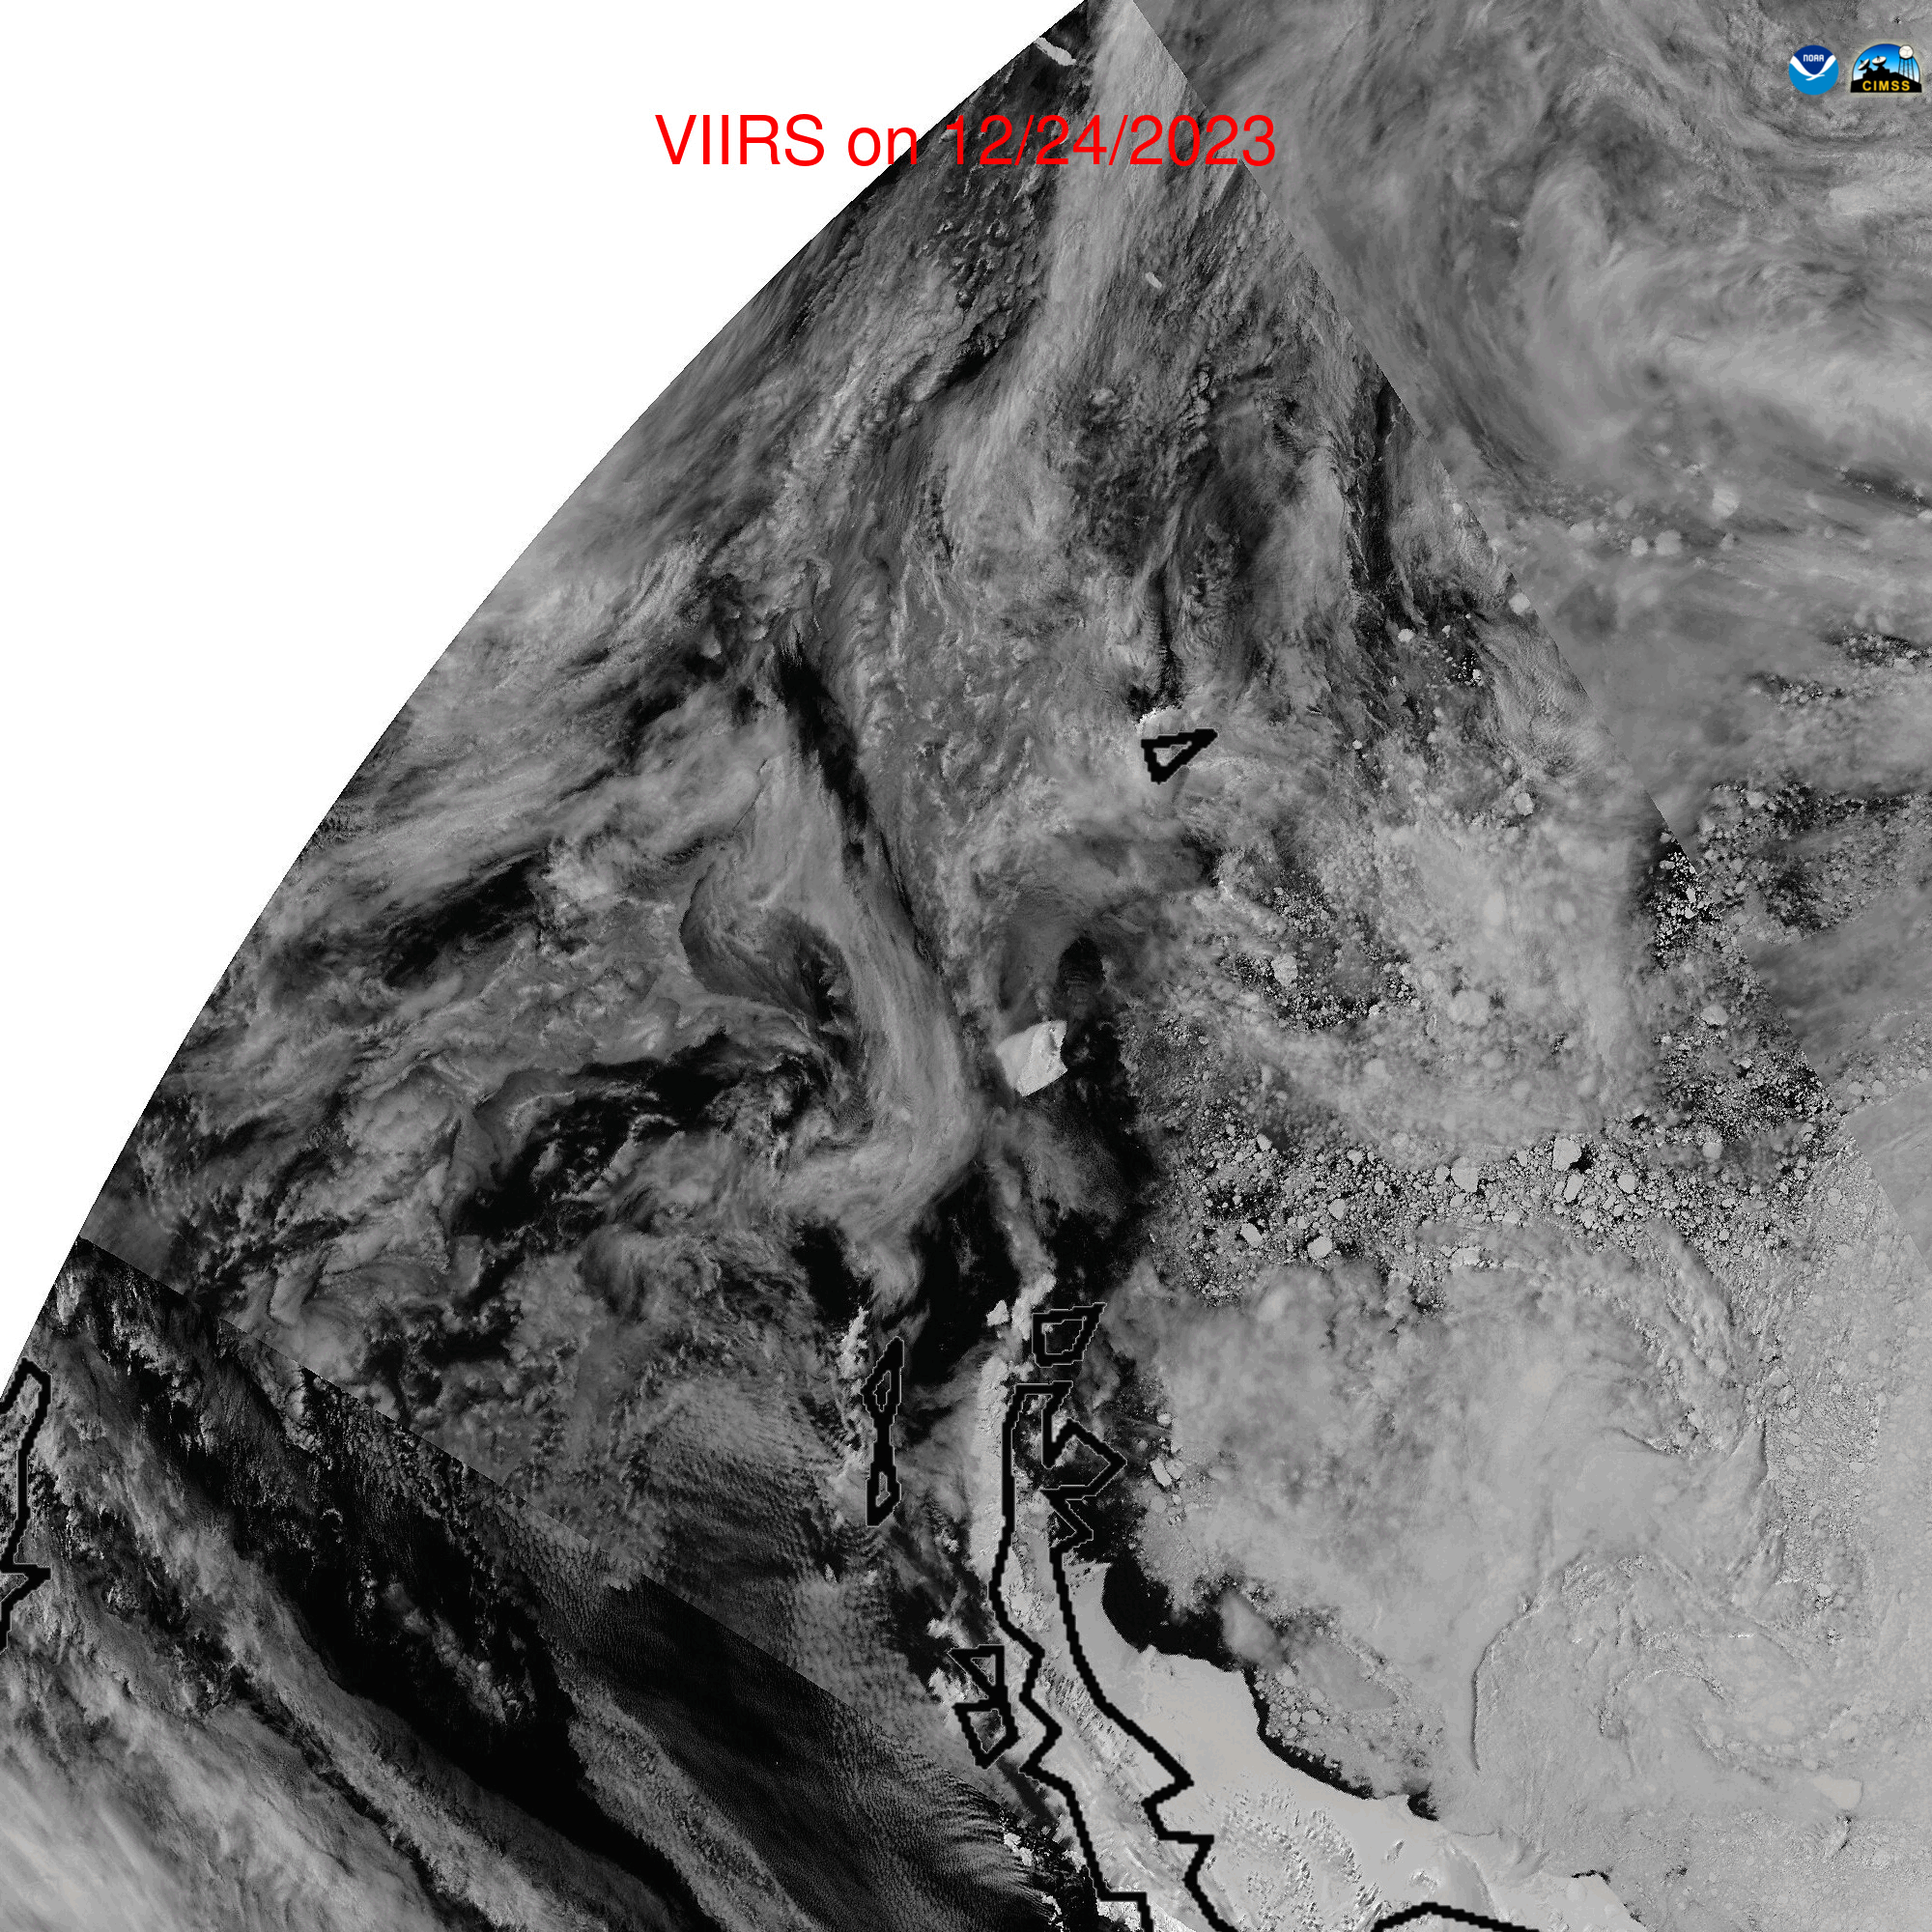
A sequence of daily NOAA-20 VIIRS Visible (0.64 µm) images from 01 November 2023 to 19 February 2024 (above) showed Iceberg A23a as it migrated northward away from the Antarctic Peninsula to east of the South Shetland Islands (days when dense cloud cover obscured A23a were omitted). Near the end of this time... Read More
Sequence of daily NOAA-20 VIIRS Visible (0.64 µm) images, from 01 November 2023 to 19 February 2024 (courtesy Yinghui Liu, NOAA/CIMSS) [click to play animated GIF | MP4]
A sequence of daily NOAA-20 VIIRS Visible (0.64 µm) images from 01 November 2023 to 19 February 2024 (above) showed Iceberg A23a as it migrated northward away from the Antarctic Peninsula to east of the South Shetland Islands (days when dense cloud cover obscured A23a were omitted). Near the end of this time period, the iceberg — whose motion was driven by a combination of winds and ocean currents — performed a complete rotation, and reversed its path to begin drifting back toward the South Shetland Islands.
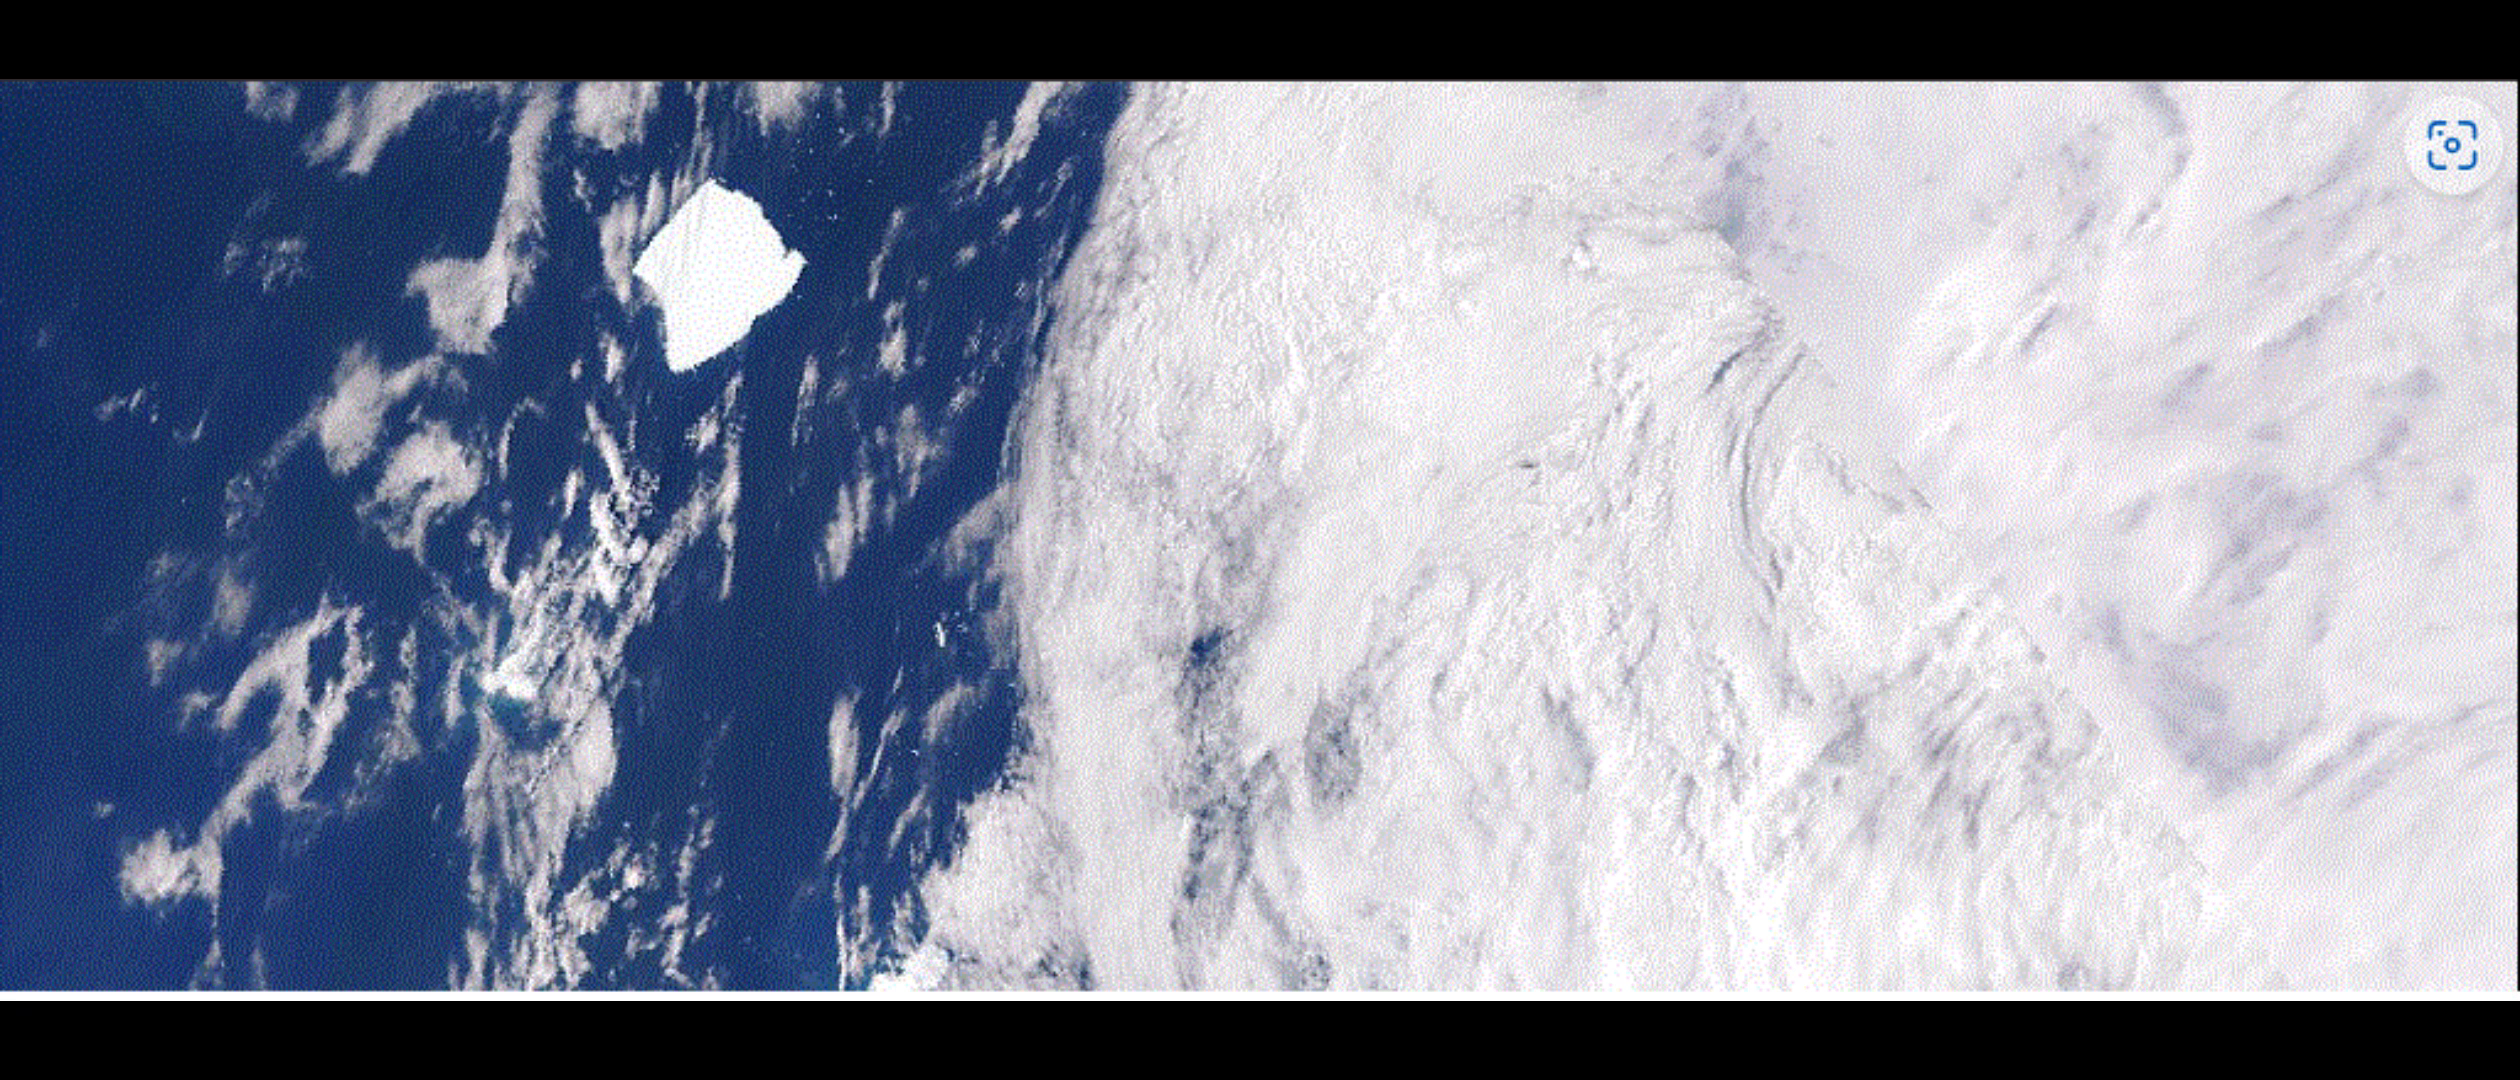
Daily NOAA-20 VIIRS Natural Color RGB images (excluding cloudy days) from 27 December 2023 to 15 February 2024 (below) also displayed the rotation of A23a, along with the change in direction of its drift within the Southern Ocean.
NOAA-20 VIIRS Natural Color RGB images, from 27 December 2023 to 15 February 2024 (courtesy Rich Dworak, CIMSS) [click to play MP4 animation]
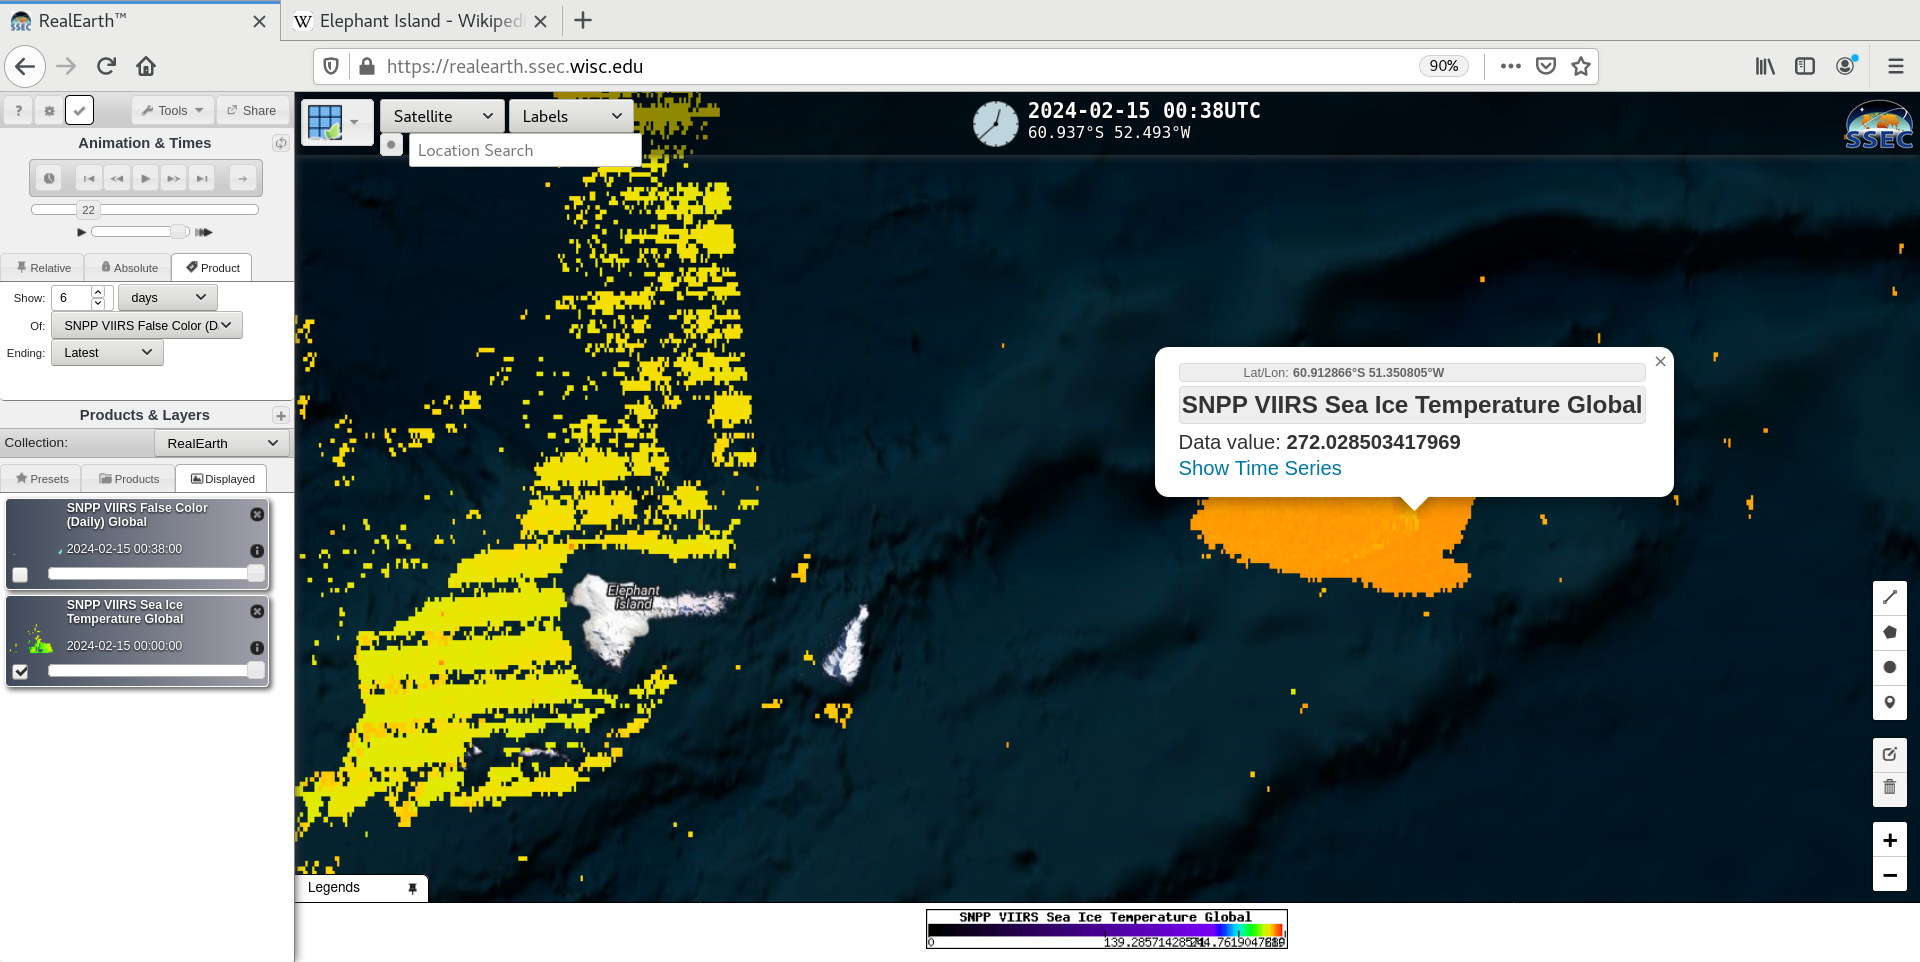
A toggle between Suomi-NPP VIIRS False Color RGB imagery and the Sea Ice Temperature product as viewed using RealEarth(below) showed A23a as it was located just east of Elephant Island and Clarence Island on 15 February. Sea Ice Temperature values were near or just below freezing.
Suomi-NPP VIIRS False Color RGB image and Sea Ice Temperature product on 15 February [click to enlarge]
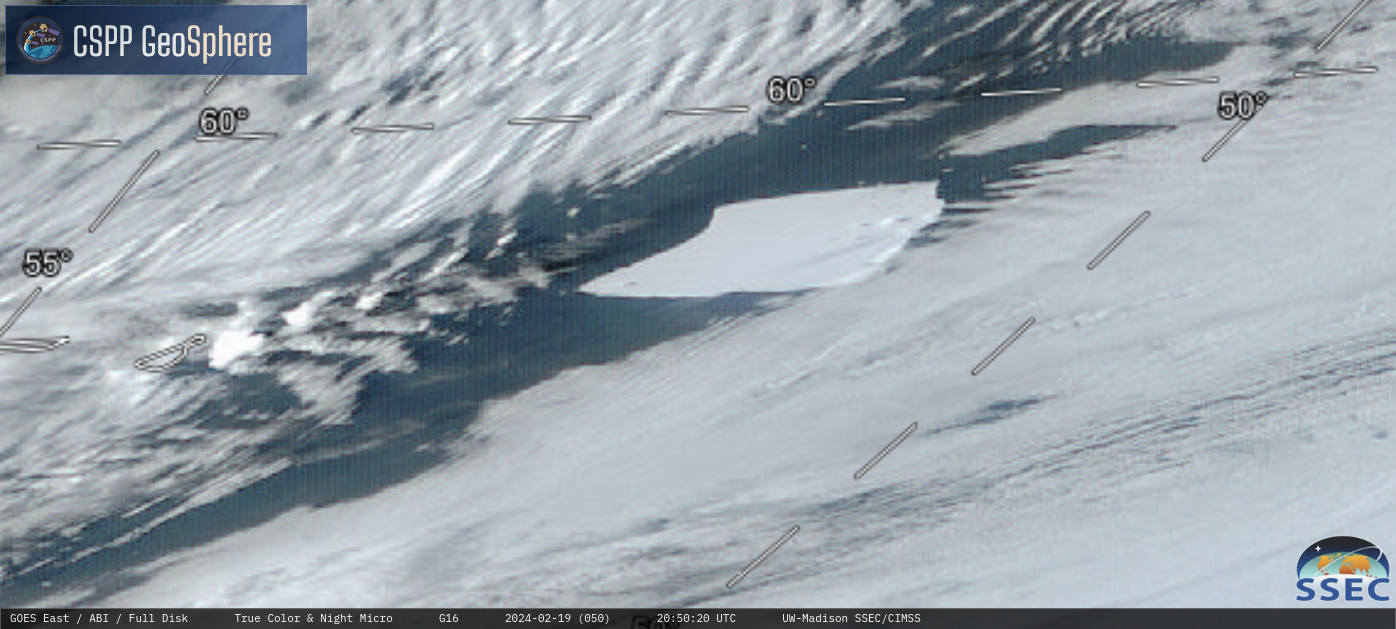
GOES-16 (GOES-East) True Color RGB images (source) on minimally-cloudy days from 03 February to 19 February (above) also displayed the motion of A23a as it reversed course and drifted southwestward, back toward the South Shetland Islands (while performing part of its rotation).
GOES-16 True Color RGB images, on minimally-cloudy days from 03 February to 19 February [click to play MP4 animation]

