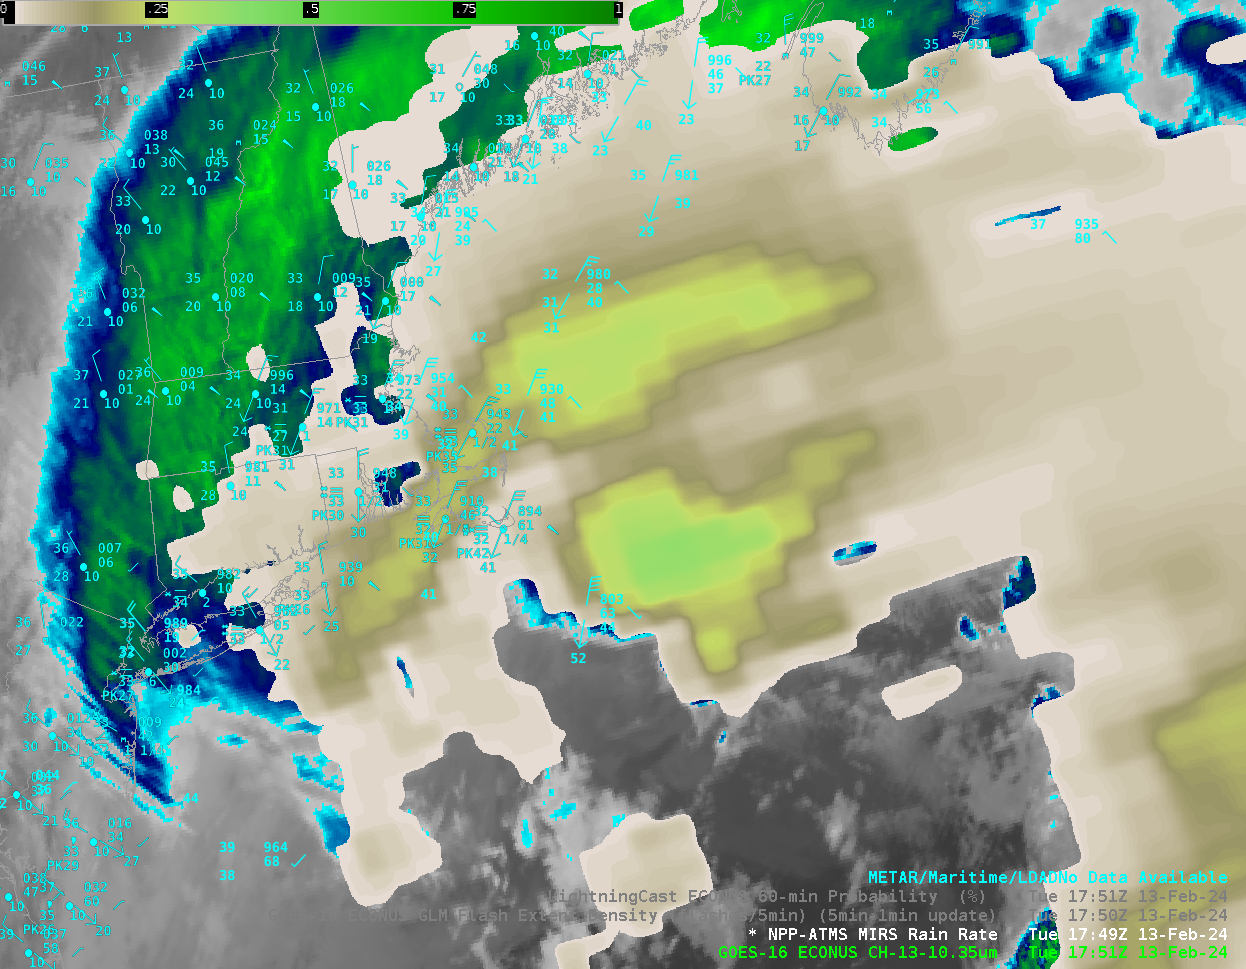
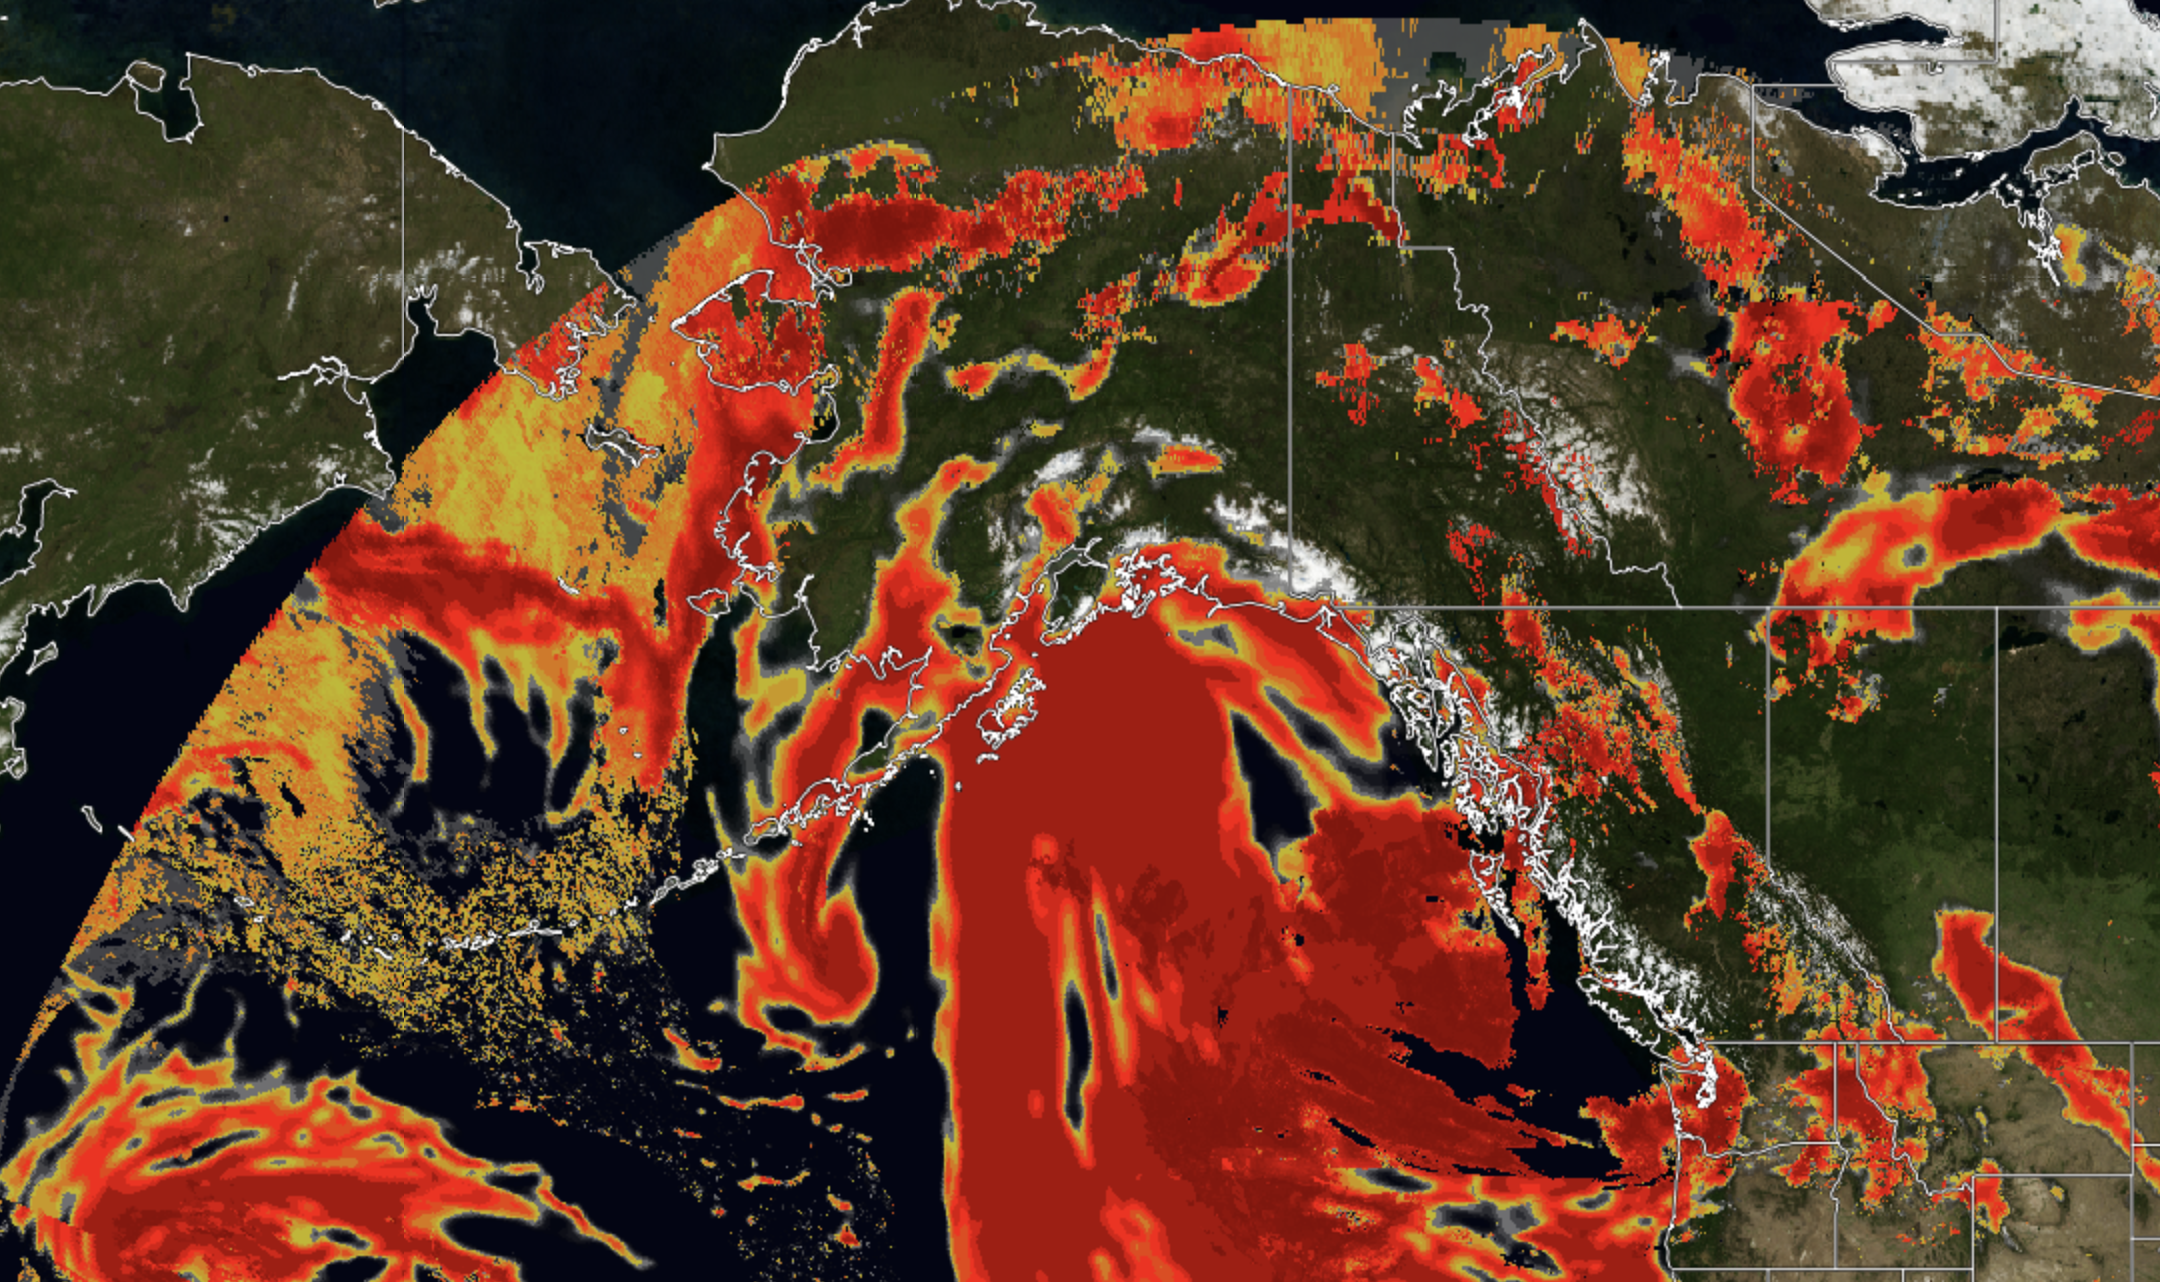
CSPP software processes signals at Direct Broadcast antenna sites to create products and imagery with very low latency from Low-Earth Orbit (LEO) satellites. The software includes Microwave Integrated Retrieval System (MIRS) algorithms, including rain rate (available here). How well does that product do in capturing observed precipitation? The toggle above shows GOES-16 Clean Window infrared imagery and derived rain rates (derived from microwave data). The back edge of the precipitation is captured well by the MIRS product, and several heavier bands of precipitation offshore are also suggested. This product is especially useful in the absence of any radar.
How does the rain rate compare to the radar at the same time? The image below (from the College of DuPage website) shows Mosaic Reflectivity at 1750 UTC on 13 February. The back edge of the precipitation in the radar shows agreement with the Rain Rate shown in the toggle above (or here).
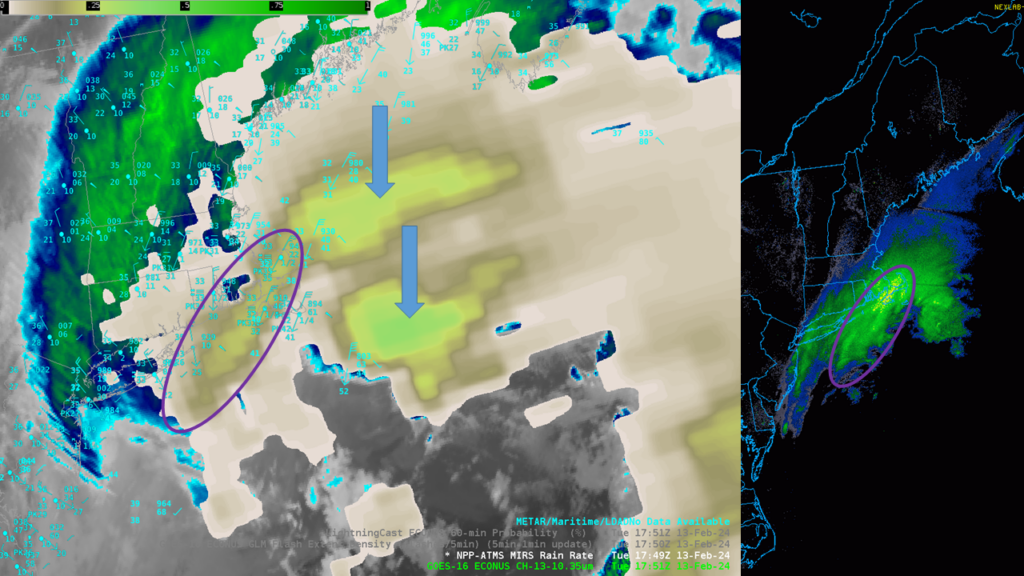
The side-by-side comparison, below, highlights detected features. The precipitation band circled in purple appears in both Rain Rate and Radar imagery. The heavier precipitation regions to the east, highlighted by the blue arrows, does not appear in the radar, and highlights an advantage of MIRS Rain Rate: it provides information where radar data are not available.
View only this post Read Less


