Typhoon Mawar reaches Category 4 intensity
JMA Himawari-9 “Red” Visible (0.64 µm, left) and “Clean” Infrared Window (10.4 µm, right) images, from 2222 UTC on 22 May to 0502 UTC on 23 May [click to play animated GIF | MP4]
A Suomi-NPP VIIRS Day/Night Band (0.7 µm) image valid at 0320 UTC on 23 May (below) showed a larger-scale view of Typhoon Mawar as it was centered about 200 miles southeast of Guam.
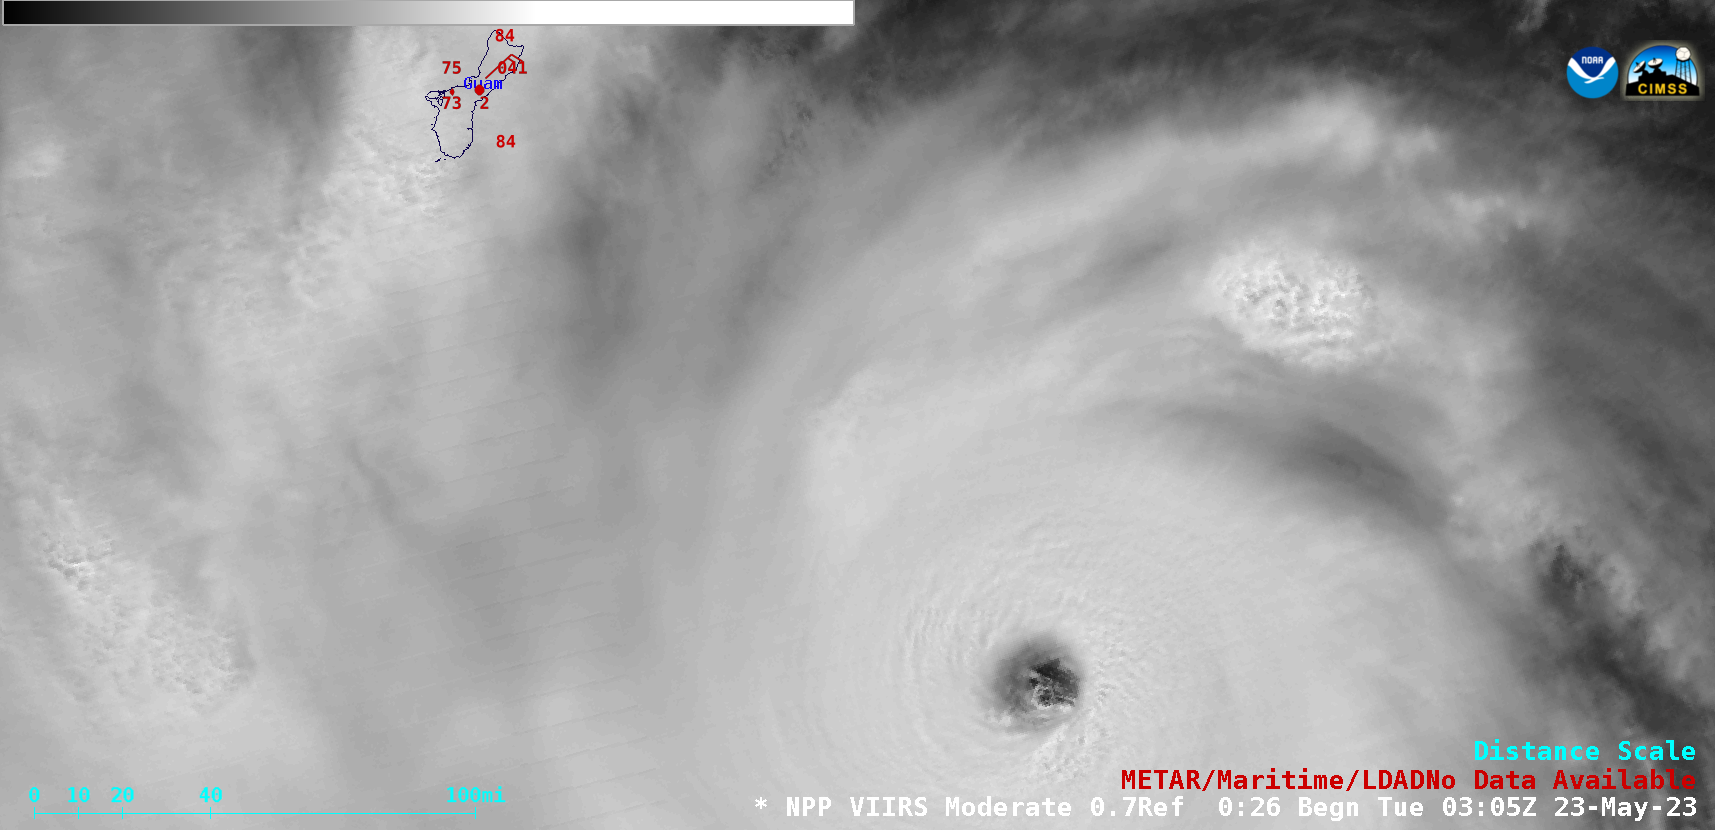
Suomi-NPP VIIRS Day/Night Band (0.7 µm) image, valid at 0320 UTC on 23 May [click to enlarge]
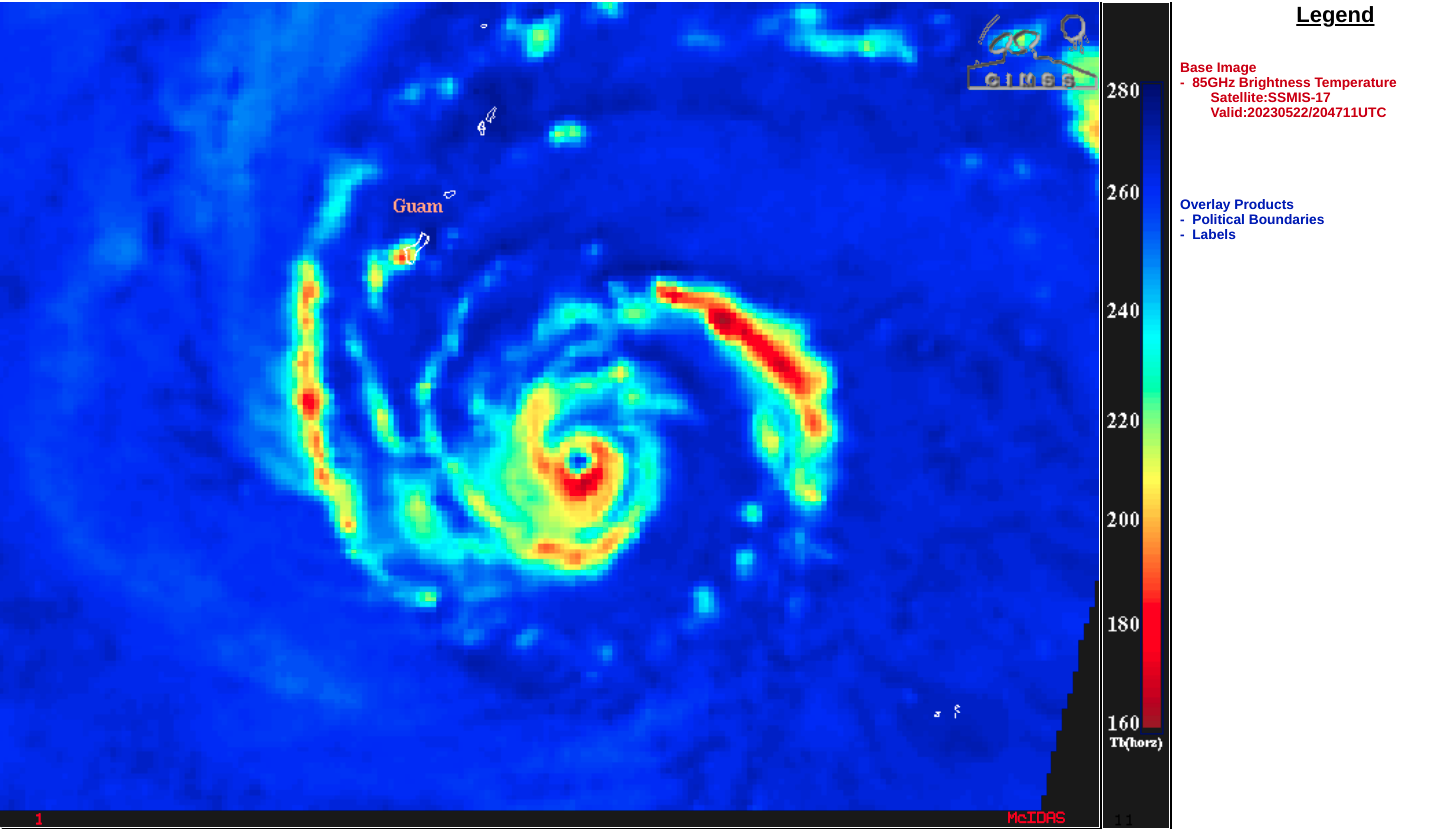
DMSP-17 SSMIS Microwave (85 GHz) image [click to enlarge]
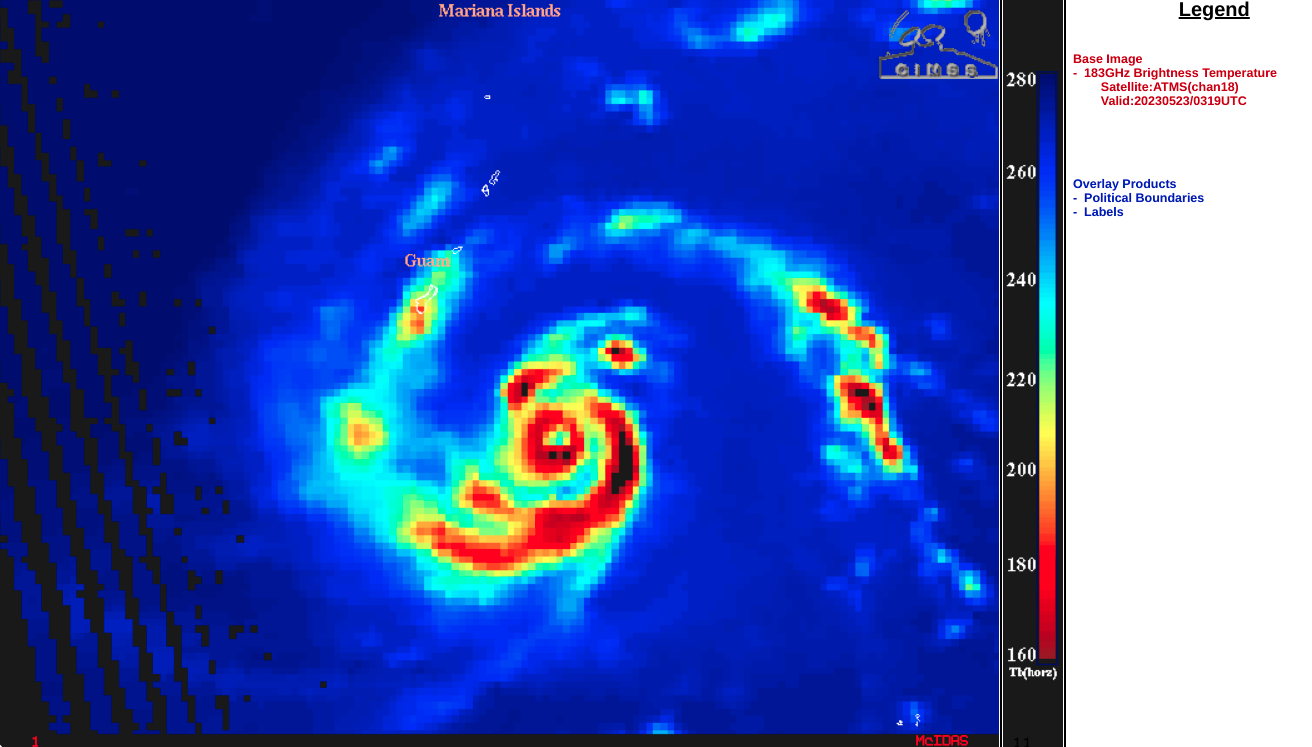
ATMS Microwave (183 GHz) image at 0319 UTC on 23 May [click to enlarge]
Himawari-9 Infrared Window (11.2 µm) images, with an overlay of deep-layer wind shear at 0000 UTC [click to enlarge]
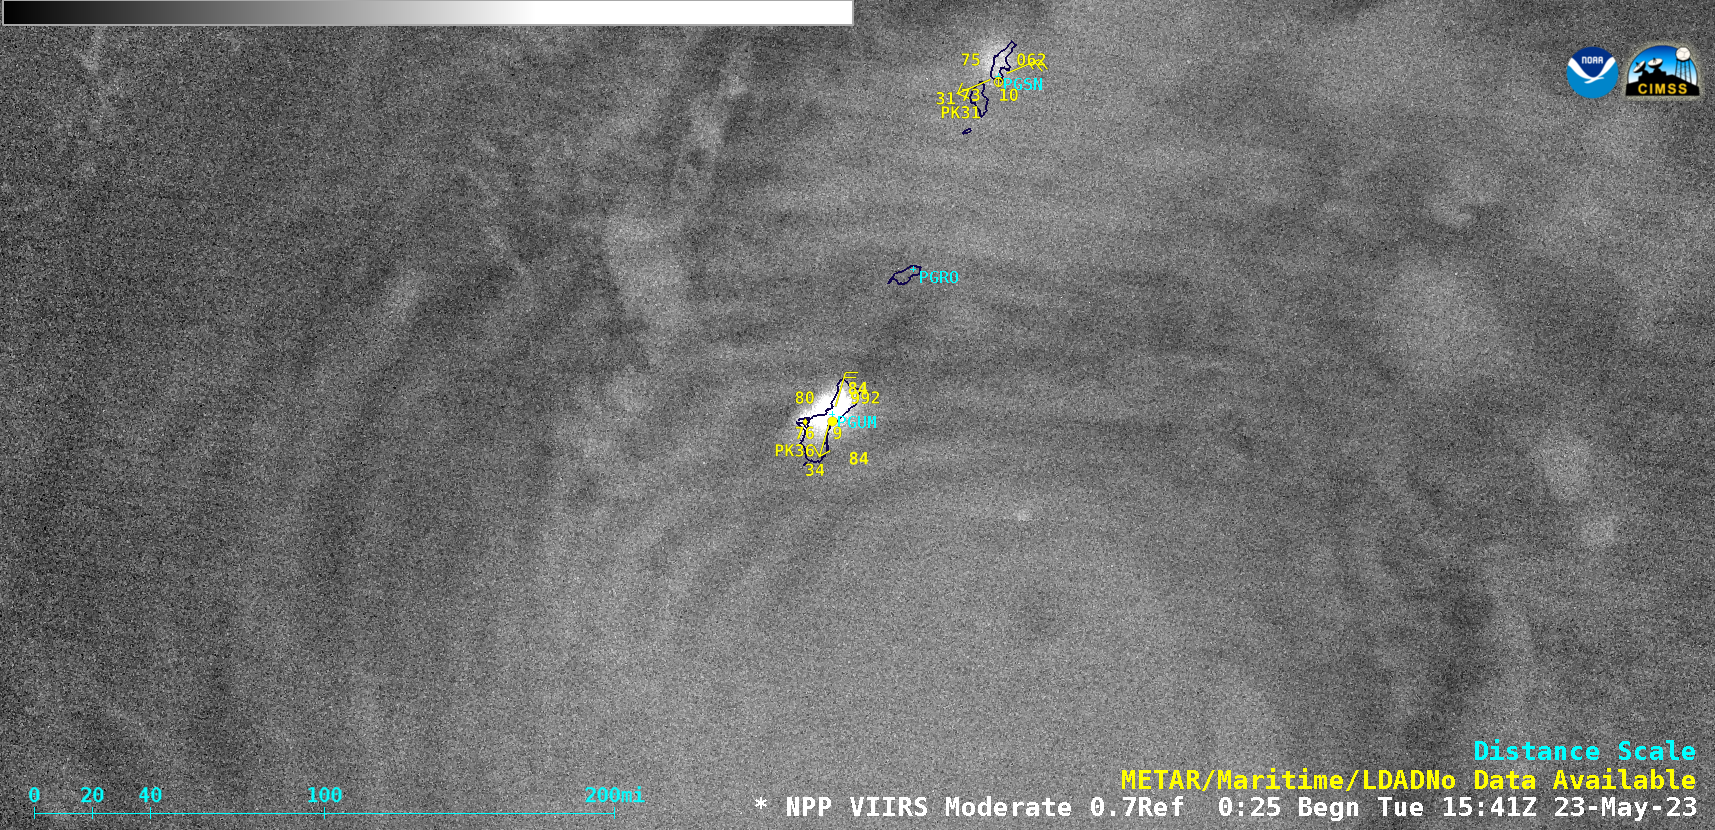
Suomi-NPP VIIRS Day/Night Band (0.7 µm) image, valid at 1554 UTC on 23 May [click to enlarge]