This website works best with a newer web browser such as Chrome, Firefox, Safari or Microsoft
Edge. Internet Explorer is not supported by this website.
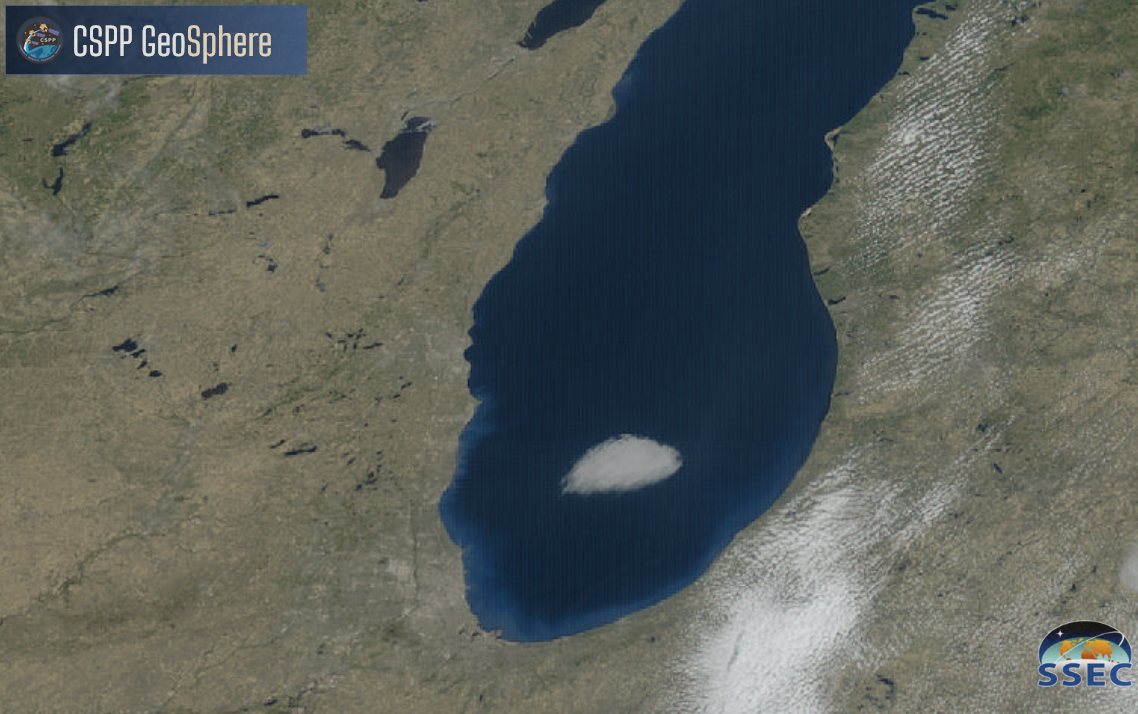
Imagery from the CSPP Geosphere site, above (link to animation), shows a curiously static low cloud (click here to see mp4 of cloud heights) separating from clouds along the southern shore of Lake Michigan and subsequently moving north. For several hours the cloud persists, until it moves under cirrus streaming in from the west, at which point it dissipates rapidly. The... Read More
GOES-16 Night Microphysics RGB and True Color RGB over southern Lake Michigan, 1150 UTC – 2110 UTC 2 March 2024
Imagery from the CSPP Geosphere site, above (link to animation), shows a curiously static low cloud (click here to see mp4 of cloud heights) separating from clouds along the southern shore of Lake Michigan and subsequently moving north. For several hours the cloud persists, until it moves under cirrus streaming in from the west, at which point it dissipates rapidly. The reason for its persistence and dissipation is left as an exercise for the reader.
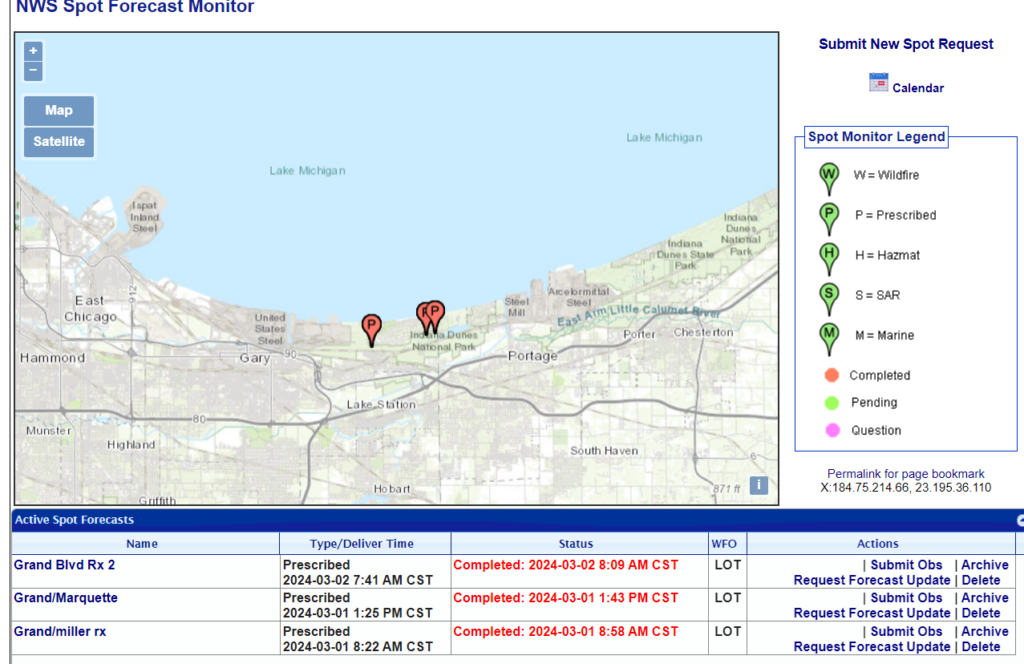
In the inbox, from a forecaster at WFO GRR: “…prescribed burns occurred on March 1st and 2nd in/near Indiana Dunes. At the end of the loop you can see the smoke plume from that area. Could that cloud feature have been something linked to the two burns the day prior?” The controlled burn locations are shown below. In addition to the smoke plume at the end of the animation above, there are several pixels — magenta — that could be hot spots at the start of the animation. (In reality, those pixels might also be industrial activity).
CSPPGeo software to create LightningCast probability fields is in (pre-Beta stage) testing at CIMSS (as noted in this recent blog post). In addition to creating output using GOES-R data, the software will also create imagery from Himawari-9 data. There is a RealEarth instance for LightningCast probability that includes a small Guam sector cut-out, but the CSPPGeo... Read More
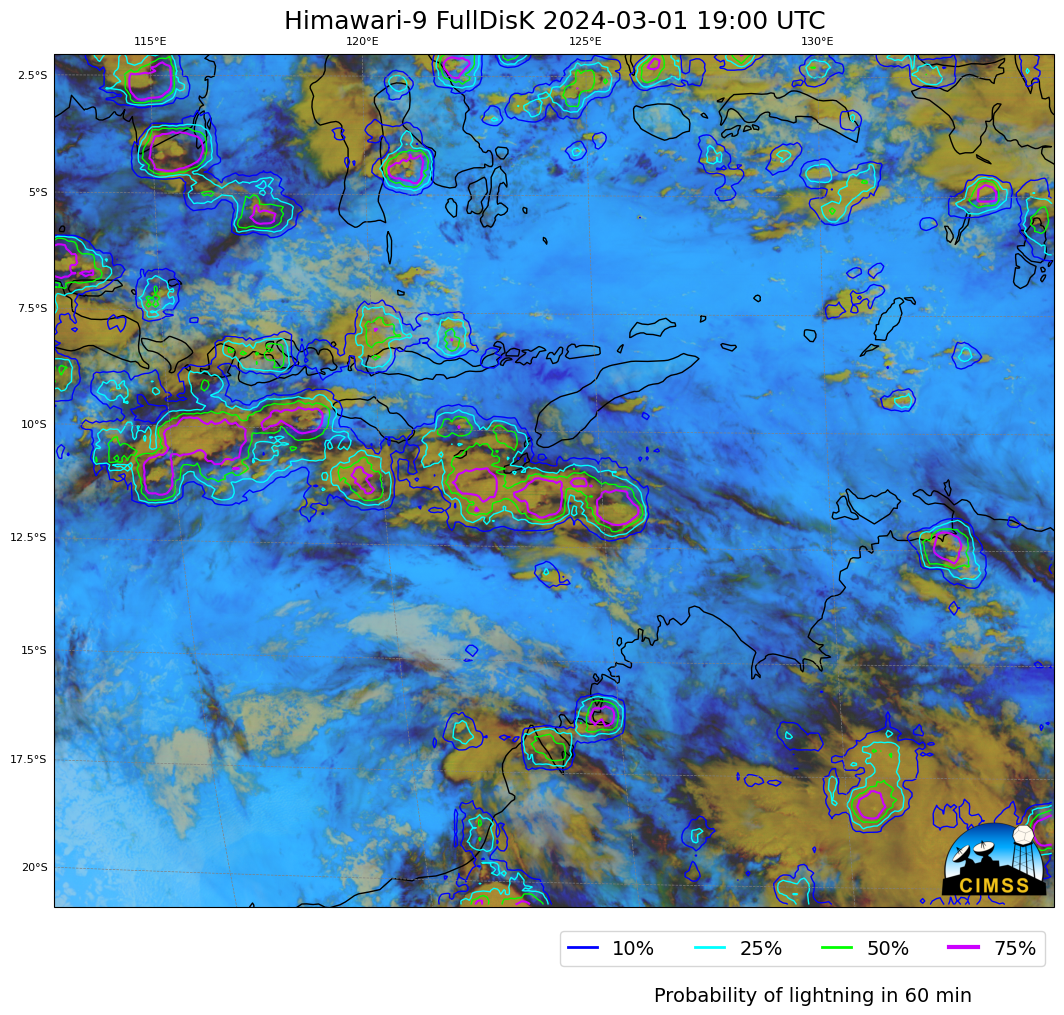
CSPPGeo LightningCast Probability fields, 1900 UTC on 1 March 2024 (Click to enlarge); contours over the RGB show the likelihood of lightning in the next 60 minutes (Click to enlarge)
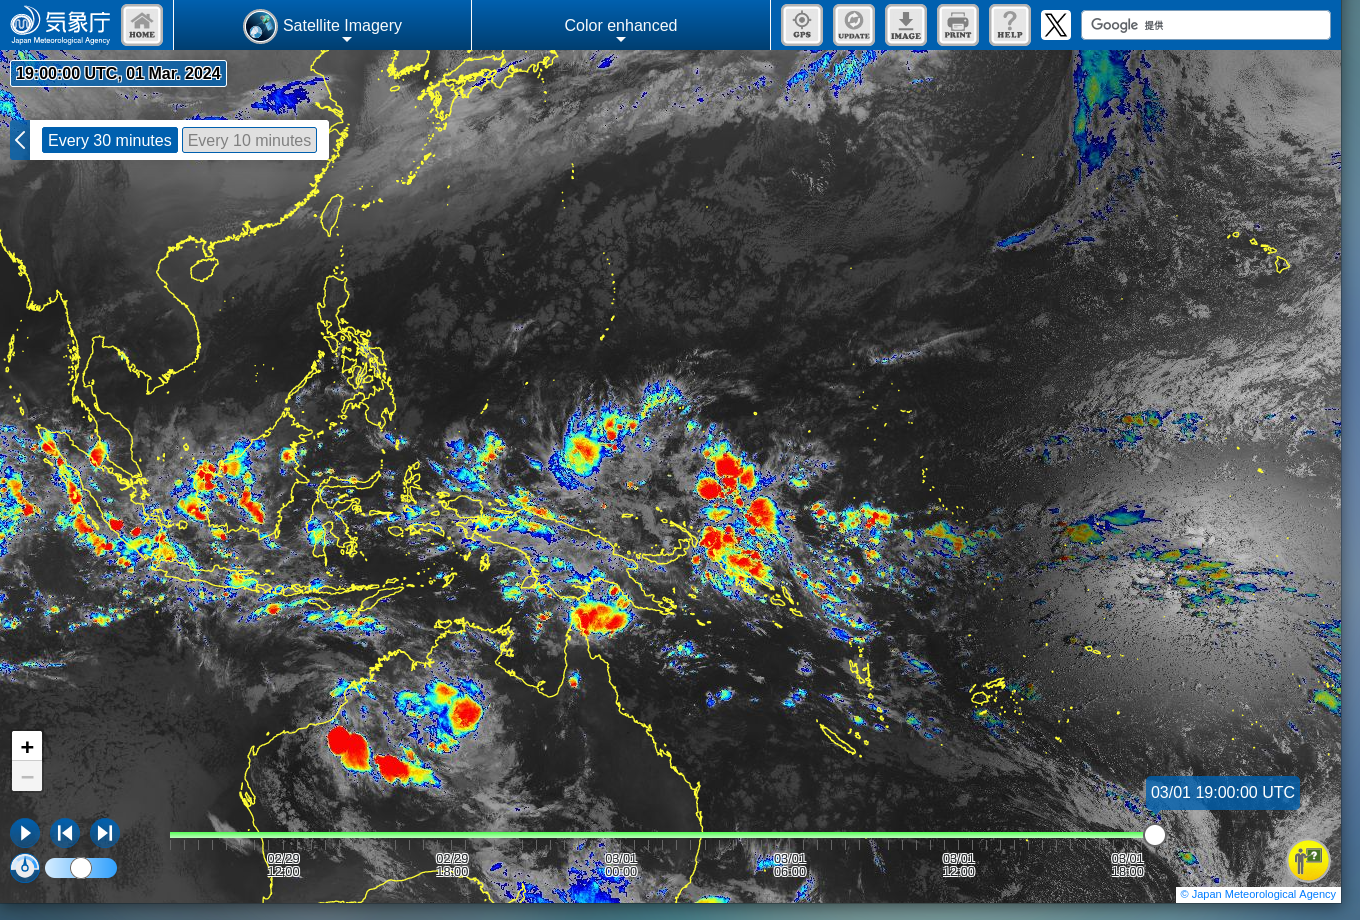
CSPPGeo software to create LightningCast probability fields is in (pre-Beta stage) testing at CIMSS (as noted in this recent blog post). In addition to creating output using GOES-R data, the software will also create imagery from Himawari-9 data. There is a RealEarth instance for LightningCast probability that includes a small Guam sector cut-out, but the CSPPGeo LightningCast software allows a cutout to be created anywhere within the Himawari-9 footprint! The image above shows LightningCast probabilities for portions of northwestern Australia and adjacent oceans/islands to the north. Himawari clean window infrared (10.4 µm) imagery for the same time (from this site) is shown below. LightningCast tells you which of the convective-looking clouds are most likely to be producing lightning in the next 60 minutes. The domain for LightningCast Probability was restricted to a subset of the Full Disk image, from -21oS to -2oS and from 110oE to 135oE.
Himawari-9 Clean Window infrared (Band 13, 10.4 µm) imagery, 1900 UTC on 1 March 2024 (Click to enlarge)
Thanks to John Cintineo (CIMSS) and Levi Pfantz (CIMSS) for their work on this CSPPGeo product.
December 2023 through February 2024 was a period of exceptional wetness over the Samoan Islands. Pago Pago received 68″ of rain during that period (this was the 4th greatest total since the 1950s!!). In the past week, however, the moisture of the South Pacific Convergence Zone has shifted away from... Read More
Total Precipitable Water, 2000 UTC on 27 February to 1900 UTC on 28 February 2024 (Click to enlarge)
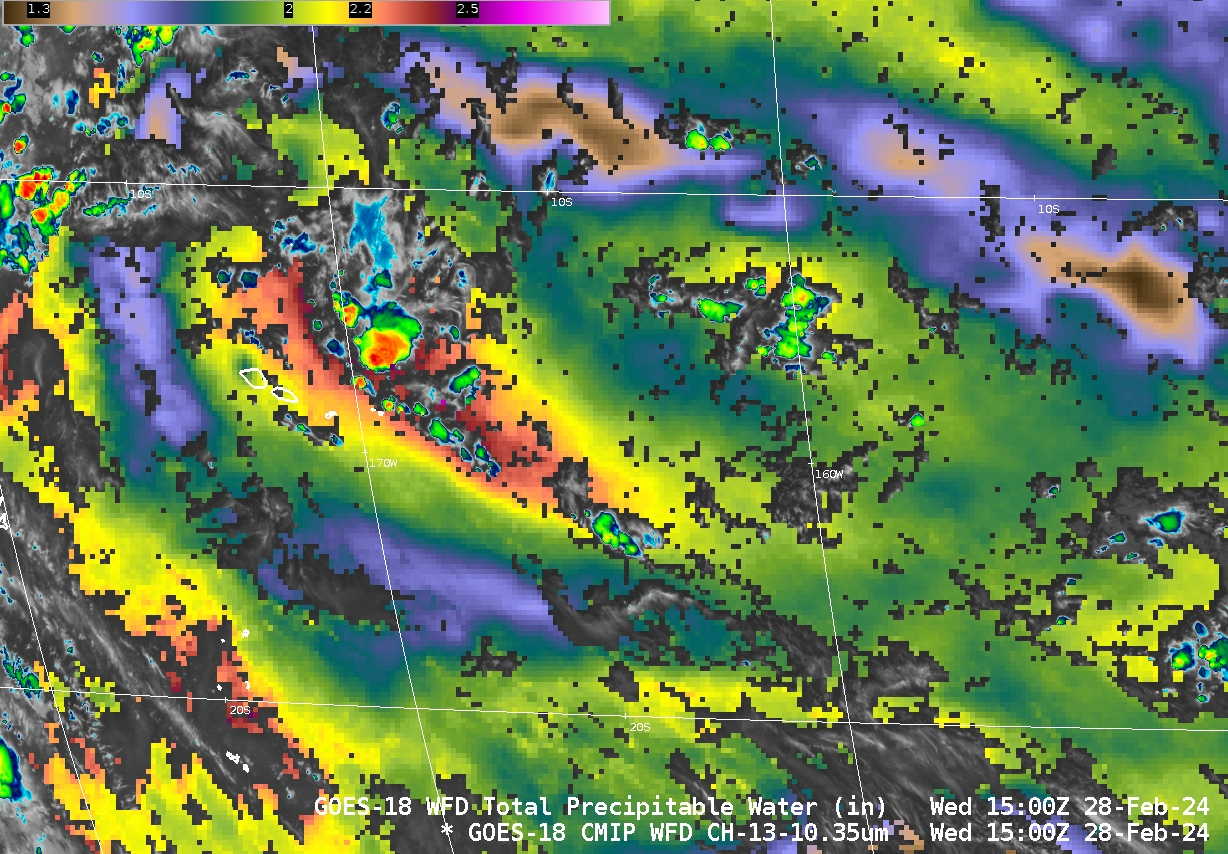
December 2023 through February 2024 was a period of exceptional wetness over the Samoan Islands. Pago Pago received 68″ of rain during that period (this was the 4th greatest total since the 1950s!!). In the past week, however, the moisture of the South Pacific Convergence Zone has shifted away from American Samoa. The relatively clear skies that have followed mean a couple things. Pago Pago had record heat on 27 February (96oF), and Level 2 products that require clear skies are useful again. The animation above shows MIMIC Total Precipitable Water for the 24 hours endings at 1900 UTC on 28 February. The animation below shows GOES-West Band 13 imagery overlain with Level 2 Total Precipitable Water, scaled from 1.2 to 2.7 inches. Note the trench of lower precipitable water values apparent in the MIMIC fields above has an echo in the Level 2 product. In general, convection is absent in that region but more prevalent in the higher values of total precipitable water that the trench of lower values surrounds.
GOES-West Band 13 infrared imagery (10.3 µm) and Total Preceipitable Water (scaled from 1.2 to 2.7 inches), 0000 to 1900 UTC on 28 February 2024 (Click to enlarge)
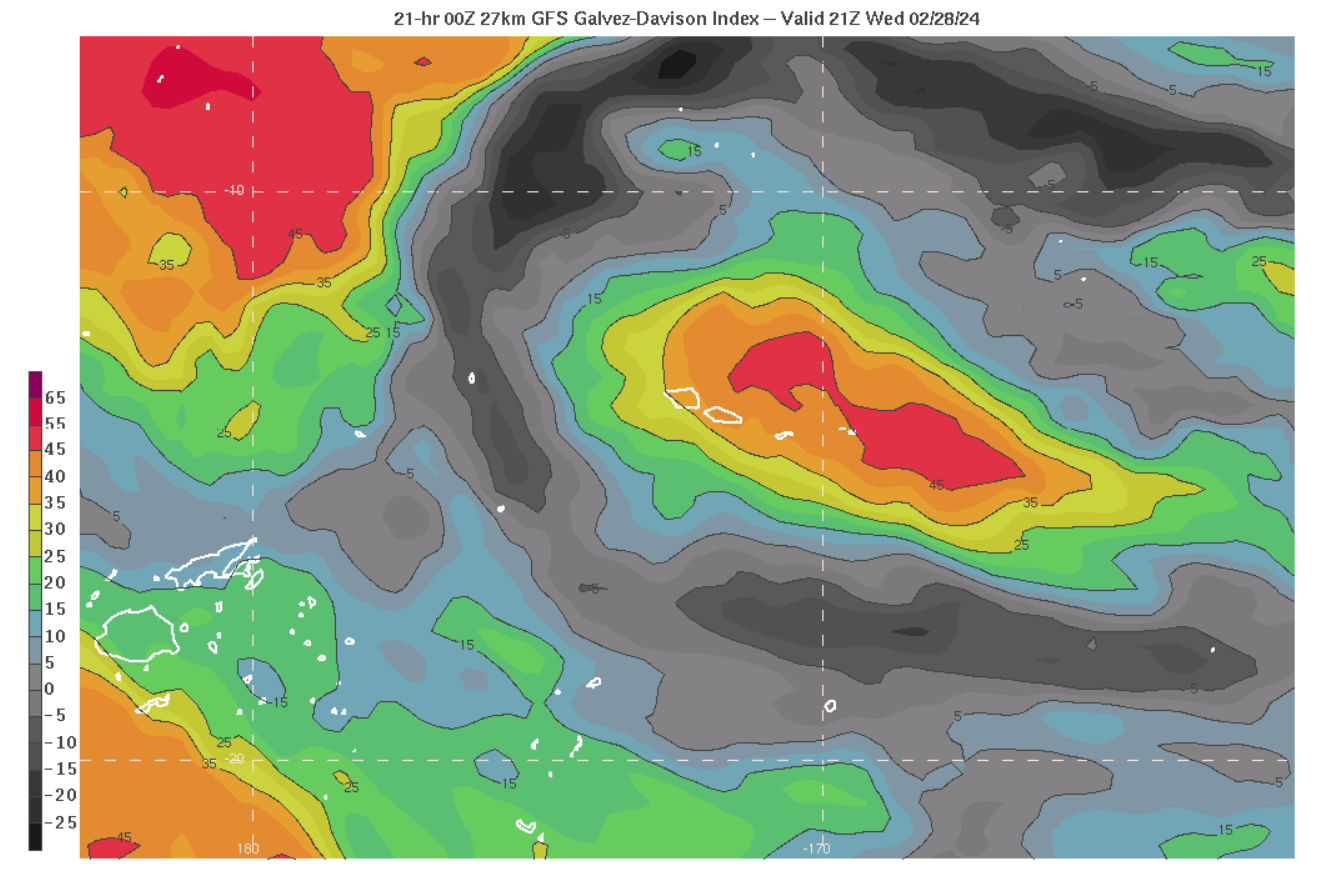
The Level 2 K Index, below, has a structure very similar to the Total Precipitable Water fields above. K-index is related to the Galvez-Davison Index (as shown in this blog post). The 21-h forecast of GDI is shown at bottom. There are great similarities in the structure of the K-Index, the TPW, and the GDI.
GOES-West Band 13 infrared imagery (10.3 µm) and K-Index (scaled from 10 to 40), 0000 to 1900 UTC on 28 February 2024 (Click to enlarge)21-h forecast of GDI valid 2100 UTC on 28 February 2024 (click to enlarge)
Level 2 Products from GOES-18 can be used to approximate the Galvez-Davison Index.
The Smokehouse Creek fire (inciweb link) as of 29 February is the largest fire in Texas history. VIIRS True-Color imagery above shows an extensive smoke plume (and a lot of other clouds!) over the eastern part of the north Texas Panhandle between 1830 and 2015 UTC on 27 February. Surface observations... Read More
VIIRS True Color Imagery, 1827, 1919 and 2015 UTC on 27 February 2024 (Click to enlarge) Surface Observations are also plotted.
The Smokehouse Creek fire (inciweb link) as of 29 February is the largest fire in Texas history. VIIRS True-Color imagery above shows an extensive smoke plume (and a lot of other clouds!) over the eastern part of the north Texas Panhandle between 1830 and 2015 UTC on 27 February. Surface observations show very strong gusts from the west. In addition, a wind shift/cold front is moving southward into the domain by 2015 UTC, denoted by a line of cumulus cloud, with strong northerly winds behind it.
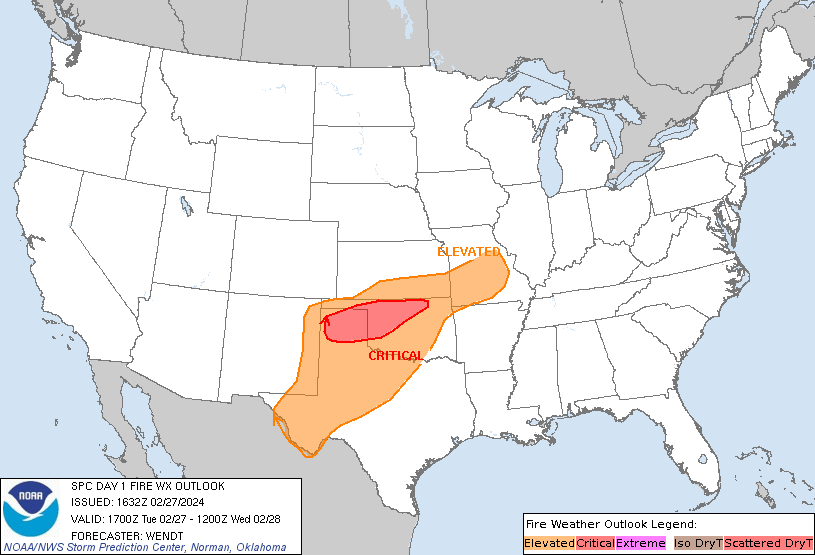
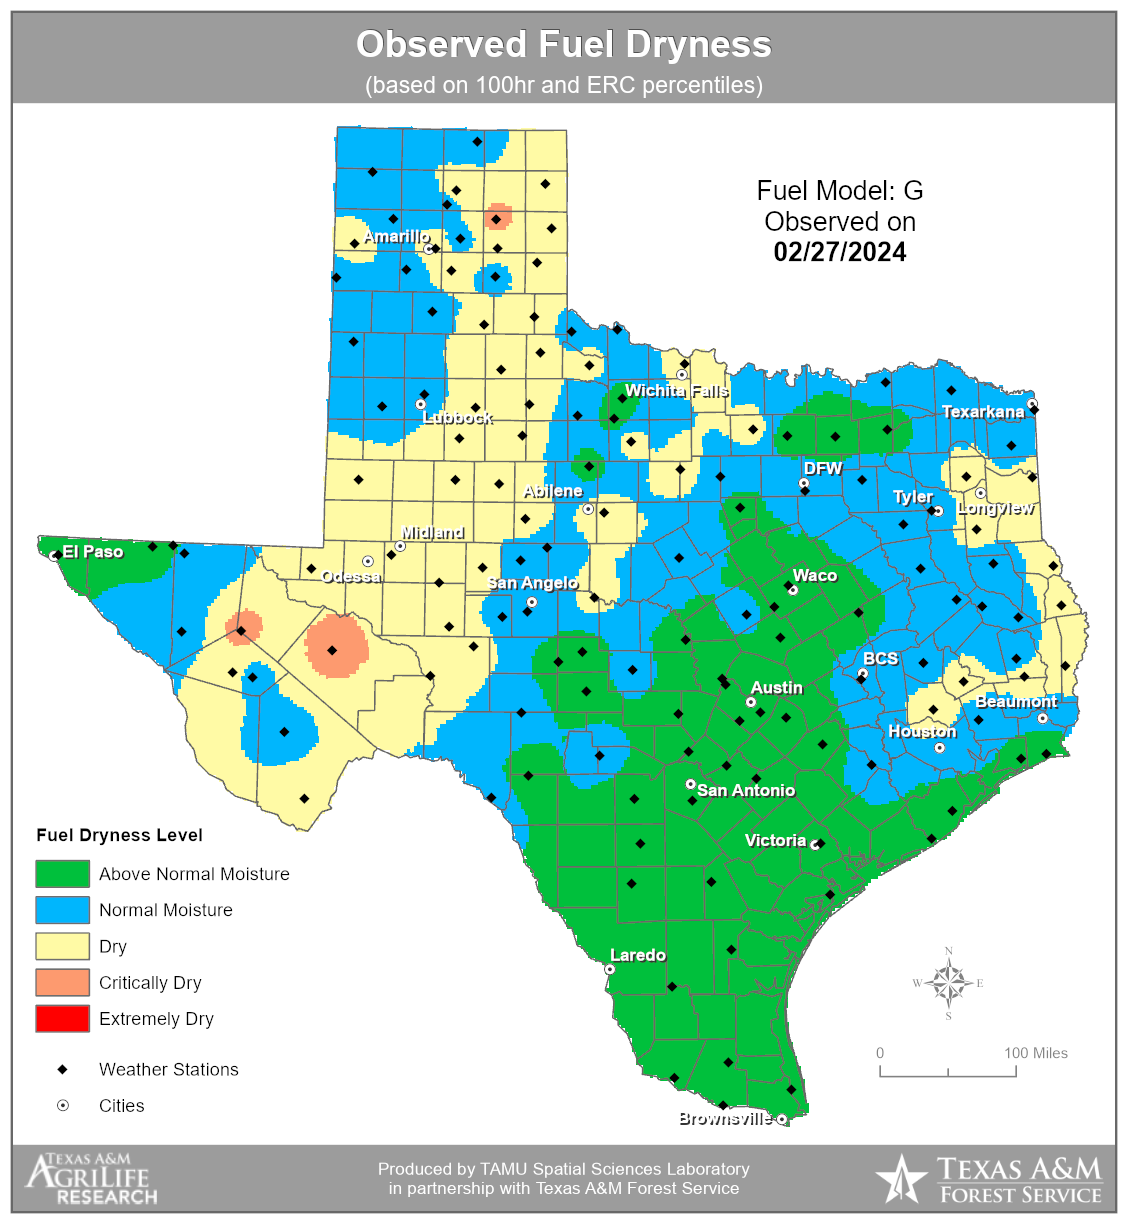
SPC’s fire weather outlook had parts of the north Texas panhandle in a critical fire weather outlook as shown below, especially because of strong wind gusts. The NWS in Lubbock has a fuel dryness image (the image for 27 February is here) and that shows the fire initiated in a region that was dry to critically dry. NWS Lubbock also has composite image for fire days (link). 27 February matches well.
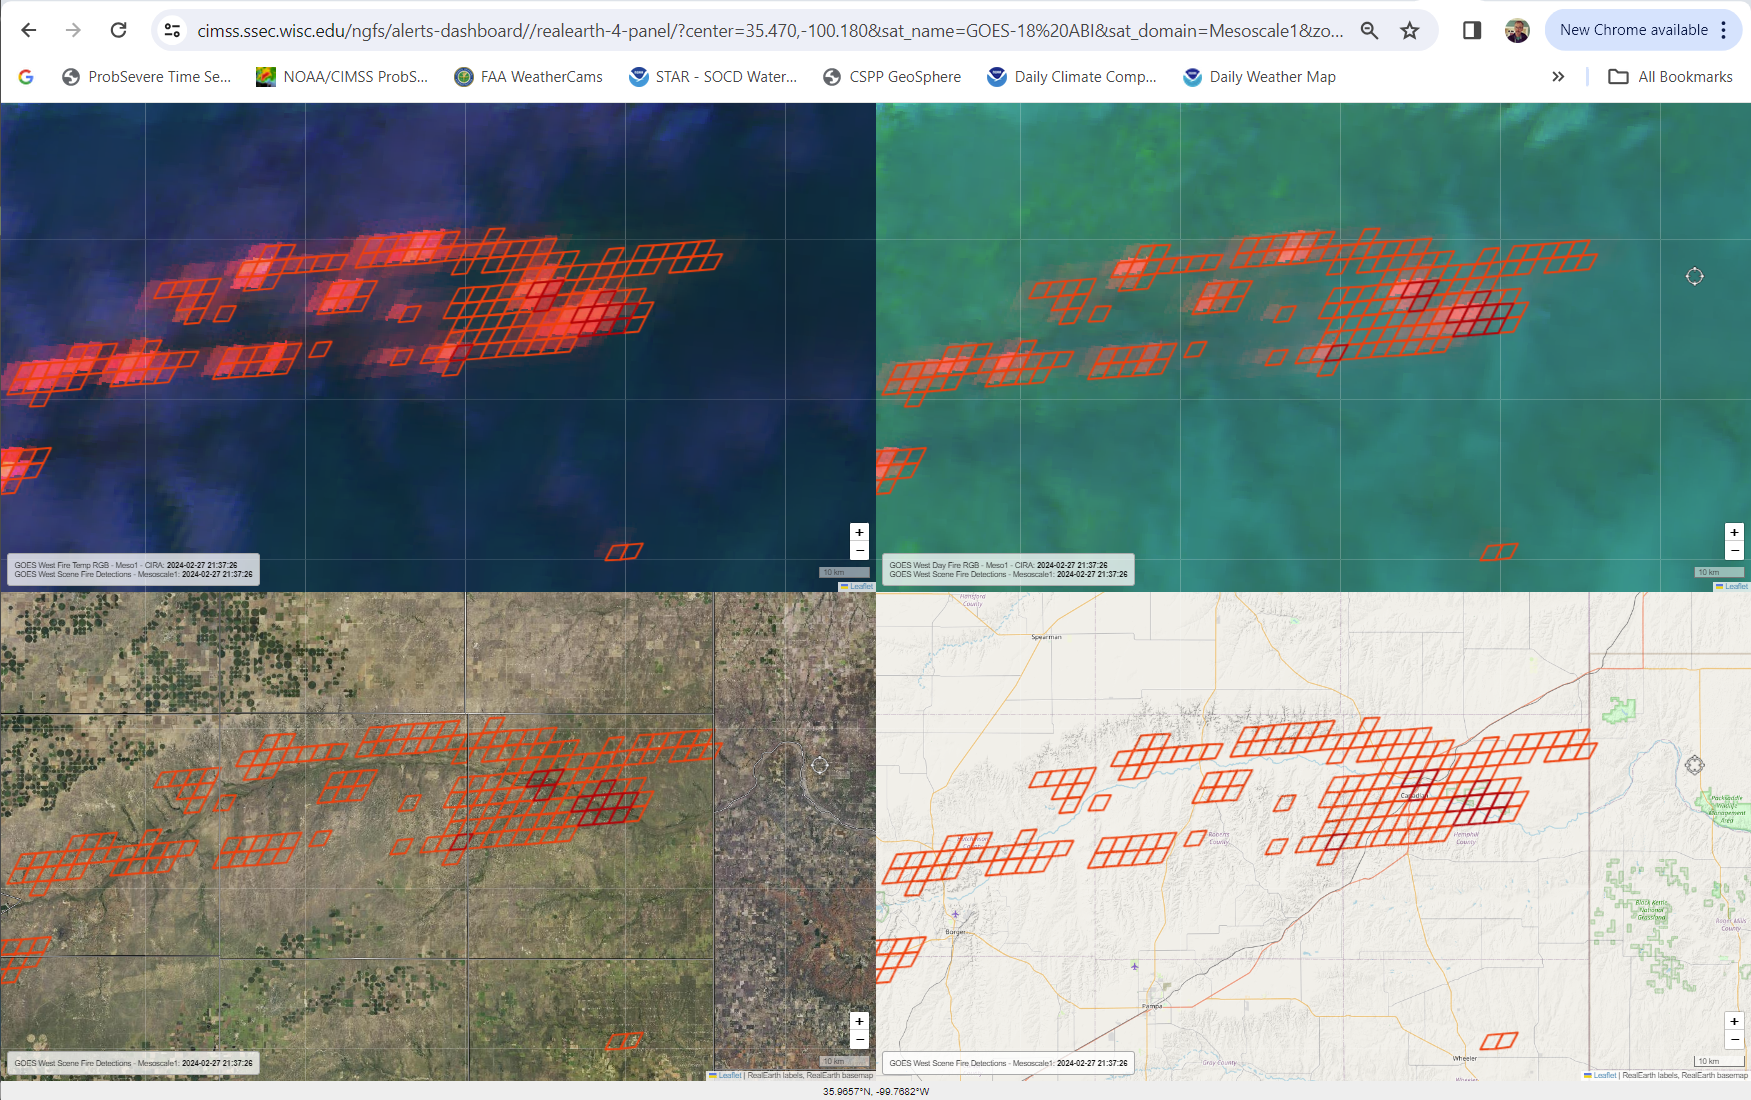
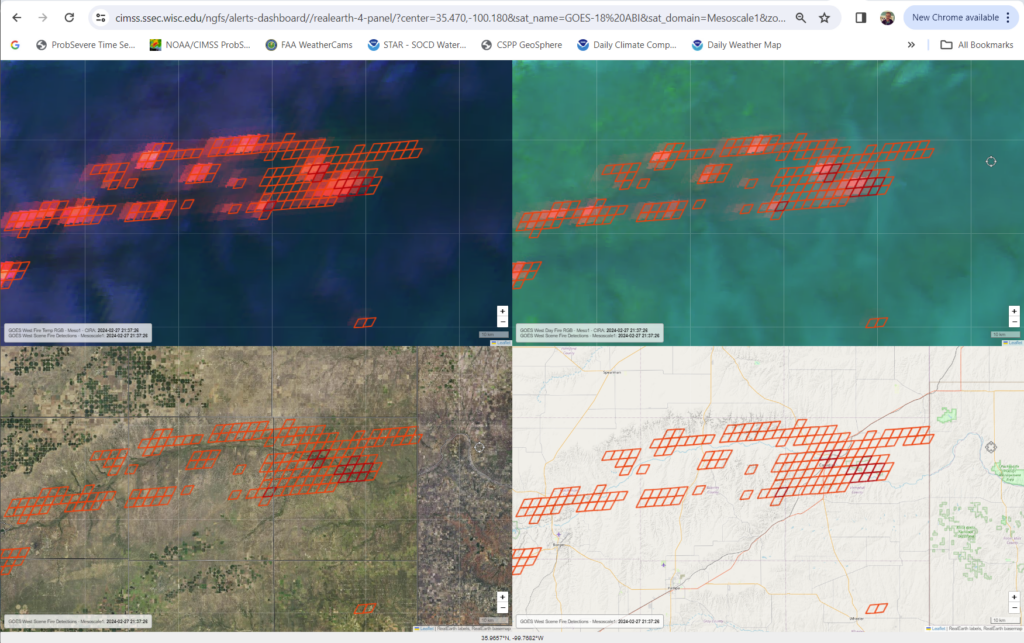
Fire Weather outlook, 1700 UTC on 27 February 2024 (Click to enlarge)NGFS 4-Panel imagery at 2137 UTC on 27 February 2024 (Click to enlarge)
The Next Generation Fire System (NGFS) has various imagery to help describe the current fire and its environment. For example, the imagery above from 2137 UTC on 27 February 2024, includes Fire Temperature RGB imagery (upper left), Day Fire RGB (upper right), GOES-West fire detection pixels (on top of True-color imagery, bottom left, and on top of a map, bottom right). This event included a large number of fire pixels detected, especially around the city of Canadian TX.
The animation of Fire Temperature RGB, below, from AWIPS, shows the evolution of the ongoing fire, and its interaction with a southward-moving cold front; when the front moves through the regions with fire (for example, near 2200 UTC in Canadian TX), the propagation of the fire switches from west-to-east to northwest-to-southeast. Satellite detection of the active fire is challenged at the end of the animation below because of increasingly thick upper-level clouds moving in from the southwest.
GOES-16 Fire Temperature RGB over north Texas 1506 UTC 27 February 2024 – 0331 UTC 28 February 2024 (Click to enlarge)
Night Microphysics RGB imagery, below, from the CSPP Geosphere site, show thick clouds over the fire region initially; by the end of the animation, however, hot spots in the Night Microphysics RGB (pixels that are magenta/pink) start to emerge.
GOES-East Night Microphysics RGB animation from CSPP Geosphere over north Texas, ca. 0300-0700 UTC on 28 February 2024
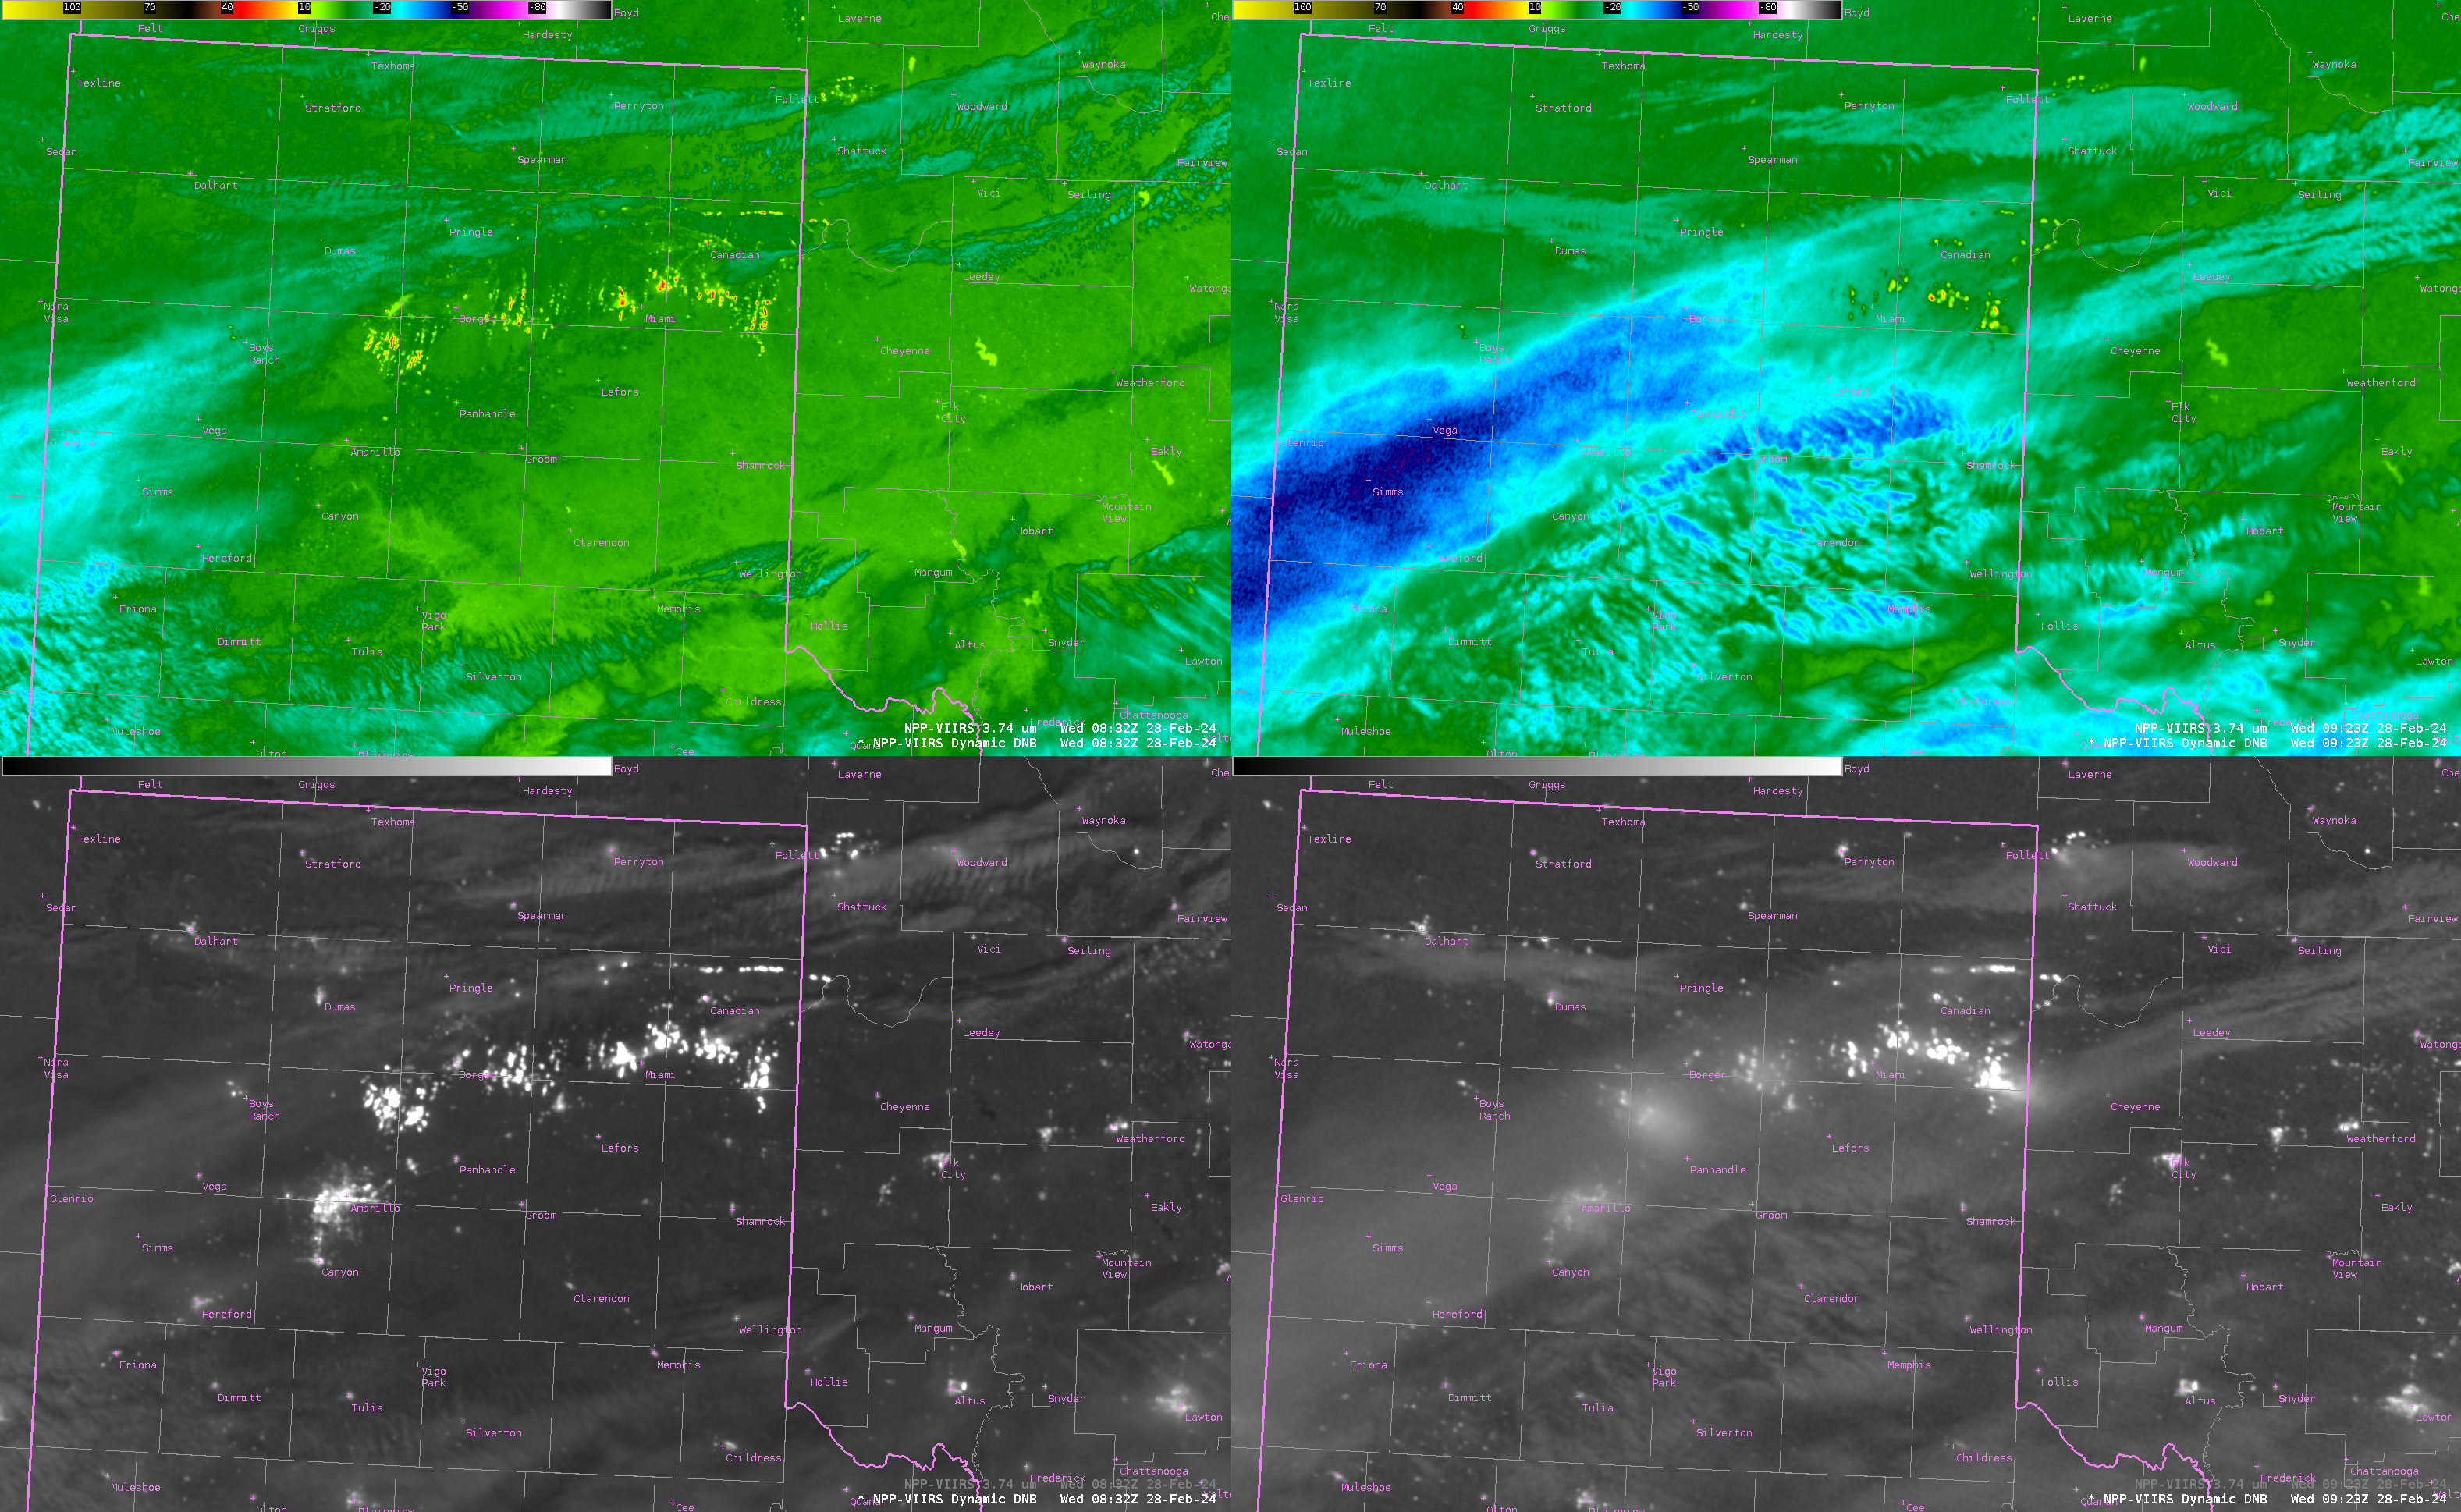
Day Night Band imagery from early on 28 February, reveals the light emitted from the fires. The I04 shortwave infrared (3.74 µm) imagery shows the heat signatures — that can help a user unfamiliar with a location differentiate fire signatures from urban lights. Relatively clear skies at 0823 UTC (on the left, click here for a toggle between the two VIIRS images at that time) allow an unimpeded view of the fires. By 0932 UTC (on the right, click here for a toggle between the two VIIRS images at that time), however, cirrus streaming in from the southwest is interfering with the satellite’s ability to detect hot spots although the light from the fires is able to penetrate the cloud deck.
Color-enhanced VIIRS I04 shortwave infrared (3.74 µm) imagery, top, and Day Night Band visible imagery (0.70 µm), bottom, at 0832 UTC (left) and 0923 UTC (right) (Click to enlarge)
VIIRS imagery from during the day on 28 February 2024, below, defines the large outline of the burnscar. The scar in the visible (0.64 µm) imagery is not quite so distinct as it is in 0.87 µm and 1.61 µm. The 3.74 µm (shortwave infrared) suggests that burning is continuing on 28 February. The False Color imagery uses information from the 1.61 µm and 0.87 µm bands. The burn scar is extensive, covering almost the entirety of several Texas counties!
VIIRS Imagery at 1900 UTC on 28 February 2024 (Click to enlarge): I01 (0.64 µm), I02 (0.87 µm), I03 (1.61 µm), I04 (3.74 µm) and False Color imagery
In a toggle between VIIRS False Color RGB imagery and the GOES-16 Land Surface Temperature (LST) derived product at 1900 UTC (below), LST values were up to 10ºF warmer (mid 80s F, darker shades of red) within darker-colored portions of the Smokehouse Creek Fire (in Roberts and Hutchinson counties) and Windy Deuce Fire (in Carson county) burn scars — compared to lighter-colored northern areas of the Smokehouse Creek burn scar (where LST values were mainly in the mid 70s F, shades of green). The presence of lingering smoke (which was incorrectly classified as Cloudy in the Clear Sky Mask derived product) prevented the derivation of LST values over all parts of those 2 burn scars.
Note that the large Smokehouse Creek Fire burn scar extended several miles eastward across the Texas/Oklahoma border, into parts of Ellis and Roger Hills counties.
VIIRS False Color RGB image and GOES-16 Land Surface Temperature derived product at 1900 UTC on 28 February; METAR surface reports are plotted in cyan, with Interstates and State Highways plotted in violet (courtesy Scott Bachmeier, CIMSS) [click to enlarge]
1-minute GOES-18 Shortwave Infrared (3.9 µm) images from 1855 UTC on 26 February to 0159 UTC on 27 February (courtesy Scott Bachmeier, CIMSS) [click to play animated GIF | MP4]
The Smokehouse Creek Fire began during the afternoon hours on 26 February, and 1-minute Mesoscale Domain Sector GOES-18 (GOES-West) Shortwave Infrared (3.9 µm) images (above) showed the rapid eastward run during its initial 7 hours — covering a distance of about 50 miles across Hutchinson and Roberts counties in the Texas Panhandle. Rapid eastward runs of the Grape Vine Creek Fire in Gray county and the Windy Deuce Fire along the Potter/Moore county line were also seen.
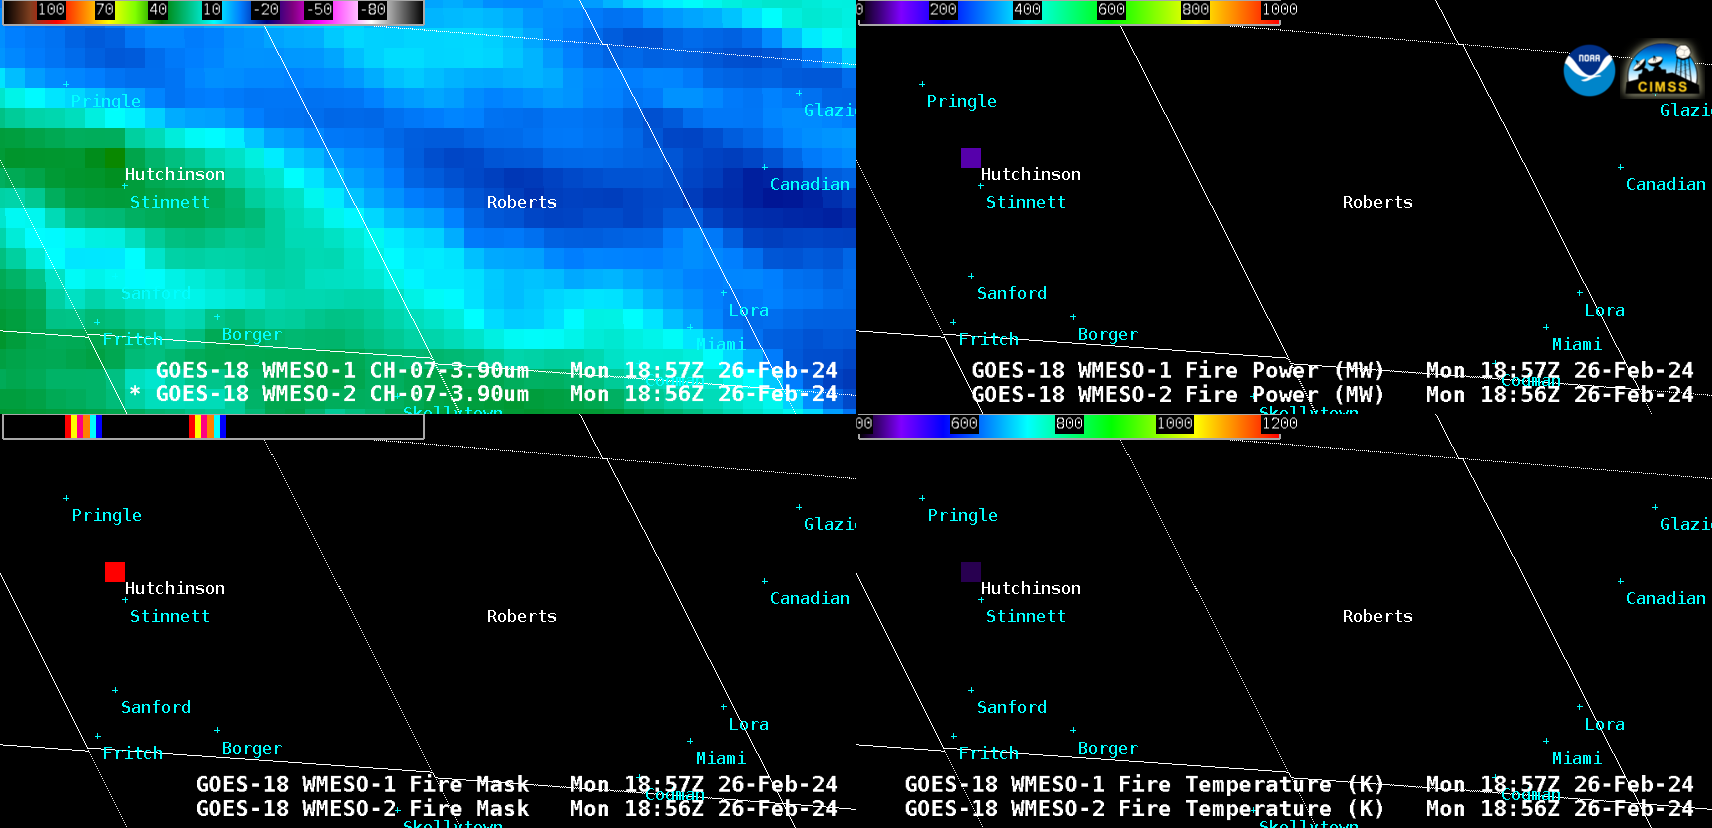
1-minute GOES-18 Shortwave Infrared images along with the Fire Power, Fire Mask and Fire Temperature derived products (3 components of the GOES Fire Detection and Characterization Algorithm FDCA) provided additional quantitative information about the fire during its eastward run (below). Although the InciWeb report listed the fire origin time as 14:20 CST (2020 UTC) just north of Stinnett in Hutchinson county, the initial signature in the GOES-18 FDCA products appeared at 1856 UTC (12:56 PM CST).
1-minute GOES-18 Shortwave Infrared images (3.9 µm, top left), Fire Power (top right), Fire Mask (bottom left) and Fire Temperature (bottom right) derived products, from 1855 UTC on 26 February to 0159 UTC on 27 February (courtesy Scott Bachmeier, CIMSS) [click to play animated GIF | MP4]
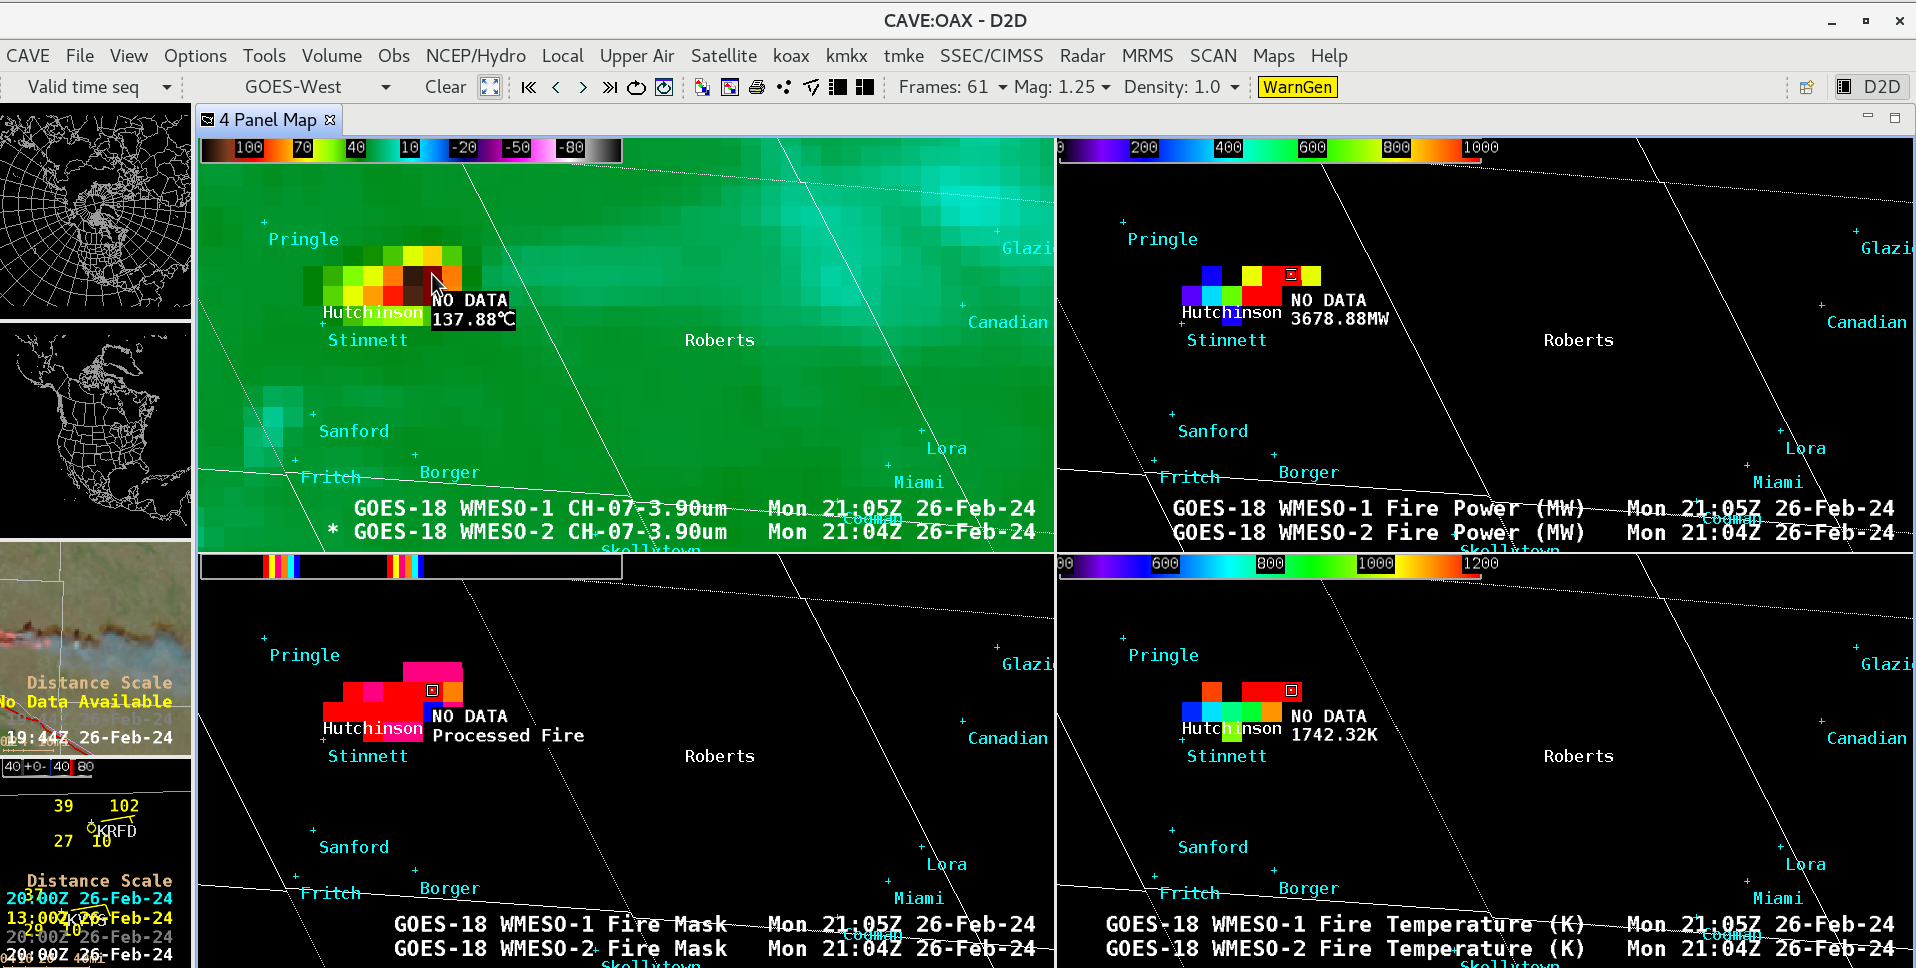
The Smokehouse Creek Fire burned very hot, exhibiting a maximum 3.9 µm infrared brightness temperature of 137.88ºC (which is the saturation temperature of the GOES-18 ABI Band 7 detectors) as early as 2104 UTC in eastern Hutchinson county (below). At that time and location, the derived Fire Power value was 3678.88 MW and the derived Fire Temperature value was 1742.32 K.
Cursor sample of GOES-18 Shortwave Infrared (3.9 µm) brightness temperature (top left), Fire Power (top right), Fire Mask (bottom left) and Fire Temperature (bottom right) at 2104 UTC on 26 February (courtesy Scott Bachmeier, CIMSS) [click to enlarge]
A longer (53-hour) animation of 5-minute GOES-16 (GOES-East) Shortwave Infrared images — centered on the Smokehouse Creek Fire — from 26-28 February (below) illustrated (1) the initial eastward run of the fire on 26 February, (2) the rapid increase in areal coverage and eastward expansion into far western Oklahoma on 27 February, as westerly winds increased in speed during the day (3) the abrupt southward expansion following the passage of a strong cold front late in the day on 27 February — note the shift from westerly to northerly winds in a plot of surface data from Borger Hutchinson County Airport (KBGD), and (4) the periodic masking of the fire signature as a patches of mid/high clouds moved across the region on 28 February.
5-minute GOES-16 Shortwave Infrared (3.9 µm) images, from 1856 UTC on 26 February to 2356 UTC on 28 February (courtesy Scott Bachmeier, CIMSS) [click to play animated GIF |MP4]

