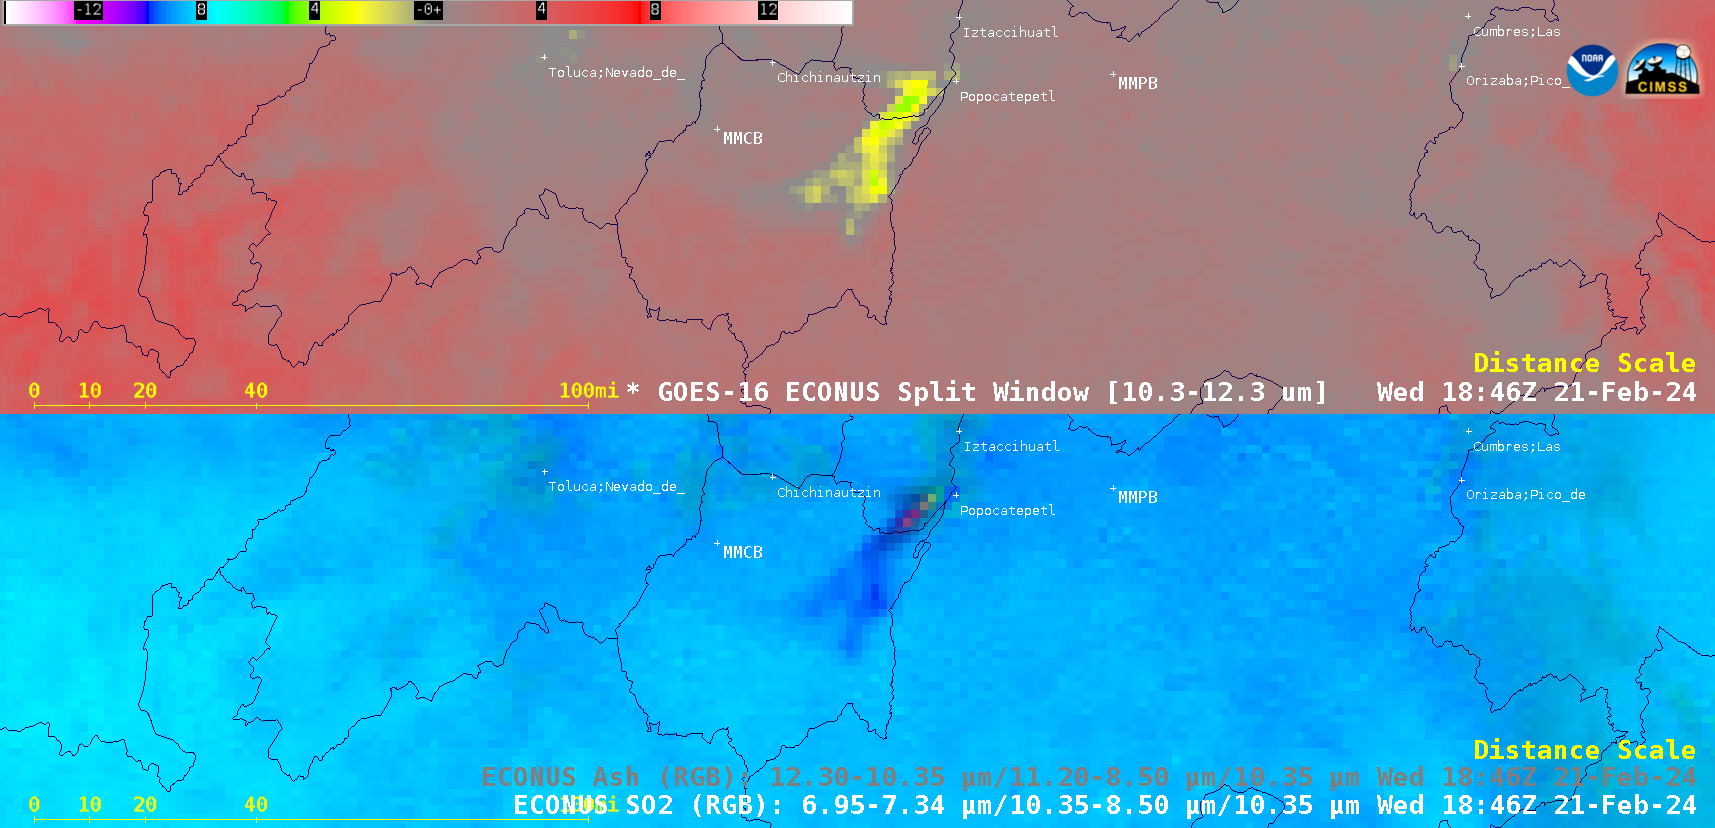
GOES-16 (GOES-East) Split Window Difference (10.3-12.3 µm) along with SO2 RGB and Ash RGB images (above) displayed signatures of volcanic clouds produced by a sequence of eruptions of Popocatépetl in Mexico on 21 February 2024. Although these volcanic clouds apppeared to be predominantly ash-dominated (shades of pink to magenta in the Ash RGB,... Read More
GOES-16 Split Window Difference (10.3-12..3 µm, top) along with SO2 RGB and Ash RGB images (bottom), from 0701 on 21 February to 0001 UTC on 22 February [click to play animated GIF | MP4]
GOES-16
(GOES-East) Split Window Difference (
10.3-12.3 µm) along with
SO2 RGB and
Ash RGB images
(above) displayed signatures of volcanic clouds produced by a sequence of eruptions of
Popocatépetl in Mexico on 21 February 2024. Although these volcanic clouds apppeared to be predominantly ash-dominated (shades of pink to magenta in the Ash RGB, and shades of blue in the SO2 RGB), there were brief indications of an SO2-ash mixture — in a toggle between the 2 RGB image types at 1846 UTC
(below), note the shades of green near the volcano summit (suggestive of SO2 dominance) and shades of orange in the Ash RGB with shades of pink to red in the SO2 RGB (suggestive of an ash/SO2 mixture) a few miles downwind of the summit.
GOES-16 Split Window Difference (10.3-12..3 µm, top) along with SO2 RGB and Ash RGB images (bottom), at 1846 UTC on 21 February [click to enlarge]
GOES-16
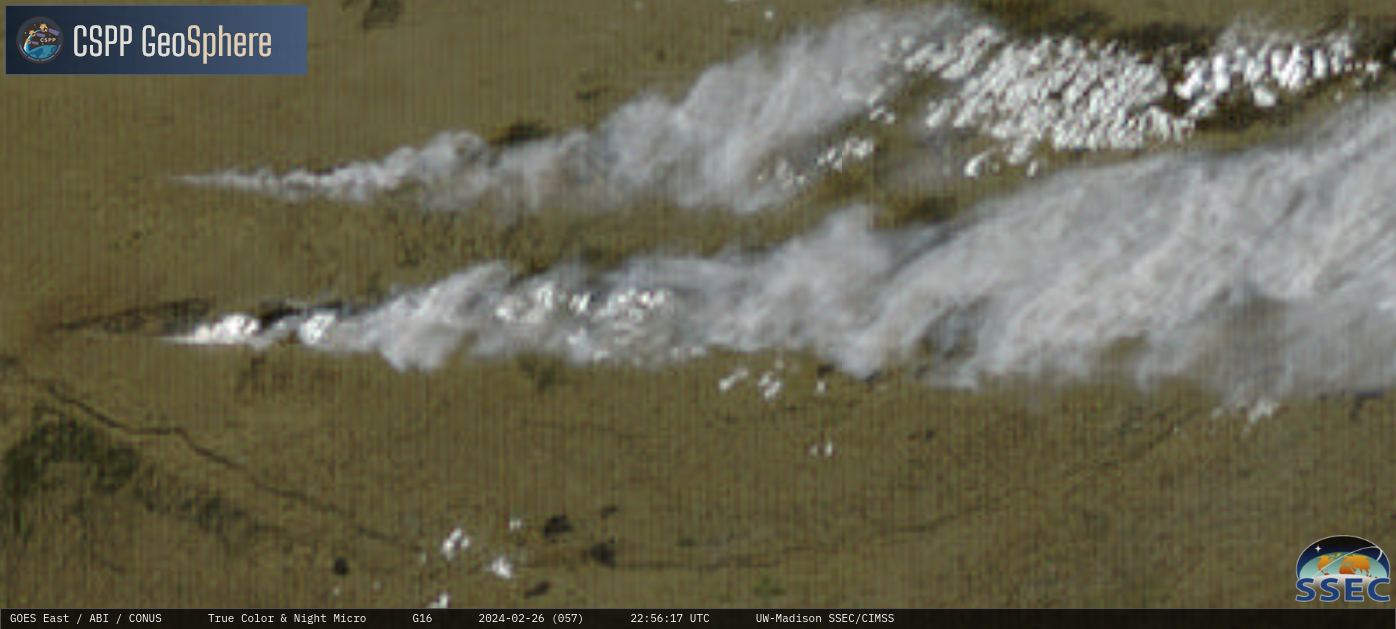
Nighttime Microphysics RGB + daytime True Color RGB images
(below) showed the west-southwest transport of the volcanic cloud (shades of pink to magenta) during the nighttime hours into the next morning, followed by additional volcanic cloud pulses that moved to the southwest during the afternoon hours
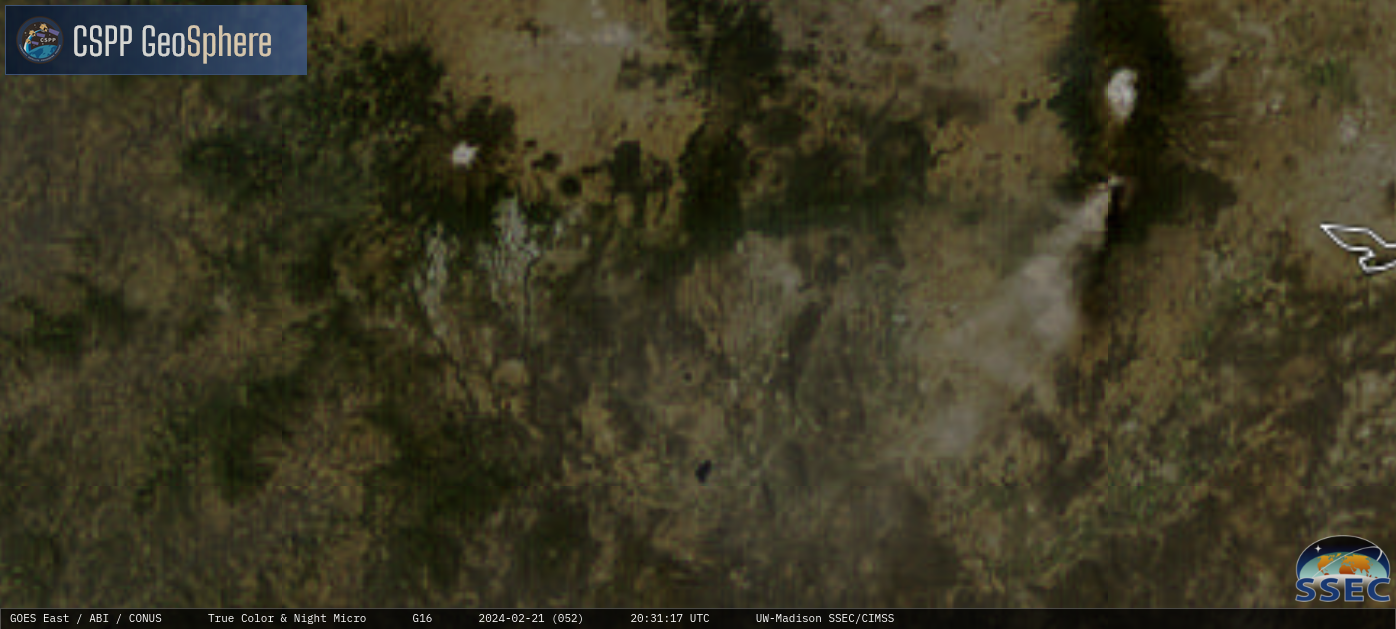
GOES-16 Nighttime Microphysics RGB + daytime True Color RGB images, from 0701-2356 UTC on 21 February [click to play MP4 animation]
For the afternoon eruption phase that began around 1700 UTC, GOES-16 False Color RGB, Ash Height, Ash Effective Radius and Ash Loading products from the
NOAA/CIMSS Volcanic Cloud Monitoring site
(below) indicated that the (predominantly ash) cloud reached heights of 6-7 km at times, with the ash consisting of generally small particles at relatively low levels of ash loading.
.png)
GOES-16 False Color RGB (top left), Ash Height (top right), Ash Effective Radius (bottom left) and Ash Loading (bottom right), from 1601 UTC on 21 February to 0001 UTC on 22 February [click to play animated GIF | MP4]
_____________________________
GOES-16 Split Window Difference (10.3-12..3 µm, top) along with SO2 RGB and Ash RGB images (bottom), from 1001 UTC on 22 February to 0001 UTC on 23 February [click to play animated GIF | MP4]
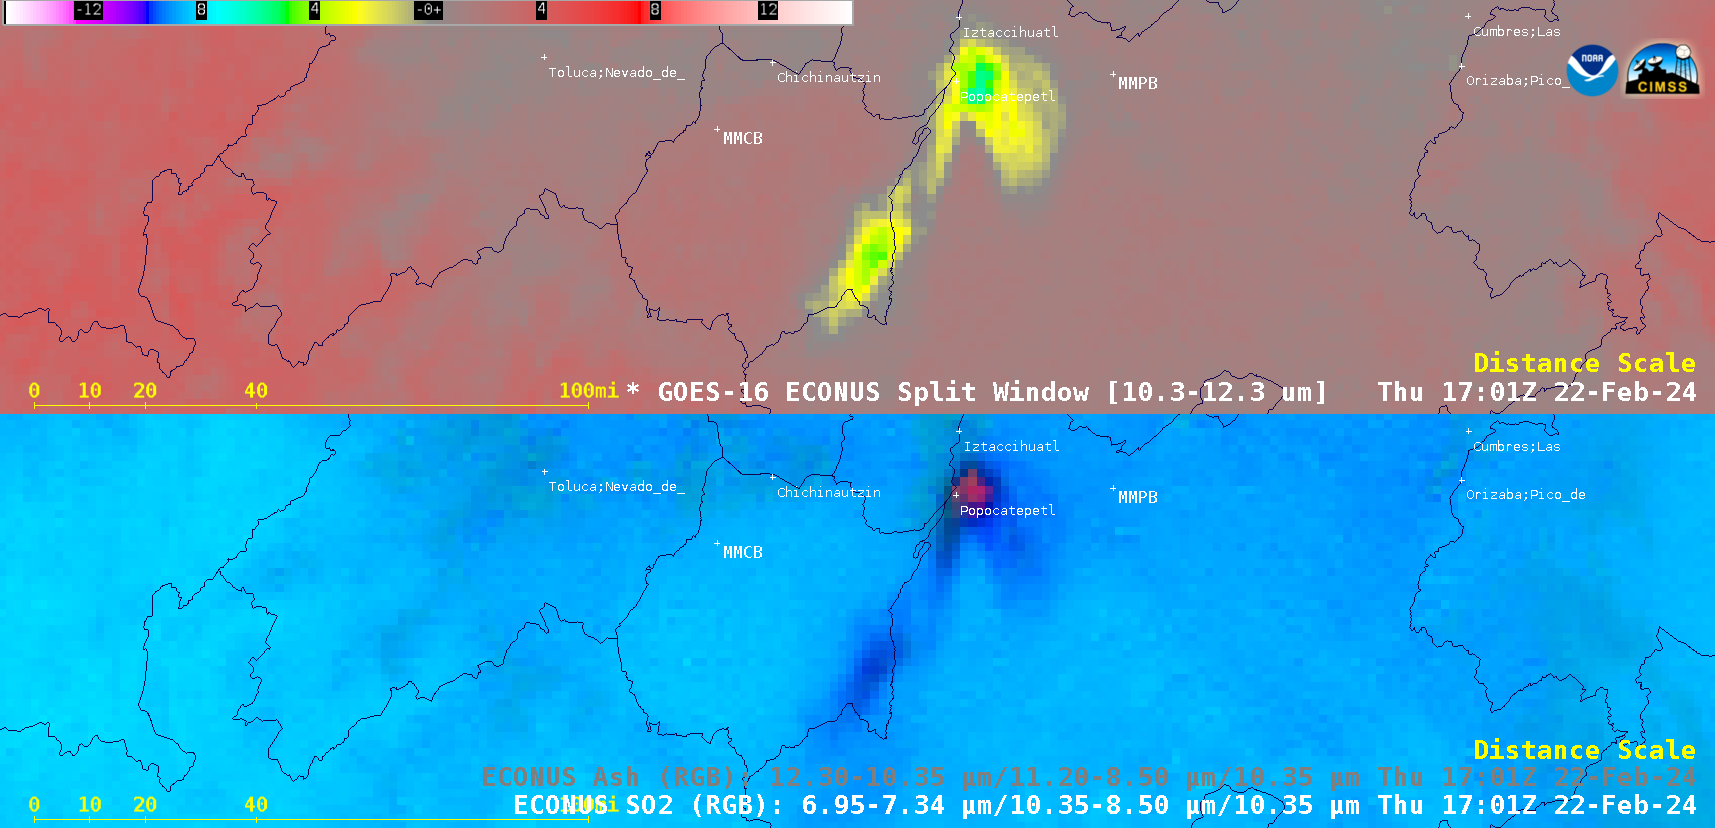
On the following day (22 February), GOES-16 Split Window Difference along with SO2 RGB and Ash RGB images
(above) showed the volcanic clouds produced by 2 additional eruptive periods — with the first cloud drifting southward, followed by the additional clouds drifting to the east-southeast.
During these eruptions, there were more notable indications of an SO2-ash mixture — for example, in a toggle between the 2 RGB image types at 1701 UTC (below), note the darker shades of orange in the Ash RGB along with brighter shades of pink to violet in the SO2 RGB (suggestive of an ash/SO2 mixture) immediately east of the volcano summit.
GOES-16 Split Window Difference (10.3-12..3 µm, top) along with SO2 RGB and Ash RGB images (bottom), at 1701 UTC on 22 February [click to enlarge]
GOES-16
Nighttime Microphysics RGB + daytime True Color RGB images
(below) showed the southward transport of volcanic clouds during the nighttime hours into the following morning, with additional volcanic cloud pulses that moved to the east during the afternoon hours.
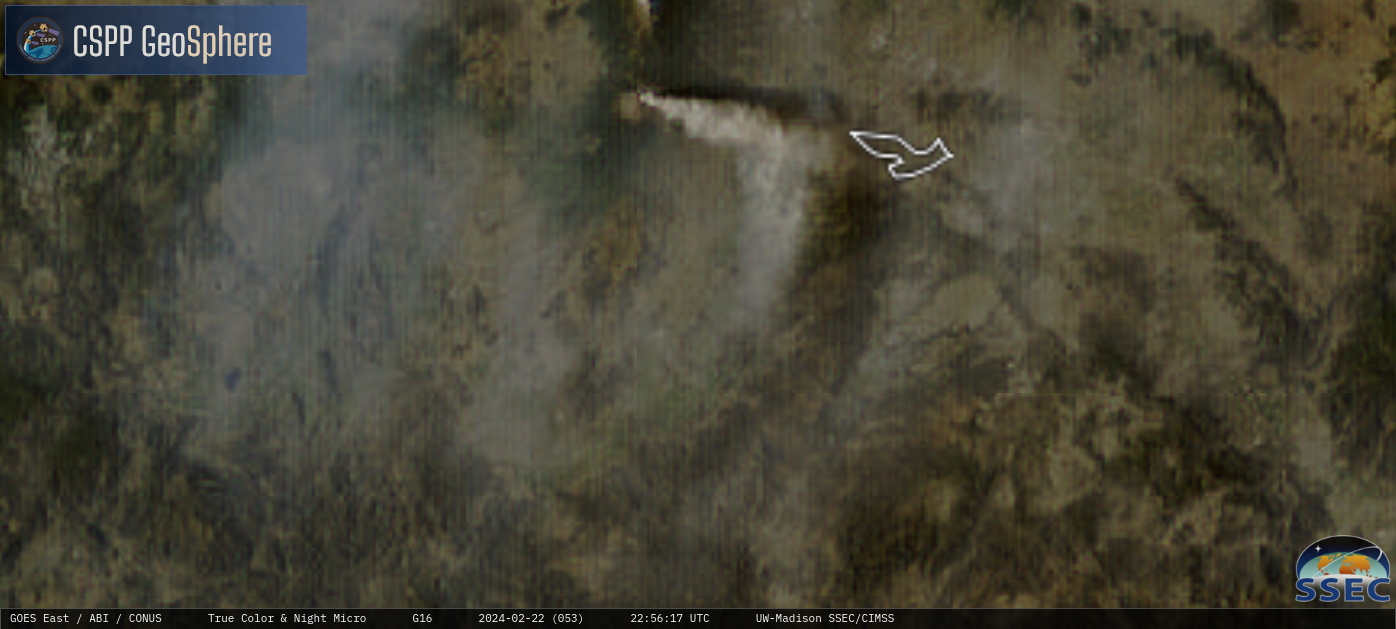
GOES-16 Nighttime Microphysics RGB + daytime True Color RGB images, from 1001-2346 UTC on 22 February [click to play MP4 animation]
View only this post
Read Less