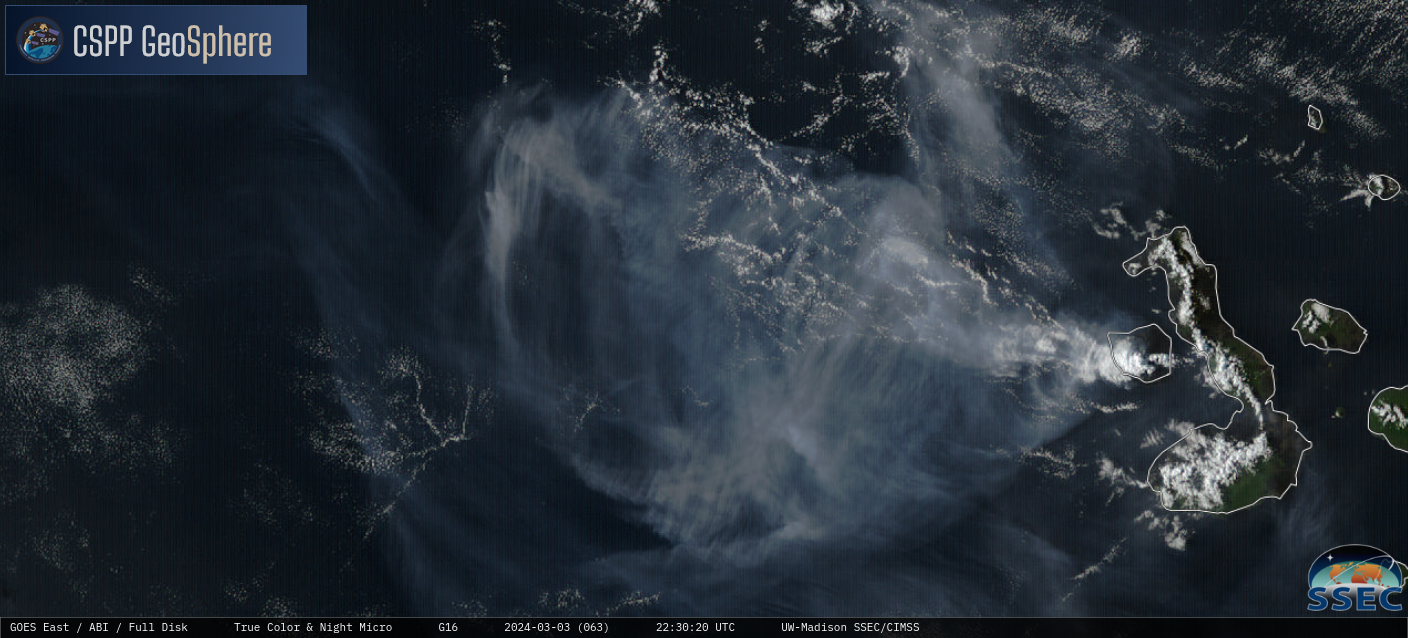
Parts of the Hawaiian Islands have been placed under Flood Warnings on 4 March 2024 (Link). Part of the reason for these heavy rains is unusually cold air aloft, at 500 mb. The animation above (from the CSPP Geosphere site — a direct link to the animation is here) shows a characteristic color change in the Night Microphysics around the Hawai’ian islands as convective showers develop, from light pinks/whites to red. How cold are the temperatures at 500 mb that are helping support this convection?
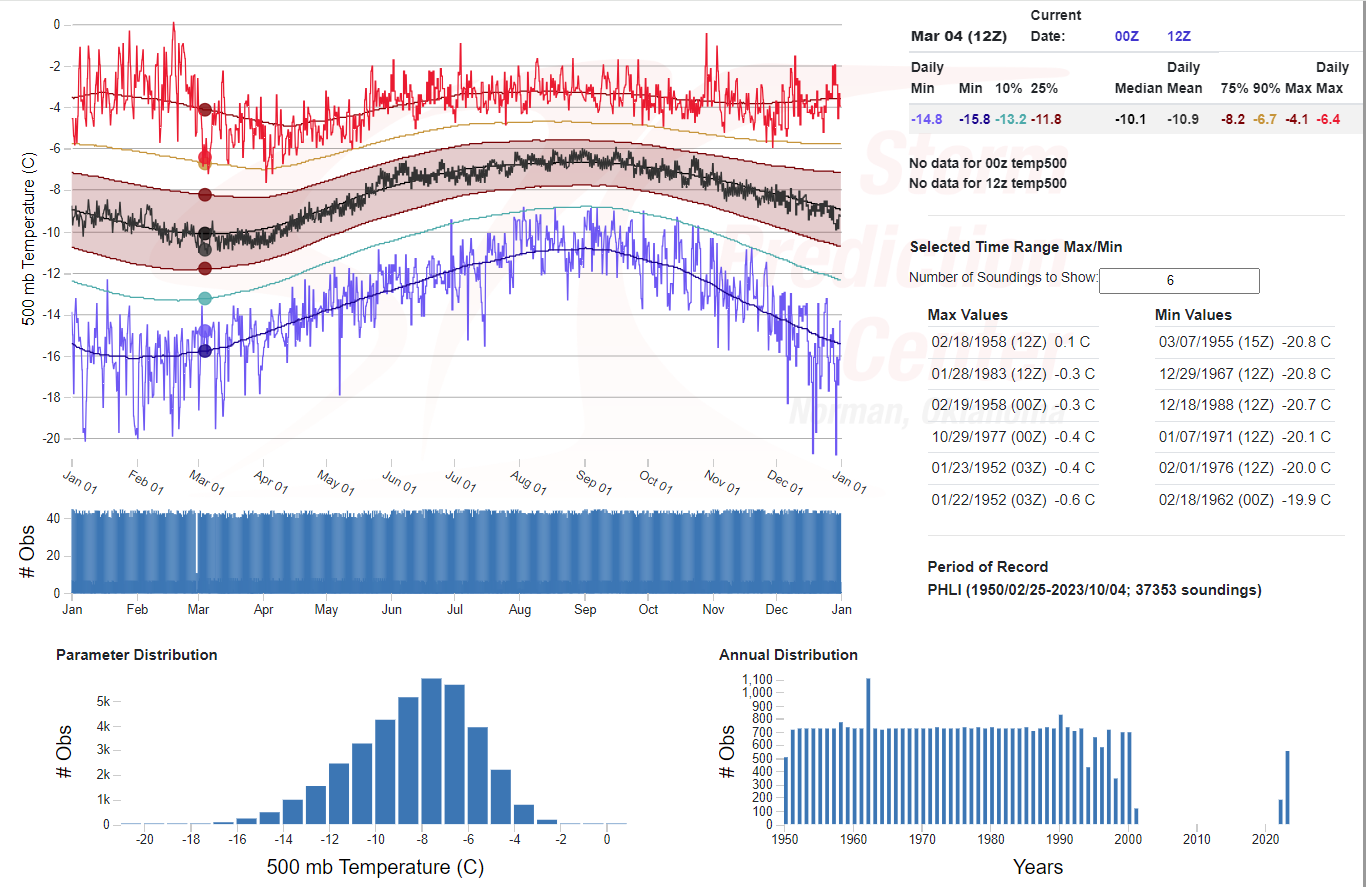
Soundings at Lihue at 0000 UTC on 2 March and 1200 UTC 4 March (above, from the University of Wyoming sounding site) show consistenly cold temperatures, at -14.7oC, although temperatures were warmer on 3 March, closer to -11oC. The 500-mb temperatures on 4 March at 1200 UTC were colder than all but <10% of the observations per the analysis below from the SPC Sounding analysis site.
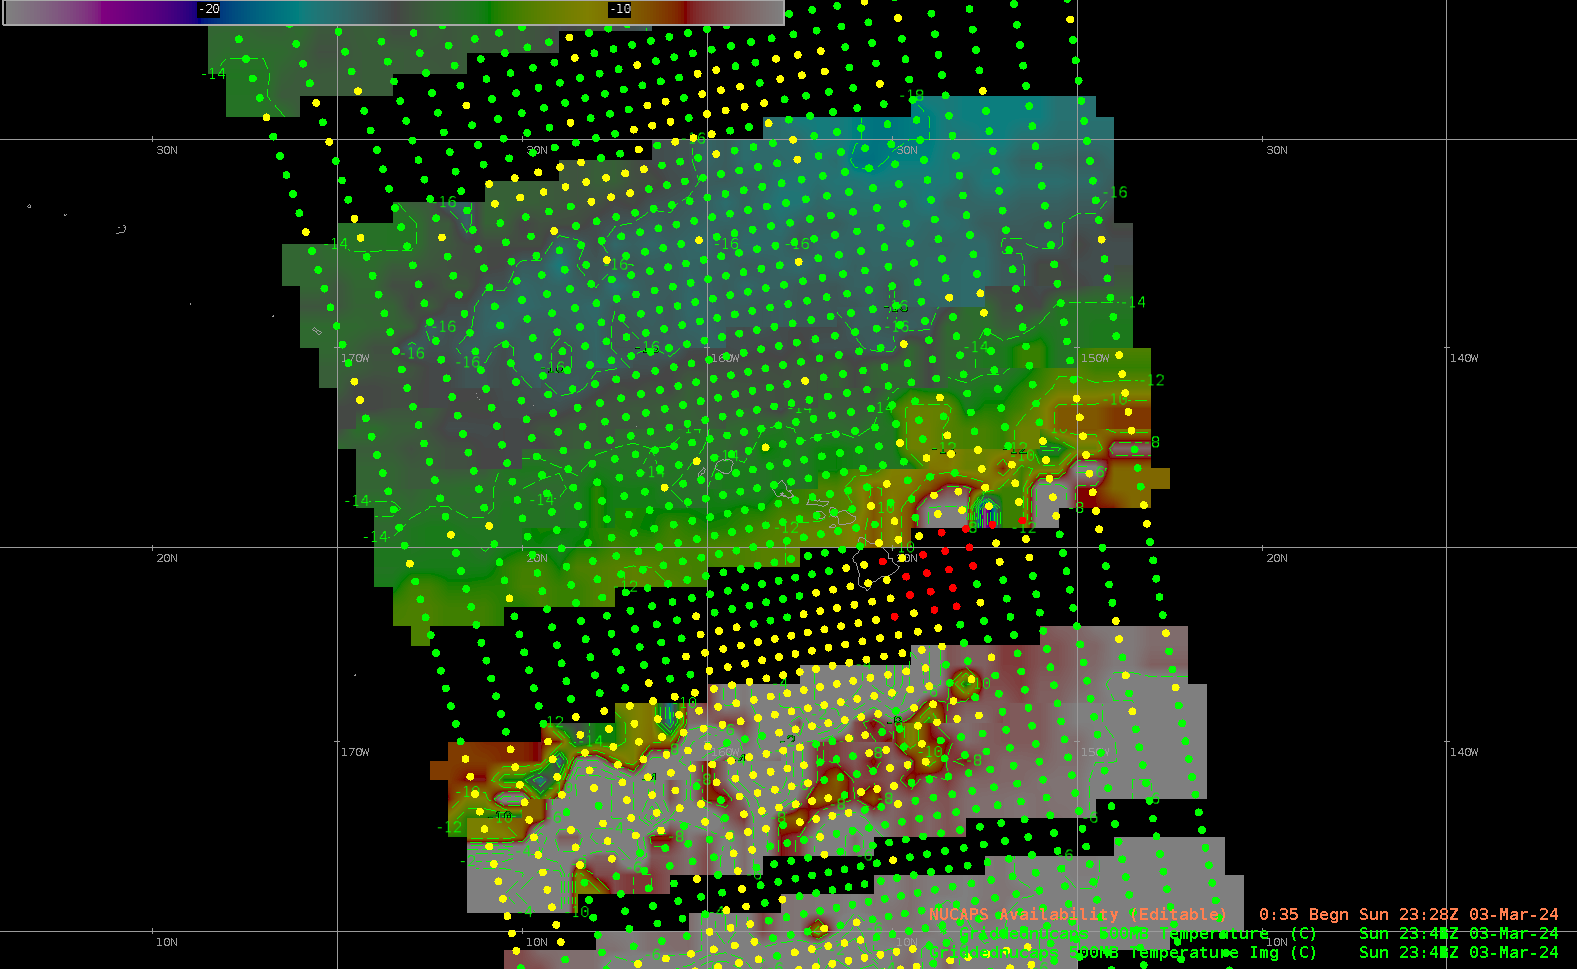
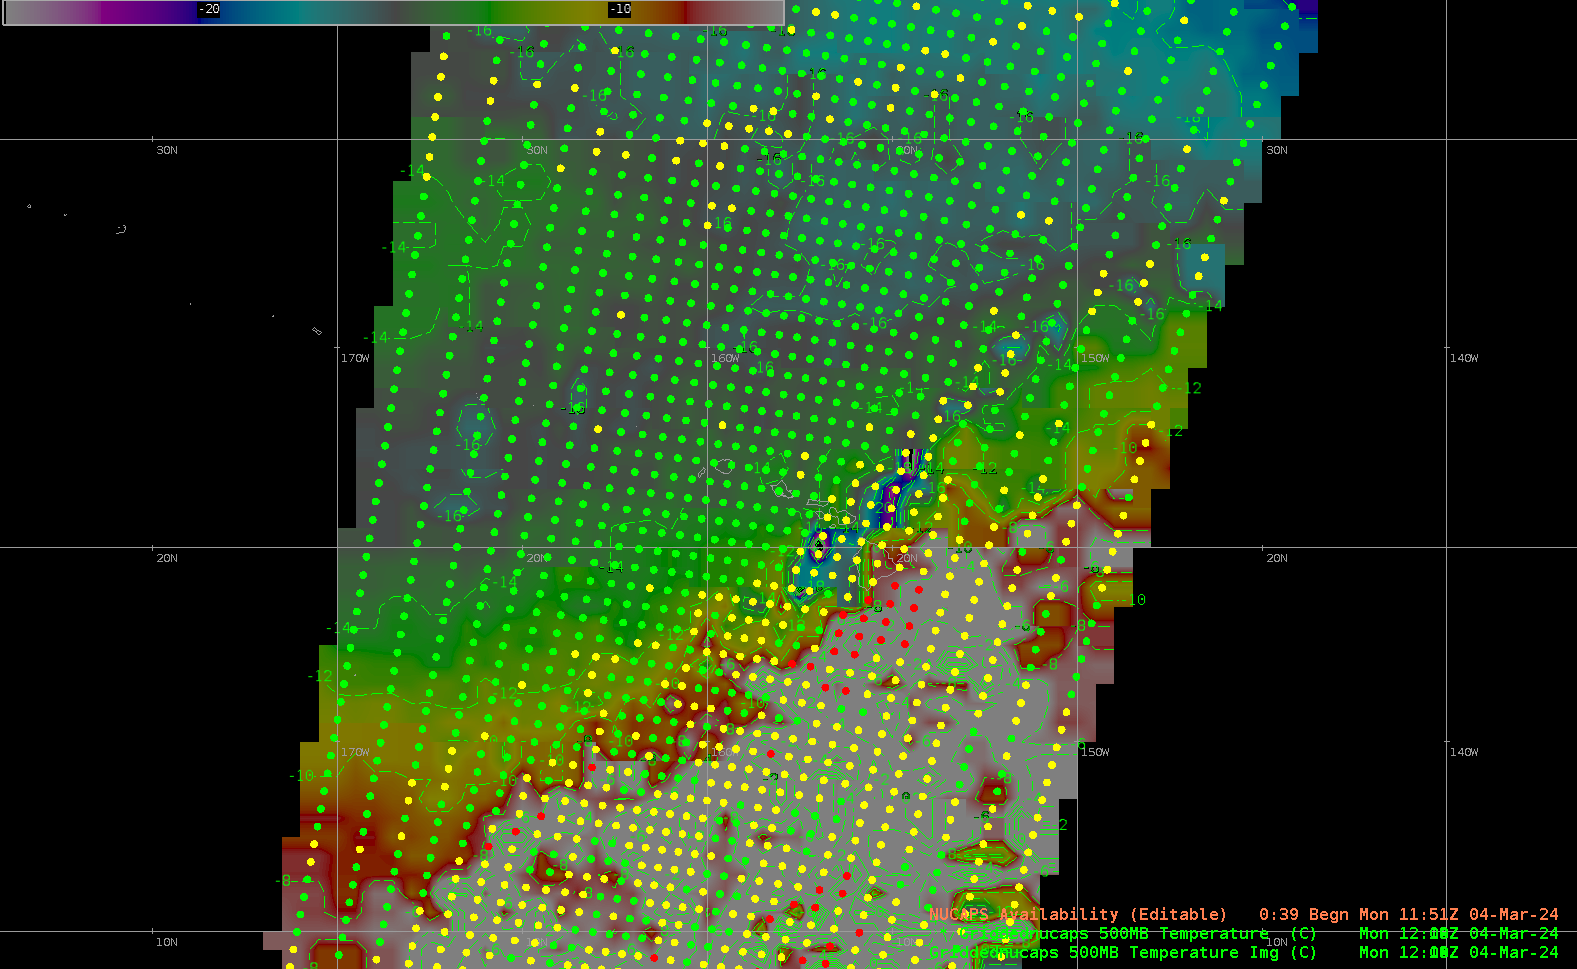
NOAA-20 NUCAPS profiles give twice-daily estimates of thermodynamic variables over the Hawai’ian islands. These profiles are an important data source over ocean regions where conventional data are otherwise rare. The analyses near 0000 and 1200 UTC on 4 March 2024, below, show the large extent of cold temperatures at 500 mb, with temperatures between -14 and -16oC just north of Kauai. Temperatures are warmer over the big Island of Hawai’i. Use NUCAPS profiles to monitor cold temperatures at 500 mb when unusual cold is ongoing.
The gridded NUCAPS fields above are from AWIPS. You can also access them at this RealEarth site, and at this site maintained by SPoRT. The animation below of imagery from the SPoRT site shows values from 1200 UTC 2 March through 1200 UTC 4 March. Colder air overspread the western Hawaiian islands on the 4th.
View only this post Read Less
