This website works best with a newer web browser such as Chrome, Firefox, Safari or Microsoft
Edge. Internet Explorer is not supported by this website.
30-second (ending at 1200 UTC) and 1-minute Mesoscale Domain Sector GOES-16 “Clean” Infrared Window (10.3 µm) images (above) included plots of time-matched (within +/- 3 minutes) plots of SPC Storm Reports (09 April | 10 April) across parts of Texas, Louisiana, Mississippi and Alabama on 10 April 2024. The corresponding 1-minute GOES-16 “Red” Visible (0.64 µm) images after... Read More
30-second (ending at 1200 UTC) and 1-minute GOES-16 “Clean” Infrared Window (10.3 µm) images from 1020-1725 UTC on 10 April, with time-matched (within +/- 3 minutes) SPC Storm Reports plotted in cyan [click to play animated GIF | MP4]
30-second (ending at 1200 UTC) and 1-minute Mesoscale Domain Sector GOES-16 “Clean” Infrared Window (10.3 µm) images (above) included plots of time-matched (within +/- 3 minutes) plots of SPC Storm Reports (09 April | 10 April) across parts of Texas, Louisiana, Mississippi and Alabama on 10 April 2024. The corresponding 1-minute GOES-16 “Red” Visible (0.64 µm) images after sunrise are shown below.
1-minute GOES-16 “Red” Visible (0.64 µm) images from 1201-1725 UTC on 10 April, with time-matched (within +/- 3 minutes) SPC Storm Reports plotted in red [click to play animated GIF | MP4]
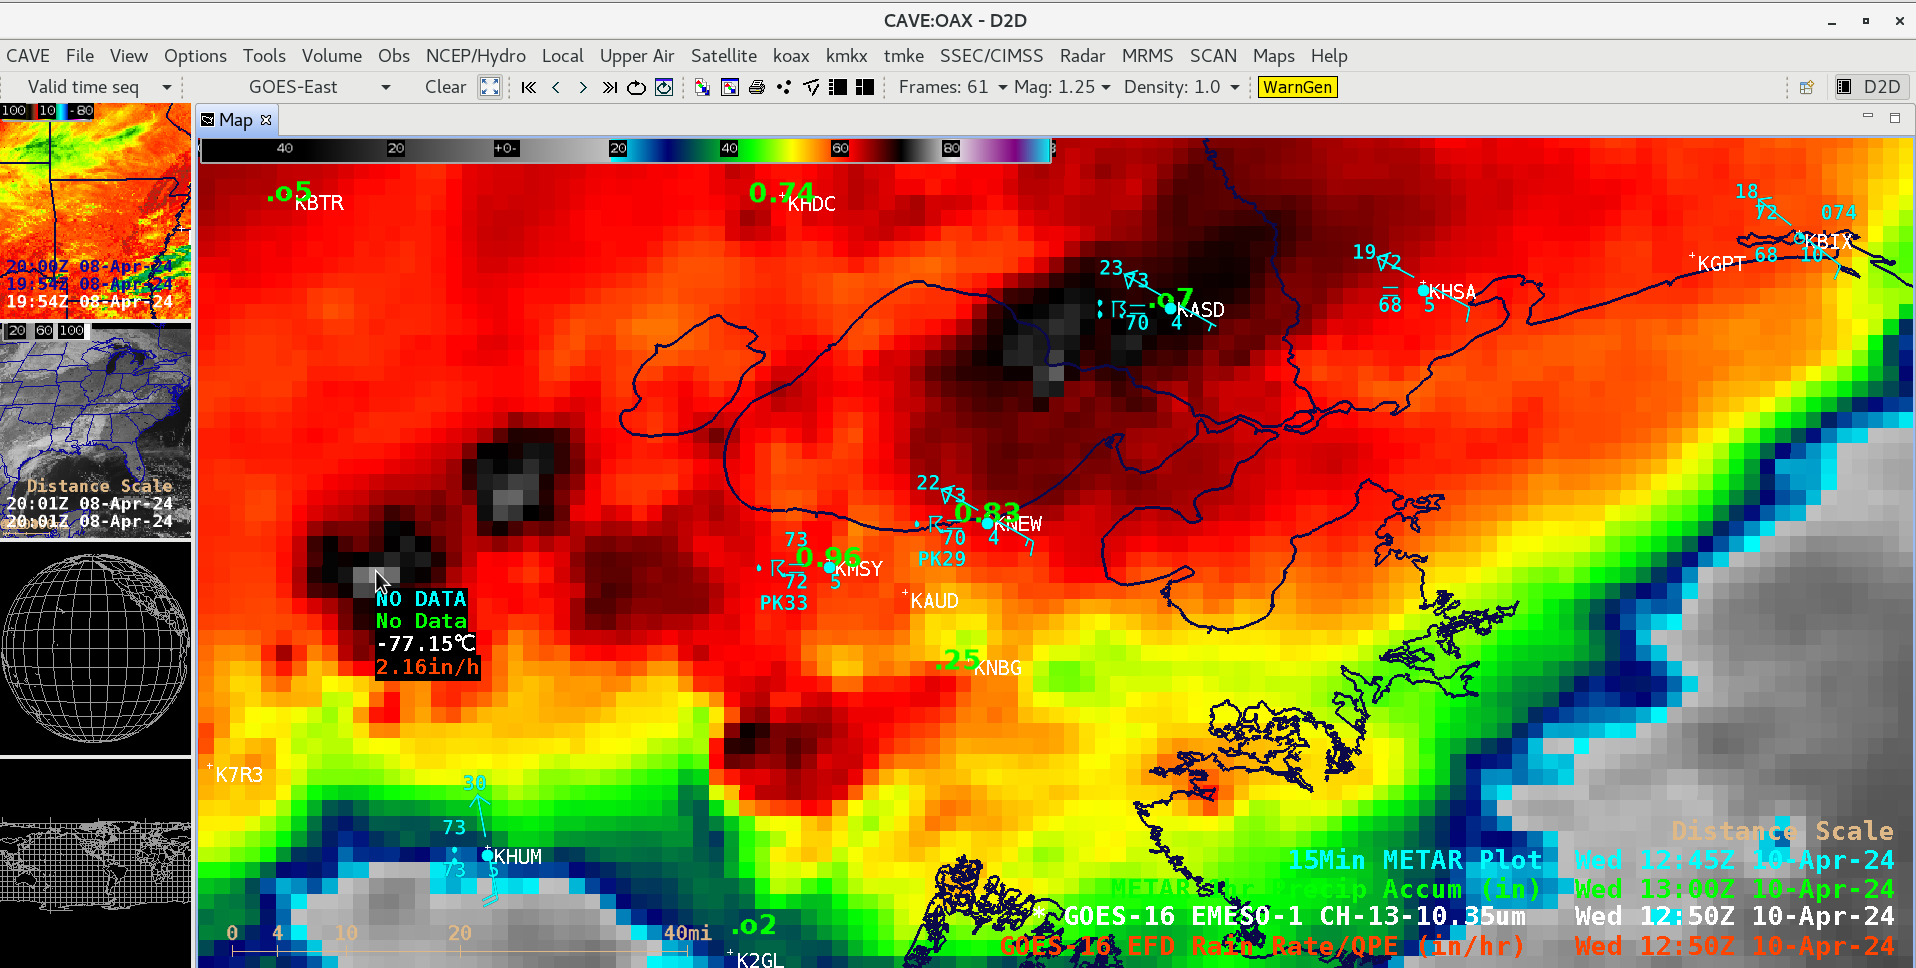
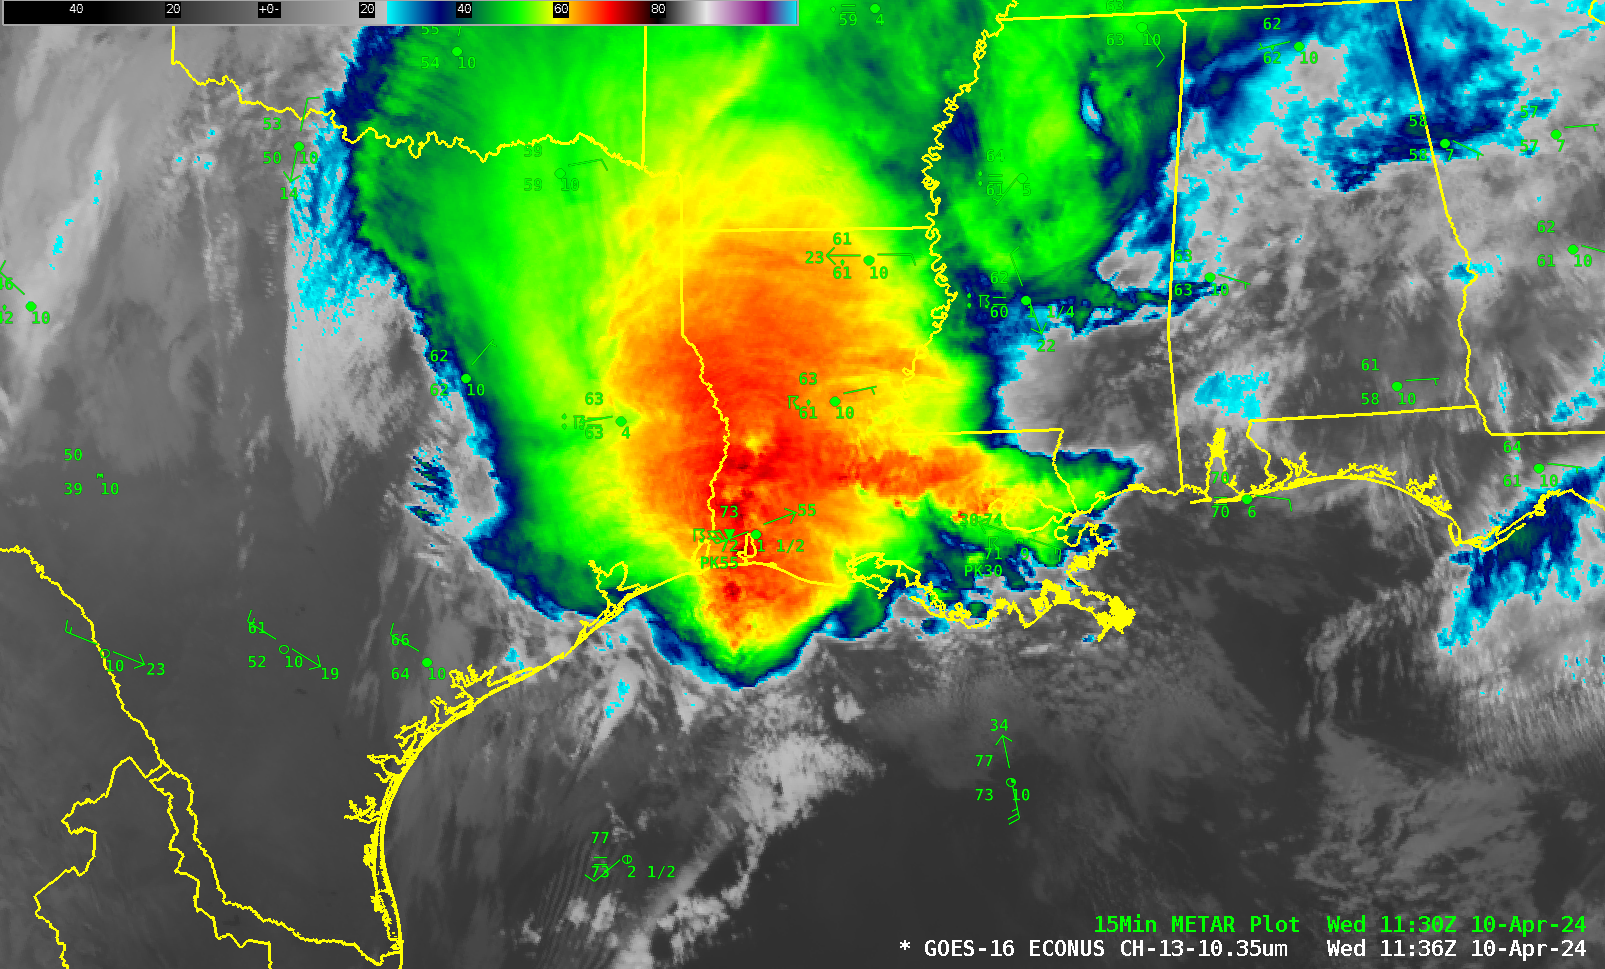
One notable event that occurred during this period was heavy rainfall which produced flooding in the New Orleans, Louisiana area — 1-minute GOES-16 Infrared images (below) showed the clusters of thunderstorms responsible for precipitation accumulations that exceeded 1.0-2.0 inches per hour at times.
1-minute GOES-16 (10.3 µm) Infrared images from 1200-1900 UTC on 10 April, with plots of 15-minute METAR surface reports (cyan) and 1-hour precipitation accumulation (green) [click to play animated GIF | MP4]
A cursor sample of the GOES-16 cloud-top 10.3 µm infrared brightness temperature at 1250 UTC (below) displayed a corresponding GOES-16 Rain Rate of 2.16 in/hr (below).
Cursor sample of the 1250 UTC GOES-16 cloud-top 10.3 µm infrared brightness temperature (white) along with the corresponding GOES-16 Rain Rate derived product (red) [click to enlarge]
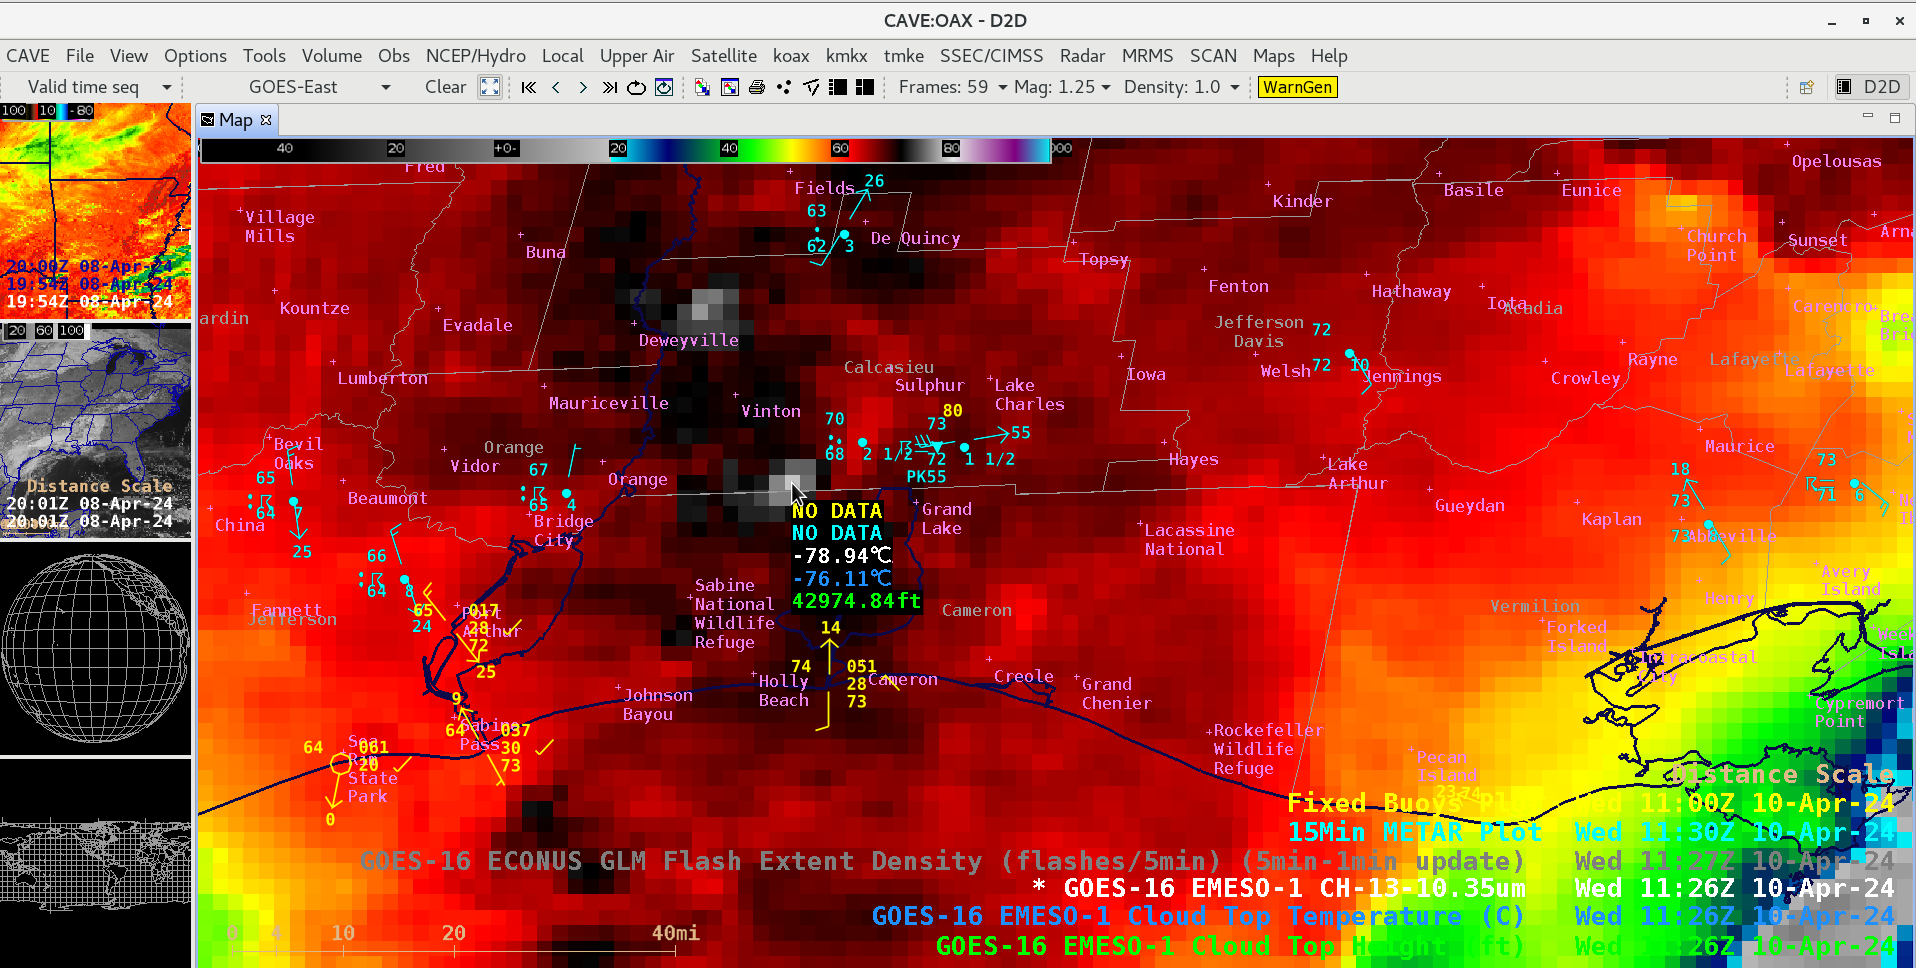
Just prior to sunrise in southwest Louisiana, another notable event was a convective line that produced EF1/EF2-rated tornadoes in the Lake Charles area — overlapping 1-minute Mesoscale Domain Sectors provided GOES-16 Infrared images at 30-second intervals (below), which showed the pulses of cold overshooting tops associated with these thunderstorms. This event is also discussed from a hyperspectral model perspective in this blog post.
30-second GOES-16 Infrared (10.3 µm) images from 1100-1200 UTC on 10 April, with plots of 15-minute METAR surface reports (cyan) and hourly fixed buoy reports (yellow) [click to play animated GIF | MP4]
A cursor sample of 1126 UTC GOES-16 cloud-top 10.3 µm infrared brightness temperature (below) displayed a corresponding GOES-16 Cloud Top Temperature of -76.11ºC and a Cloud Top Height of 42974.84 ft.
Cursor sample of 1126 UTC GOES-16 cloud-top 10.3 µm infrared brightness temperature (white) along with the corresponding GOES-16 Cloud Top Temperature (blue) and Cloud Top Height (green) derived products [click to enlarge]
30-second GOES-16 Infrared images with an overlay of GLM Flash Extent Density(below) revealed a notable amount of lighting actvity associated with this tornado-producing line of thundertorms.
30-second GOES-16 Infrared (10.3 µm) images with an overlay of GLM Flash Extent Density from 1100-1200 UTC on 10 April, including plots of 15-minute METAR surface reports (cyan) and hourly fixed buoy reports (yellow) [click to play animated GIF | MP4]
GOES-16 Clean Window infrared imagery (Band 13, 10.3 µm), above, shows a convective line moving into Louisiana around sunrise on 10 April 2024. SPC Storm Reports (below, and here), show tornadoes over extreme southwest Louisiana at around 1130 UTC on 10 April 2024 (Note the peak wind of 55 knots at the Lake Charles LA airport at 1136 UTC, within... Read More
GOES-East Clean Window Infrared (Band 13, 10.3 µm) imagery, 1036-1331 UTC on 10 April 2024 (Click to enlarge)
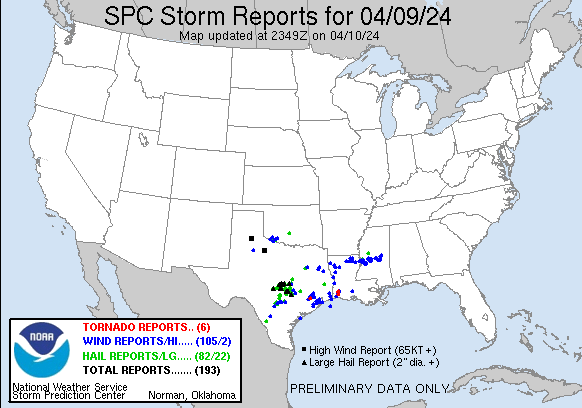
GOES-16 Clean Window infrared imagery (Band 13, 10.3 µm), above, shows a convective line moving into Louisiana around sunrise on 10 April 2024. SPC Storm Reports (below, and here), show tornadoes over extreme southwest Louisiana at around 1130 UTC on 10 April 2024 (Note the peak wind of 55 knots at the Lake Charles LA airport at 1136 UTC, within minutes of the times of the reported tornadoes nearby).
SPC Storm Reports from 1200 UTC 9 April through 1200 UTC 10 April 2024 (Click to enlarge)
Composite Reflectivity radar fields (clumsily saved as screen captures from this site), show the line of convection responsible for the tornadoes.
Composite Reflectivity Radar over the south-central United States, 1054 – 1254 UTC on 10 April 2024
CIMSS and Hampton University Scientists run a 4-km resolution WRF simulation that includes as its input information from Polar Hyperspectral Soundings. The great spectral resolution of the Sounders (both infrared and microwave) on Polar Orbiting Satellites (that is, CrIS and ATMS on NOAA-20/NOAA-21 and IASI and MHS/AMSU on Metop-B/Metop-C) is blended with the great spatial and temporal resolution of the ABI (via a fusion process described here and here) to provide assimilation data to the WRF model. How did this model perform (compared to other high-resolution mesoscale models) during this small outbreak of tornadoes?
The surface fields below from the 4-km WRF model with PHS information and the 3-km HRRR model are shown below. The WRF simulation better represents the character and timing of the convection moving into southwestern Louisiana. It’s tempting to attribute this to a better representation of moisture that comes from the inclusion information from the Polar Hyperspectral Soundings.
Surface simulation including composite reflectivity from models intialized at 0800 UTC on 10 April 2024 (Click to enlarge); hourly forecasts from 1 to 6 hours are shown,
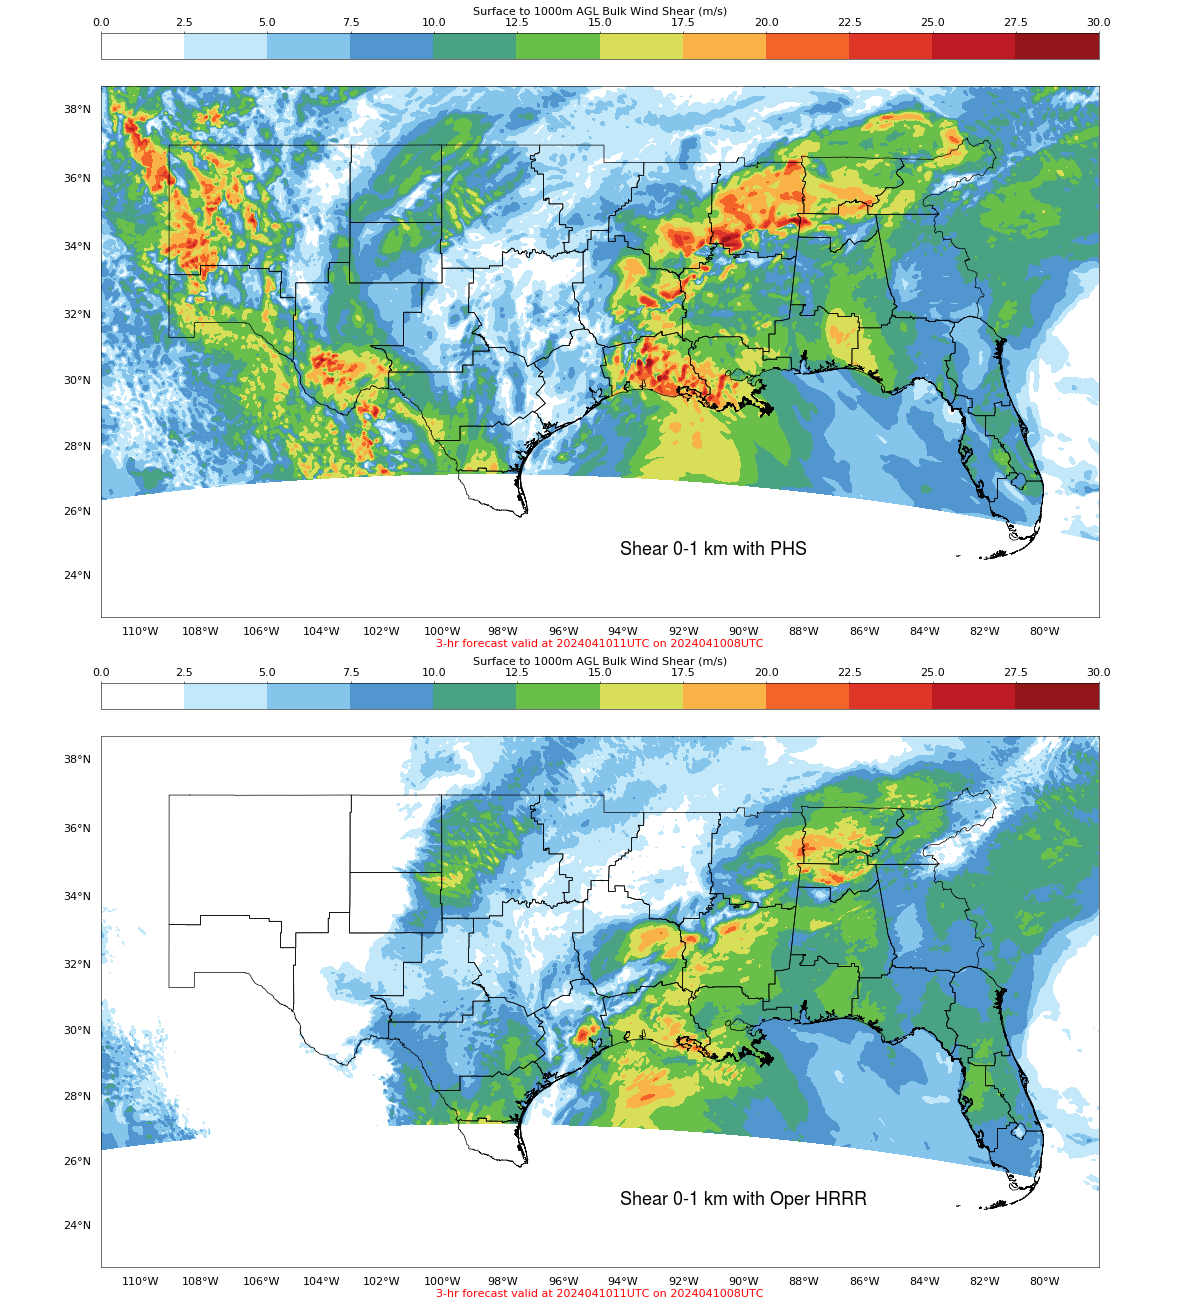
The model output shown below is the 0-1000m bulk shear. Shear values are larger and show small peak concentrations at the time and in the region of the observed tornadoes in the WRF model influenced by PHS data (top) compared to the HRRR model (bottom). The Shear at 1100 UTC is shown here.
Surface-1km AGL Bulk Shear from the 4-km WRF with PHS information (top) and the 3-km HRRR (bottom) from models initialized at 0800 UTC on 10 April 2024 (Click to enlarge)
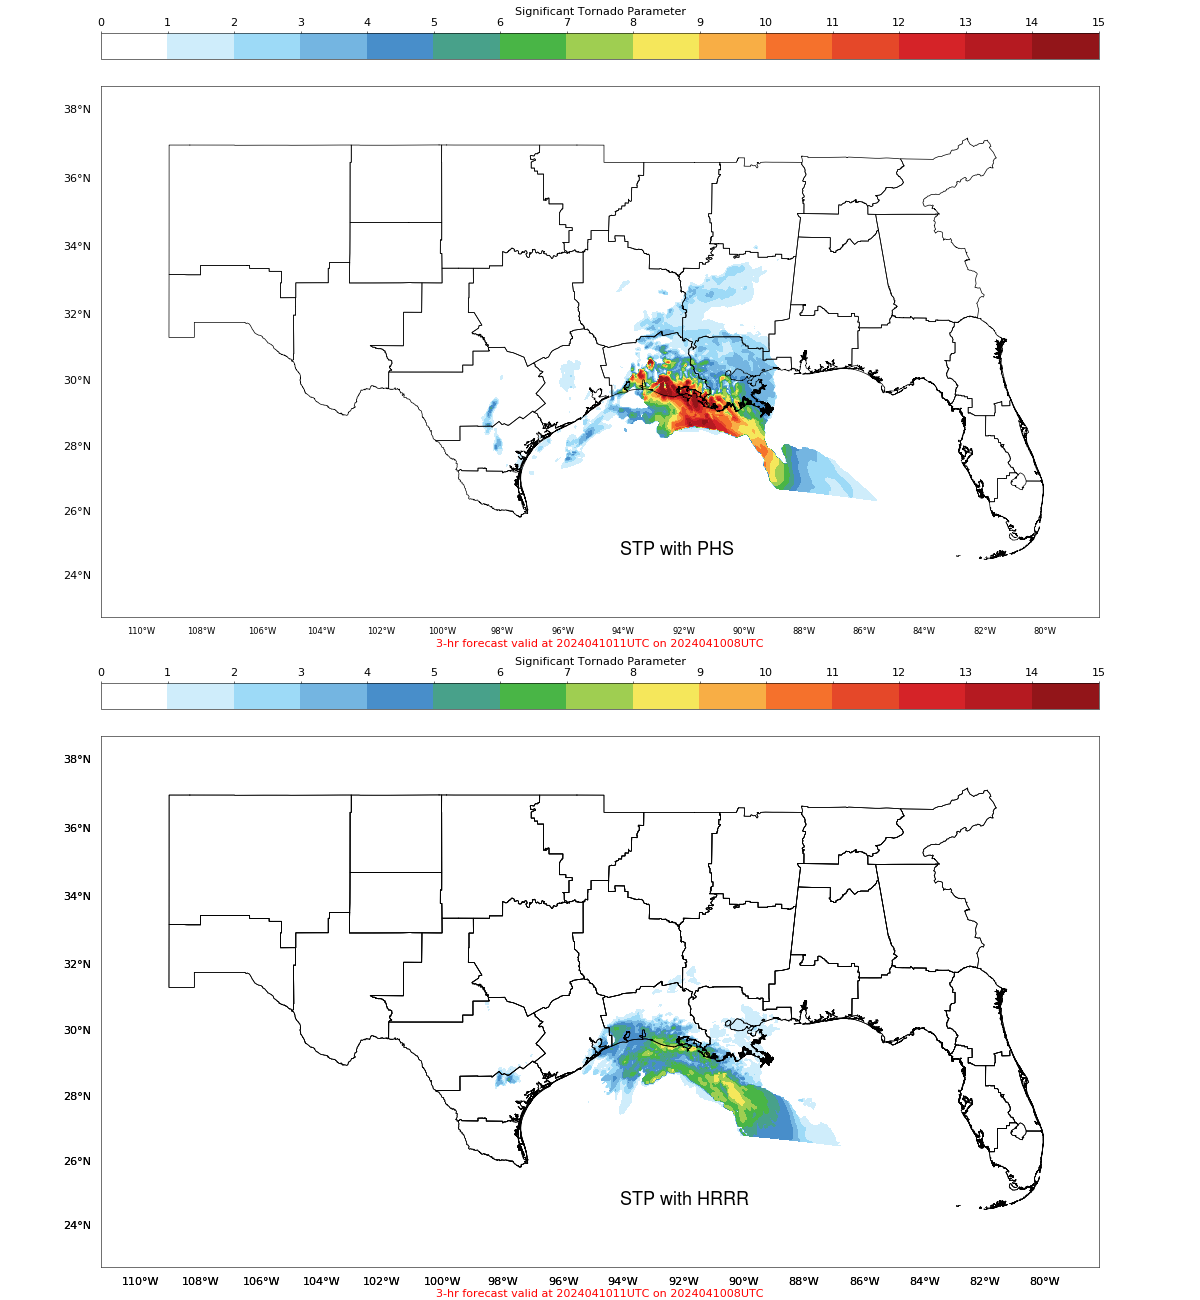
Significant Tornado Parameter (STP), below, also has smaller-scale features in the WRF model run influenced by PHS data compared to the HRRR model run. The model output at 1100 UTC is shown here (tornadoes occurred close to 1130 UTC; one was rated an EF-2).
Significant Tornado Parameter from the 4-km WRF with PHS information (top) and the 3-km HRRR (bottom) from models initialized at 0800 UTC on 10 April 2024 (Click to enlarge)
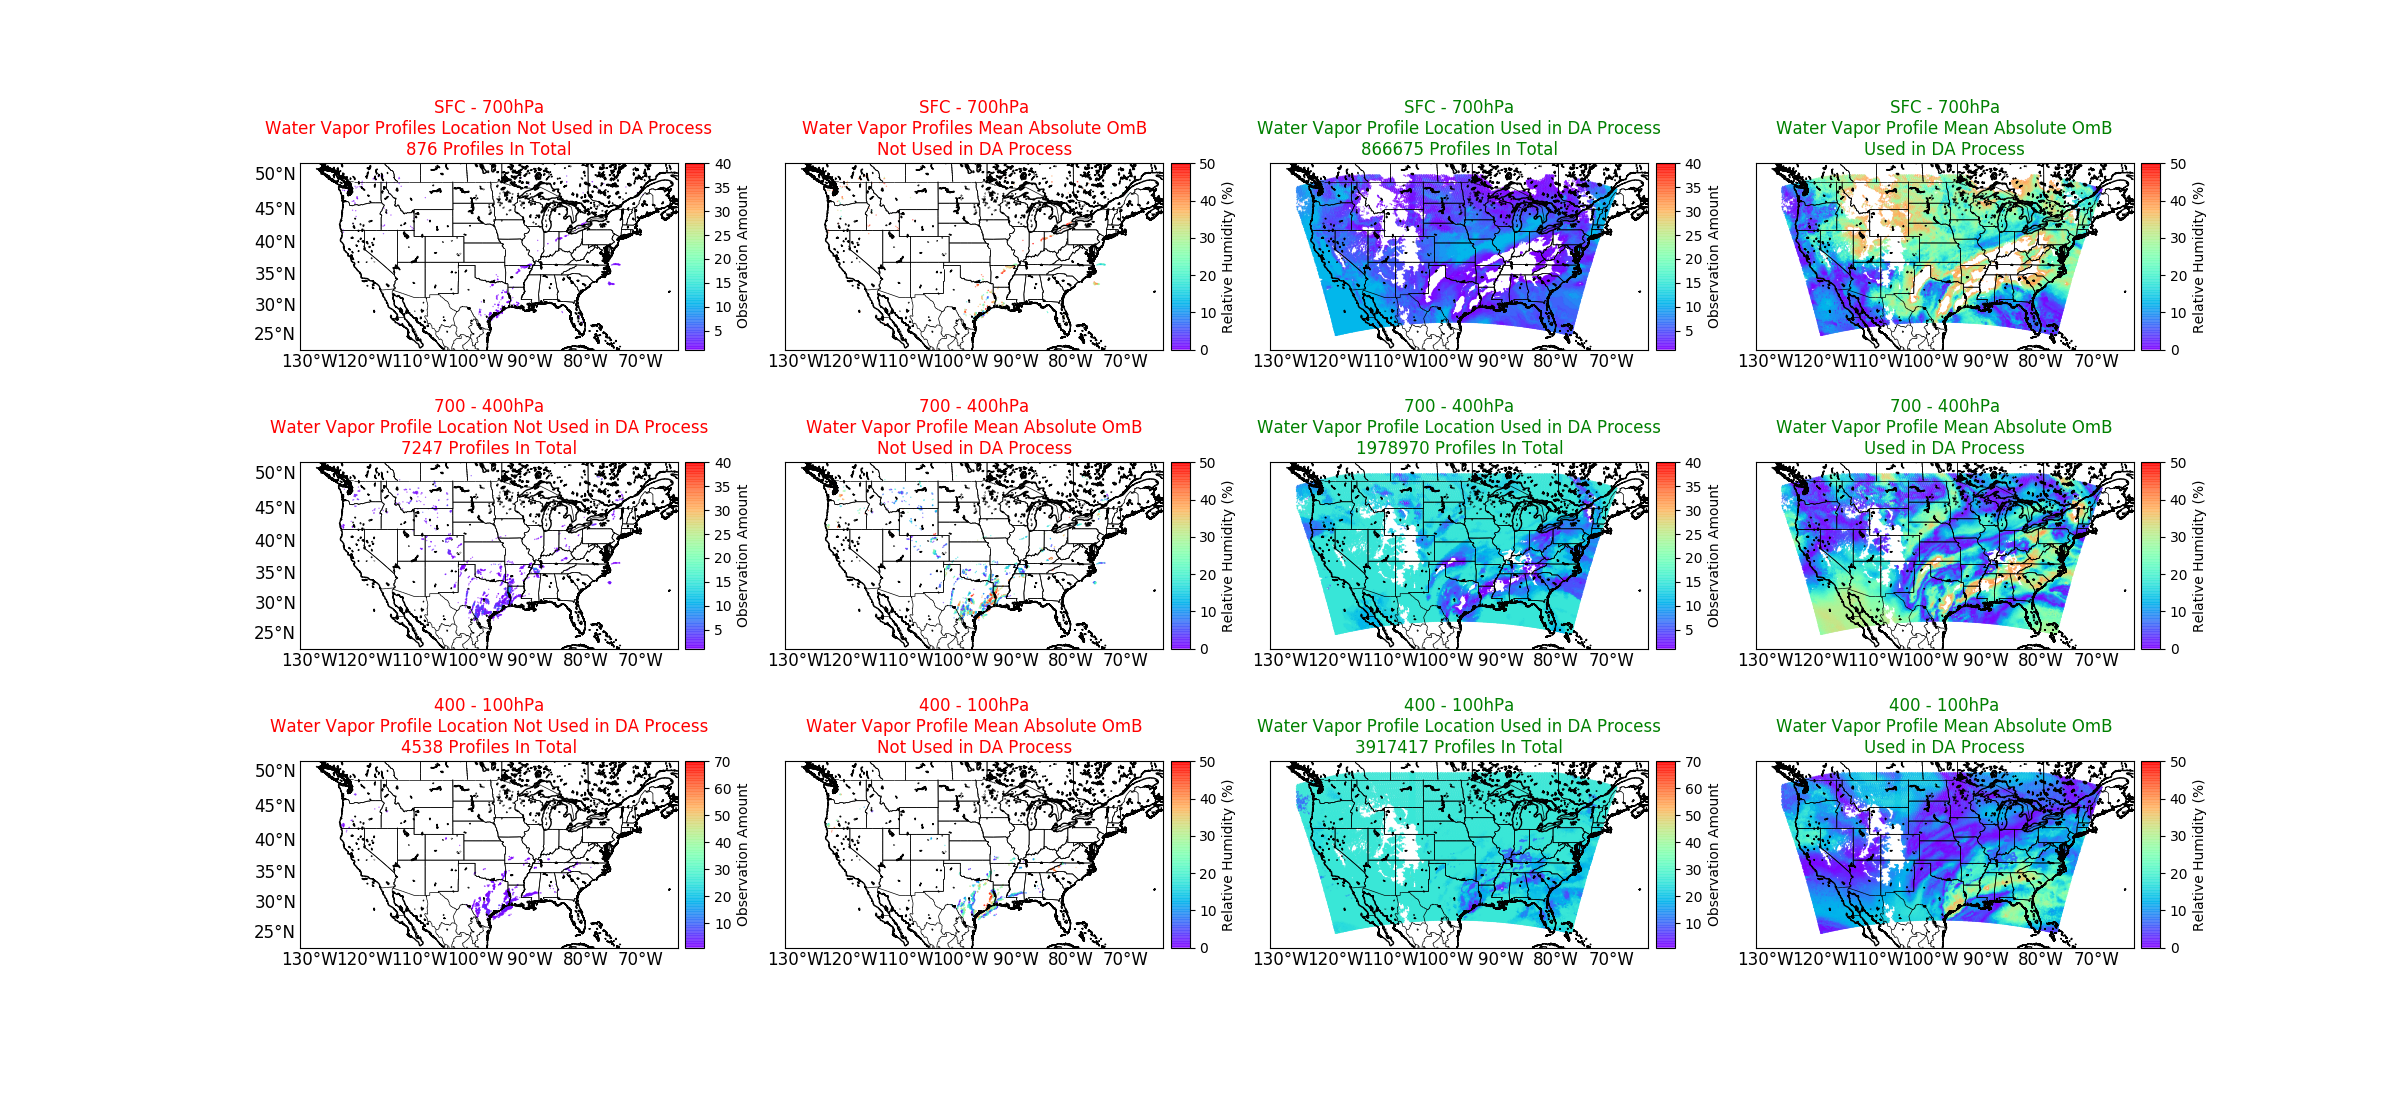
PHS model output (available here online) will be demonstrated this year at the Hazardous Weather Testbed at SPC in Norman OK. One of the metrics available at the PHS Model website shows how many profiles are (or are not) assimilated into the model. Here‘s the field for 0800 UTC on 10 April: Many profiles are assimilated!!
Total Precipitable Water over the south Pacific Ocean, 2000 UTC 8 April 2024 – 1900 UTC 9 April 2024 (Click to enlarge)
Infrared imagery, below (source), from 0250 UTC to 1840 UTC (that is, 350 PM to 750 AM American Samoa Time), shows extensive overnight convection that moves from south of American Samoa northward. By the end of the animation, the focus of convection is north of the Samoan Islands with a strengthening line of westward-moving convection is also moving along 5oS latitude. Convection over the Samoan Islands weakens as the westward-propagating line strengthens.
GOES-18 Clean Window infrared imagery (10.3 µm, Band 13), 0250-1840 UTC on 9 April 2024 (Click to enlarge)
Water Vapor imagery for the same interval, below, also shows a diminishing trend for convection over the Samoan Islands.
GOES-18 Clean Window infrared imagery (6.9 µm, Band 9, Mid-level water vapor), 0250-1840 UTC on 9 April 2024 (Click to enlarge)
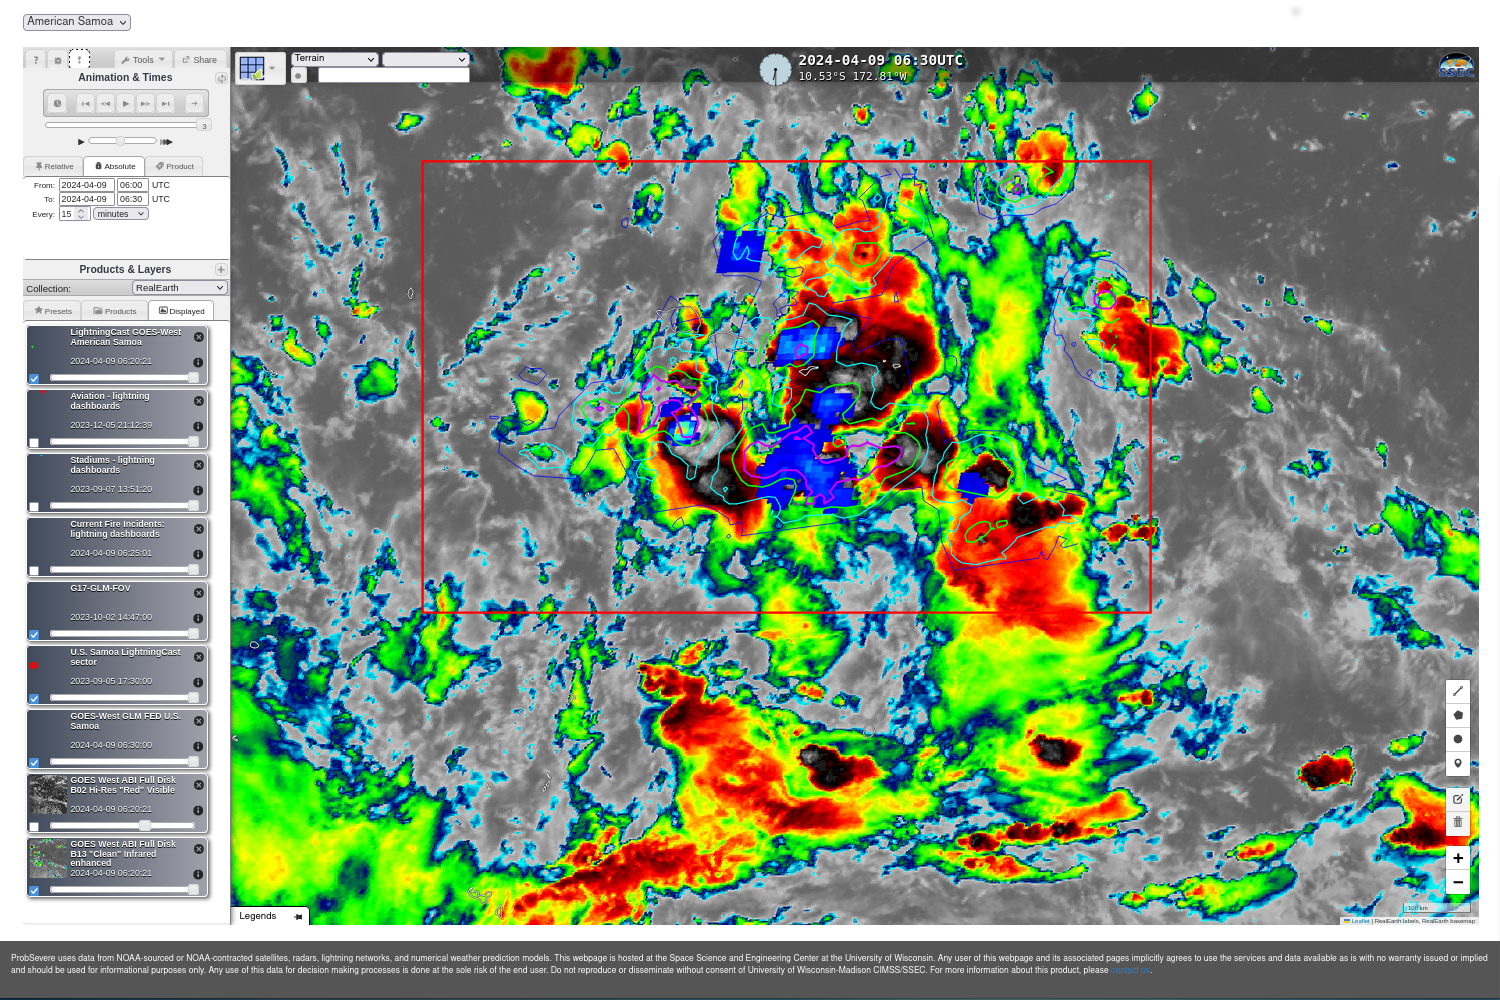
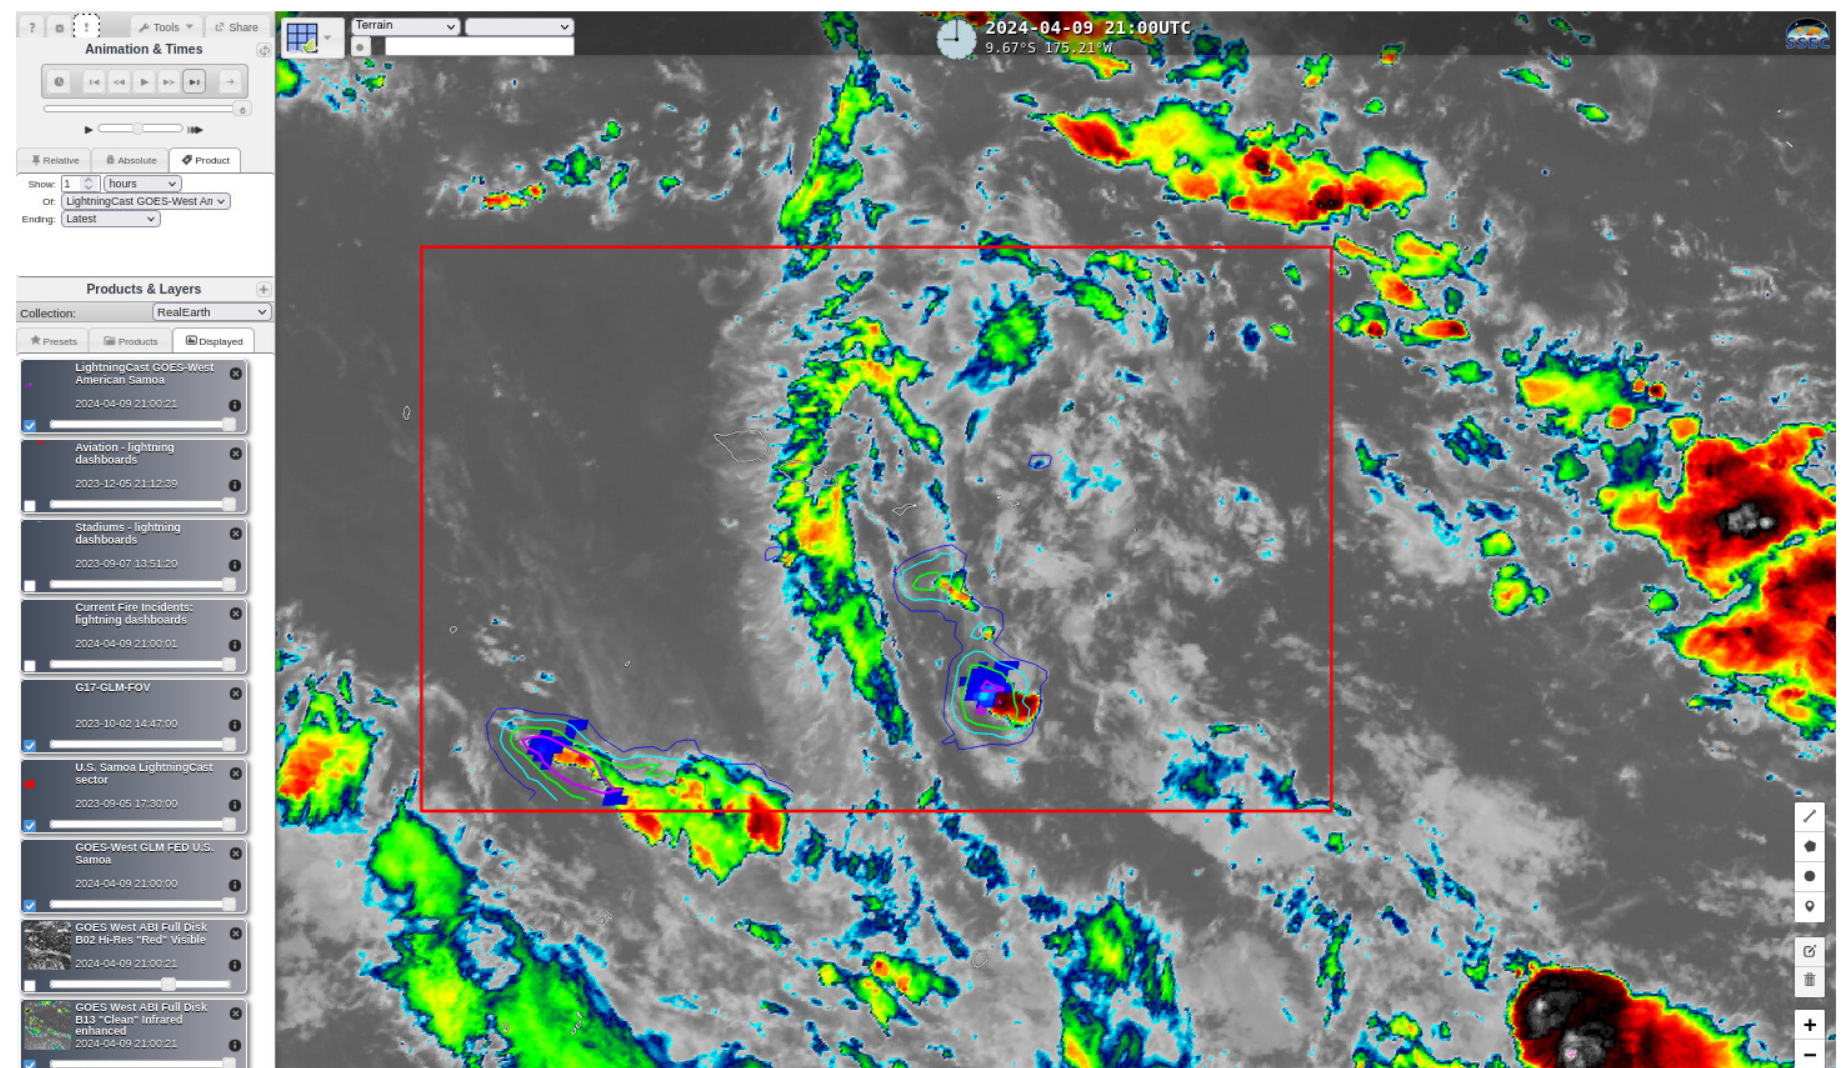
LightningCast probabilities over Amercan Samoa, below (from this site) show a big difference between 0630 and 1930 UTC on 9 April 2024. Lightning probabilities were high and lightning was active at 0630 UTC. By 1930 UTC, activity was much reduced, with elevated LightningCast probabilities confined to regions south of American Samoa. This might be a region to watch for development.
LightningCast probabilities with GOES-18 Band 13 imagery and GLM Observations of Flash Extent Density, 0630 and 1930 UTC on 9 April 2024 (Click to enlarge)
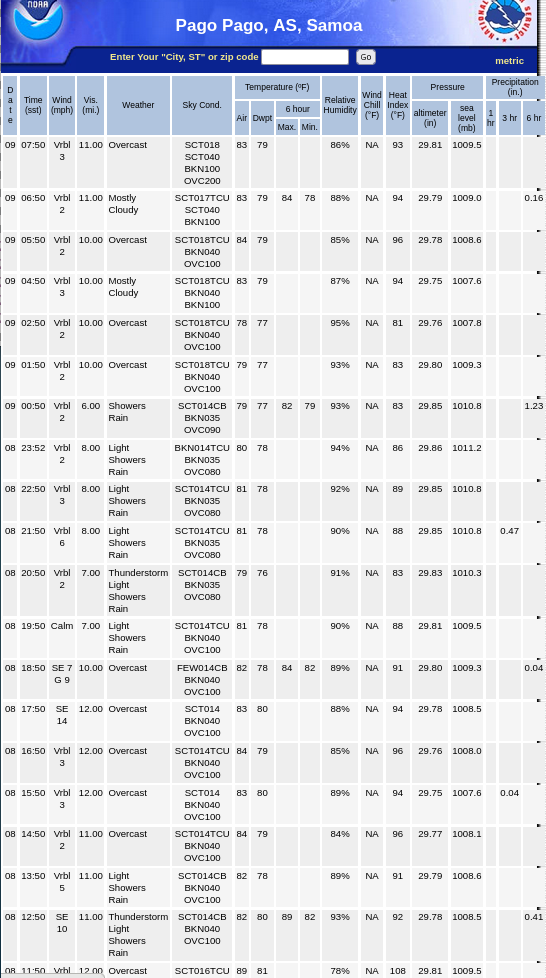
GFS estimates of the Galvez-Davison Index (GDI), below (source) from the 1200 UTC GFS run show large values (>45) of GDI persisting over and south of the Samoan Islands until about 0000 UTC on 11 April. The potential for heavy rain continues over American Samoa for another day despite the respite shown in the ABI data above. (Note from this blog author: I find forecasting for American Samoa very very difficult!) (Here is blog post comparing GDI to DSI estimates of K-Index). The 2100 UTC LightningCast probabilities (here), do show an increase in probabilities of a GLM observation (and actual GLM observations) just to the south of Tutuila, so perhaps convection is starting to become more widespread.
GDI Estimates from the 1200 UTC 9 April 2024 GFS, 00h to 36h (by 6) (Click to enlarge)
Contributors: Scott Bachmeier, Mat Gunshor, Rick Kohrs, Margaret Mooney, Jim Nelson, Tim Schmit, and Eric Verbeten.Another CIMSS Satellite Blog on the Eclipse, when time compositing imagery from 2024 (and 2017). A similar loop as above, but with a special enhancement (contrast stretch) is in this CIMSS Satellite Blog post (which also includes a comparison of the 2017 and 2024 eclipse... Read More
Contributors: Scott Bachmeier, Mat Gunshor, Rick Kohrs, Margaret Mooney, Jim Nelson, Tim Schmit, and Eric Verbeten.
True-Color imagery over the GOES-East CONUS sector (Courtesy Jim Nelson, SSEC/CIMSS)Mesoscale Images were set to track the shadow. Here they’re shown every minute with CIMSS Natural Color overlaid on the CONUS, which are scanned every 5 minutes from GOES-16 on April 8, 2024.Mesoscale Images were set to track the shadow. Here they’re shown every minute with ABI Band 03 (0.86um) overlaid on the CONUS, which are scanned every 5 minutes from GOES-16 on April 8, 2024.
A similar loop as above, but with a special enhancement (contrast stretch) is in this CIMSS Satellite Blog post (which also includes a comparison of the 2017 and 2024 eclipse events).
GOES-16 Band 03 (0.86um) CONUS images showing the eclipse shadow.GOES-West Band 2 imagery, 1510 – 1700 UTC on 8 April 2024
GOES-East Band 2 imagery, 1510 – 1700 UTC on 8 April 2024
Here are CIMSS Natural Color animations from GOES-West and GOES-East Full Disk showing the eclipse shadow.
GOES-18 CIMSS Natural Color Showing the April 8, 2024 Eclipse ShadowGOES-16 CIMSS Natural Color Showing the April 08, 2024 Eclipse Shadow
To examine the effects of the eclipse shadow on surface weather, let’s turn to GOES-16 Near-Infrared “Vegetation” images (below), centered over North Texas. Many sites recorded drops in surface air temperature of 4-5 degrees F as the shadow traversed the area — for example, see these plots of surface report data across North Texas at Brownwood, Fort Worth, DFW Airport and Paris.
GOES-16 Near-Infrared “Vegetation” images with plots of surface reports, from 1701-2001 UTC (courtesy Scott Bachmeier CIMSS) [click to play animated GIF | MP4]
The corresponding hourly GOES-16 Land Surface Temperature (LST) derived product (below) displayed cooling LSTs as the shadow’s arrival halted the trend of midday heating.
GOES-16 Land Surface Temperature derived product, from 1701-1901 UTC (courtesy Scott Bachmeier, CIMSS) [click to enlarge]
The eclipse shadow and its effect on surface cooling was also evident in imagery from polar-orbiting satellites. 3 consecutive overpasses of NOAA-20 and Suomi-NPP provided VIIRS False Color RGB and Shortwave Infrared images centered over northwest Arkansas (below) — which showed a notable cooling of surface infrared brightness temperatures across the Mississippi Alluvial Plain as the shadow moved across the region. In addition, a number of METAR sites reported surface air temperature drops of 5-6 degrees F as incoming solar radiation decreased.
Sequence of 3 VIIRS False Color RGB and Shortwave Infrared images from NOAA-20 and Suomi-NPP, with plots of surface reports (courtesy Scott Bachmeier, CIMSS) [click to play animated GIF | MP4]
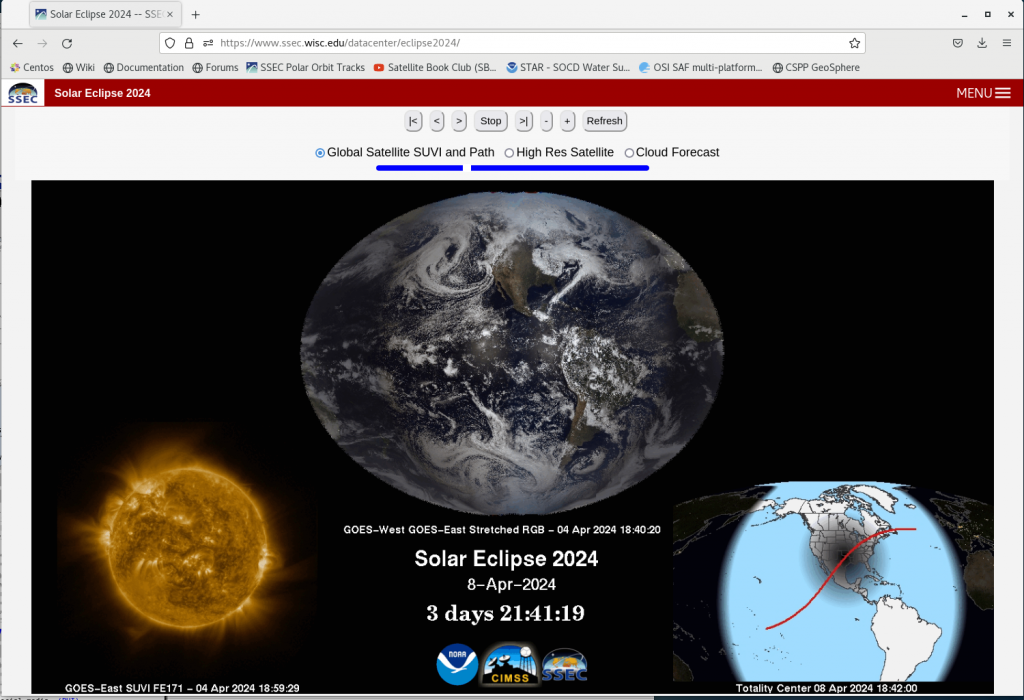
Early on 8 April (CSPP Geosphere link also shown below), there are some obvious winners and losers as far as Eclipse-viewing goes, as shown with GOES imagery. If you’re in western New York State, for example, things look unfortunate. Texas? Hit or miss: plenty of clouds, but not completely overcast. Maine? That looks pretty good to this blogger! We’ll see how things evolve during the day however. Here in Madison WI, skies look like a view of a 90%-eclipsed sun is likely. Check out the CSPP Geosphere site for the latest imagery.
True-Color Imagery, 1236 – 1331 UTC on 8 April 2024SSEC Datacenter Eclipse 2024 Website (Click image to go to website)
Just seven years after a total eclipse swept northwest to southeast across the Contiguous United States (as discussed in blog posts here and here), a total solar eclipse will move southwest to northeast from Mexico to the eastern Great Lakes to New England on 8 April 2024. During and after the event, we will post an animation (above) with combined views from GOES-18 and GOES-16 showing the satellite view of the Moon’s shadow. There will also possibly be mesoscale sectors covering the path of the eclipse (link).
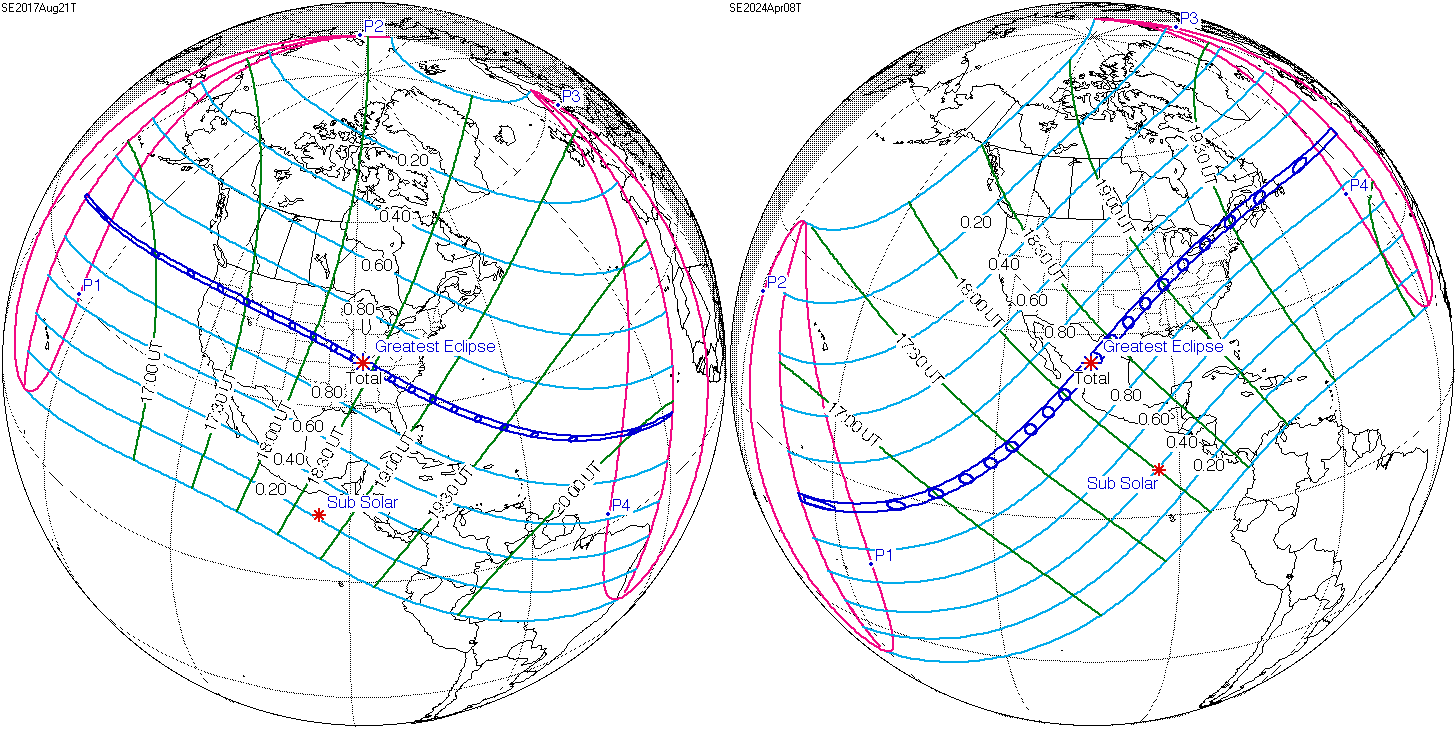
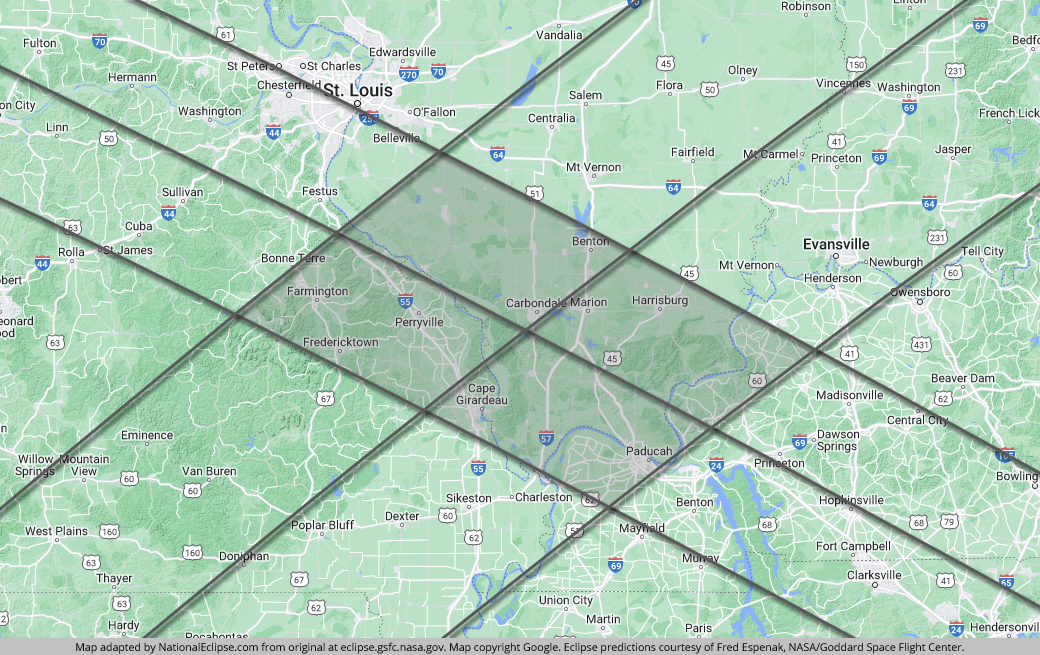
The paths of the 2017eclipse and the 2024 eclipse are shown below. (Shout out to those Americans who had the foresight to live in the intersecting paths of totality near Carbondale IL as shown in the figure below the two globes, from this handy website). See composite eclipse shadow images from the 2017 and 2024 events at this blog post.
Eclipse Paths from August 2017 (Left) and April 2024 (right) (Click to enlarge)The shaded region above shows the region of totality for both the 2017 Eclipse (lines moving northwest to southeast) and the 2024 Eclipse (lines moving southwest to northeast) (Click to enlarge)GOES-16 Band 3 Imagery (0.86 micrometers), 1722-1922 UTC 21 August 2017 (Left) and 1801-2001 UTC 8 April 2024 (Click to enlarge) 2017 Data are preliminary and non-operational
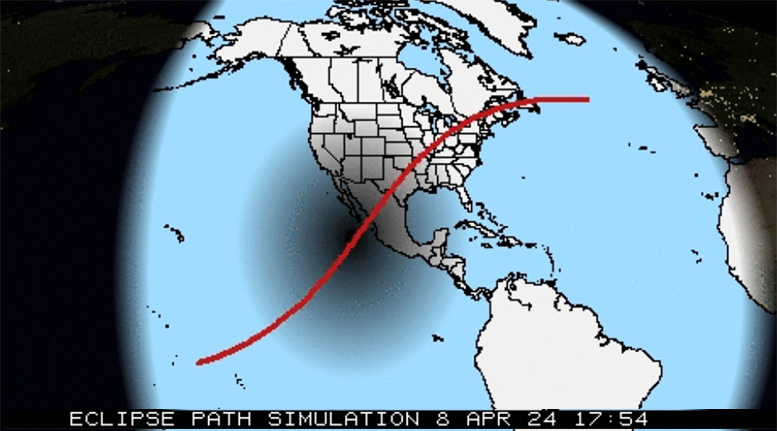
The animation below (from Rick Kohrs, SSEC/CIMSS), shows the region of the shadow as it moves across North American and adjacent waters, from sunrise over the Equatorial Pacific to sunset over the north Atlantic. (The same animation with a stationary map is here).
Eclipse-centered image showing the path of the total eclipse on 8 April 2024, courtesy Rick Kohrs (Click to enlarge)


