This website works best with a newer web browser such as Chrome, Firefox, Safari or Microsoft
Edge. Internet Explorer is not supported by this website.
Overlapping 1-minute Mesoscale Domain Sectors provided 30-second interval GOES-16 (GOES-East) “Red” Visible (0.64 µm) and “Clean” Infrared Window (10.3 µm) images (above) — which showed thunderstorms that produced two EF1-rated tornadoes as well as damaging winds (resulting in some fatalities) across the Houston area (SPC Storm Reports) on 16 May 2024. Widespread structural damage occurred in downtown Houston — and there were also... Read More
30-second GOES-16 “Red” Visible (0.64 µm, top) and “Clean” Infrared Window (10.3 µm, bottom) images with time-matched (+/- 3 minutes) SPC Storm Reports plotted in cyan, from 2230 UTC on 16 May to 0018 UTC on 17 May [click to play animated GIF | MP4]
Overlapping 1-minute Mesoscale Domain Sectors provided 30-second interval GOES-16 (GOES-East) “Red” Visible (0.64 µm) and “Clean” Infrared Window (10.3 µm) images (above) — which showed thunderstorms that produced two EF1-rated tornadoes as well as damaging winds (resulting in some fatalities) across the Houston area (SPC Storm Reports) on 16 May 2024. Widespread structural damage occurred in downtown Houston — and there were also power outages across much of the area. The Infrared images revealed numerous pulses of thunderstorm overshooting tops that exhibited infrared brightness temperatures of -80ºC or colder (shades of violet embedded within brighter white regions).
Larger-scale views of 30-second GOES-16 Visible and Infrared images are shown below.
30-second GOES-16 “Red” Visible (0.64 µm) images with time-matched SPC Storm Reports plotted in red, from 2130 UTC on 16 May to 0017 UTC on 17 May [click to play animated GIF | MP4]
30-second GOES-16 “Clean” Infrared Window (10.3 µm) images with time-matched SPC Storm Reports plotted in cyan, from 2130 UTC on 16 May to 0017 UTC on 17 May [click to play animated GIF | MP4]
Taking a closer look at the Houston metro area, 30-second GOES-16 Visible images with/without an overlay of GLMFlash Extent Density(below) showed the lightning activity associated with these thunderstorms, which included a few brief lightning jumps.
30-second GOES-16 “Red” Visible (0.64 µm) images, with/without an overlay of GLM Flash Extent Density, from 2300 UTC on 16 May to 0030 UTC on 17 May [click to play animated GIF | MP4]
Survey reports from severe storms 5/16: – EF-1 tornado near Cypress (peak winds 110mph). – Straight-line wind damage in downtown Houston. Winds peaked ~ 100mph. – Widespread straight-line winds near Baytown/Galena Park area. Wind peaked 90-100mph.
5-minute CONUS Sector GOES-16 (GOES-East) Ash RGB images (above) showed a pulse of blowing dust — lofted by thunderstorm outflow winds gusting as high as 70 kt (81 mph) — that was moving southward across West Texas late in the day on 16 May 2024. This dust reduced surface visibility to 1-1/4 mi... Read More
GOES-16 Ash RGB images [click to play animated GIF | MP4]
5-minute CONUS Sector GOES-16 (GOES-East)Ash RGB images (above) showed a pulse of blowing dust — lofted by thunderstorm outflow winds gusting as high as 70 kt (81 mph) — that was moving southward across West Texas late in the day on 16 May 2024. This dust reduced surface visibility to 1-1/4 mi at some sites as it made its way south across Interstates I-20 and I-10. In this particular case, the Ash RGB provided a better depiction of the blowing dust than the Dust RGB — for example, at 0001 UTC (both RGBs use the same spectral bands, but are scaled differently).
GOES-16 True Color RGB images from the CSPP GeoSphere site (below) provided a clearer view of the areal coverage of this blowing dust.
GOES-16 True Color RGB images [click to play MP4 animation]
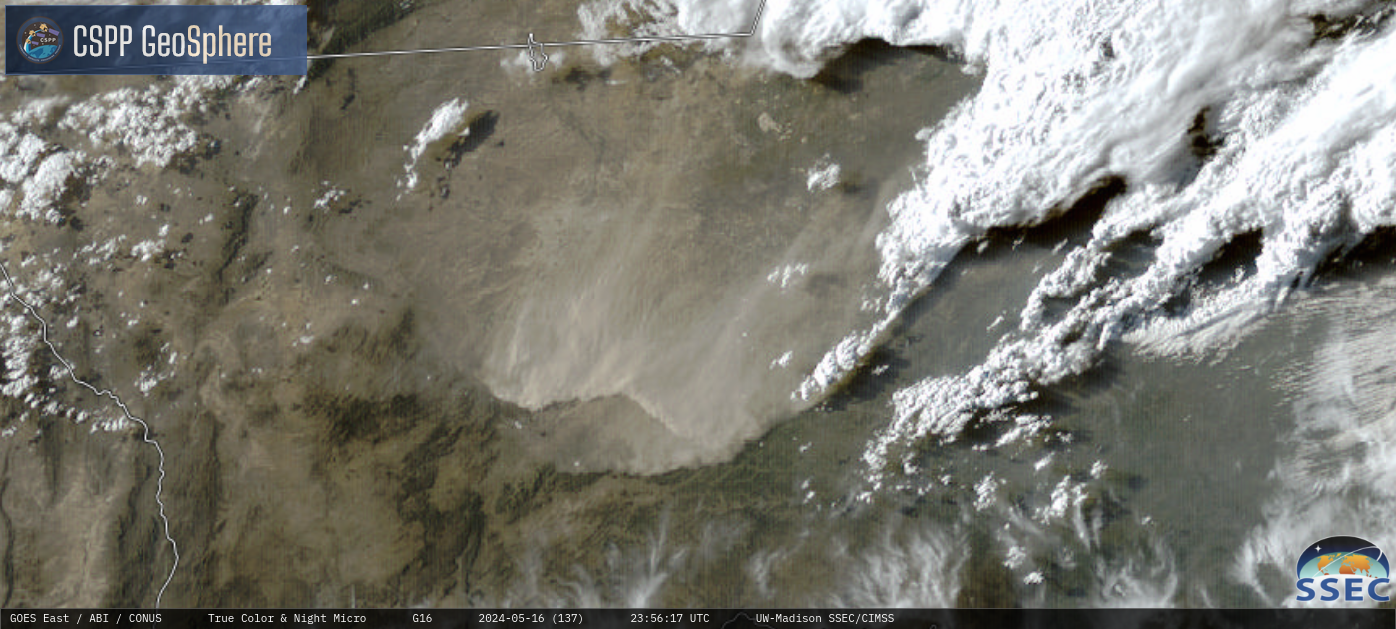
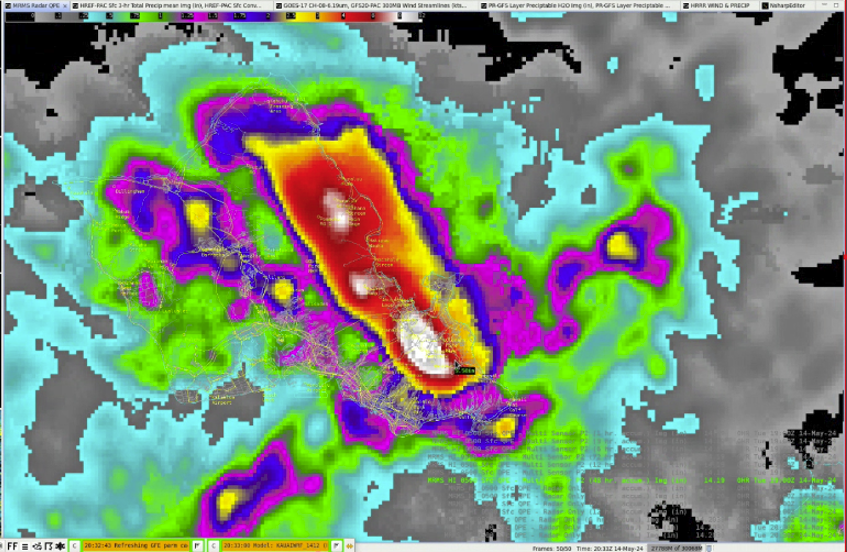
A 16-hour animation using 5-minute GOES-18 PACUS imagery, above (saved from the Geosphere site) shows persistent convection along the east coast of Oahu on 13 May. MIMIC estimates of Total Precipitable Water on 13 May, below, show the state of Hawai’i surounded by abundant moisture, although the richest moisture within the... Read More
GOES-18 Night Microphysics and True Color Imagery, 1201 UTC 13 May – 0401 UTC 14 May 2024
A 16-hour animation using 5-minute GOES-18 PACUS imagery, above (saved from the Geosphere site) shows persistent convection along the east coast of Oahu on 13 May. MIMIC estimates of Total Precipitable Water on 13 May, below, show the state of Hawai’i surounded by abundant moisture, although the richest moisture within the ITCZ remains south of the state. Radar estimates of rainfall exceeded 8 inches over a large part of Oahu.
MIMIC Total Precipitable Water, 0000 UTC 13 May – 0000 UTC 14 May 2024 (Click to enlarge)
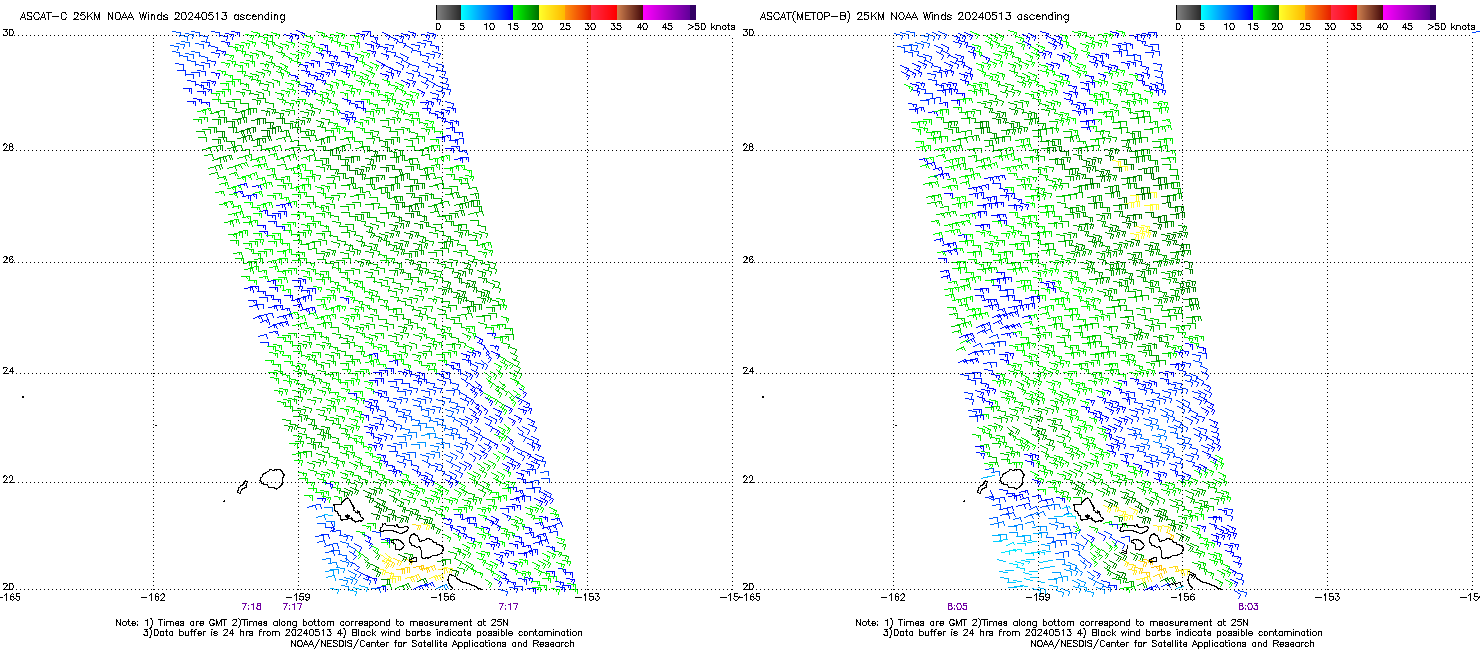
ASCAT winds before the rain developed, below, show persistent east-southeast winds.
Advanced Scatterometer (ASCAT) winds from Metop-C (left, 0718 UTC) and Metop-B (0808 UTC) on 13 May 2024 (click to enlarge)
Upper-air soundings from Lihue and Hilo at 1200 UTC on 13 May and 0000 UTC 14 May, below, (source) show deep moist layers and little in the way of a trade-wind inversion.
Rawindsondes at Lihue (left) and Hilo (right) at 1200 UTC 13 May 2024 (Click to enlarge)Rawindsondes at Lihue (left) and Hilo (right) at 0000 UTC 14 May 2024 (Click to enlarge)
Flooding on the 13th resulted perhaps from persistent, steady moisture-laden flow encoutering the topography of Oahu. Even as the rain fell on the 13th, the National Weather Service in Honolulu started messaging about the possibility of heavy rains with Major Impacts on 16 May.
On 16 May, the development of a strong low to the north of Hawai’i resulted in the northward motion of moisture-rich air. This is shown in the 24-hour animation of MIMIC TPW shown below that shows both the cyclonic system developing, and the draw of moisture from the south. Unlike the case on 13 May, a case might be made on the 16th for a moisture source from the ITCZ.
MIMIC TPW, 1300 UTC on 15 May – 1200 UTC on 16 May 2024 (Click to enlarge)
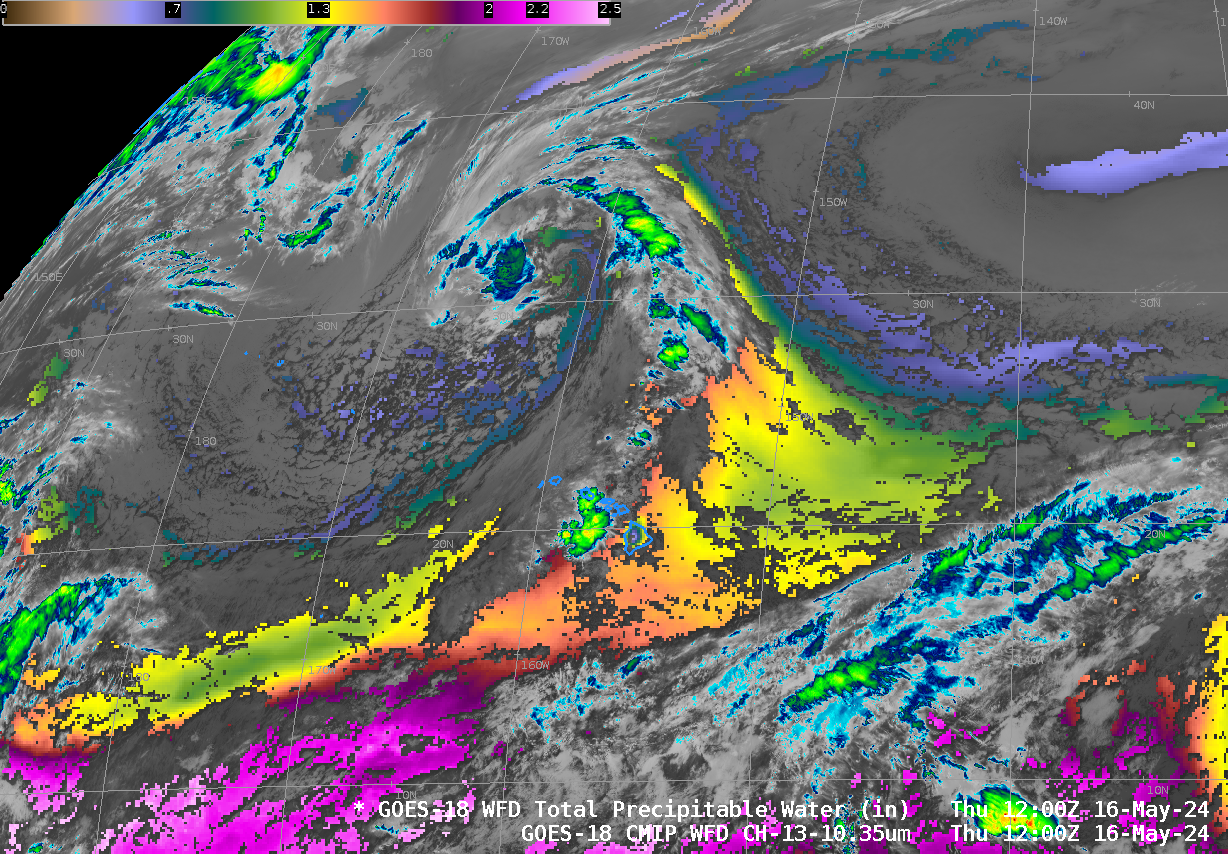
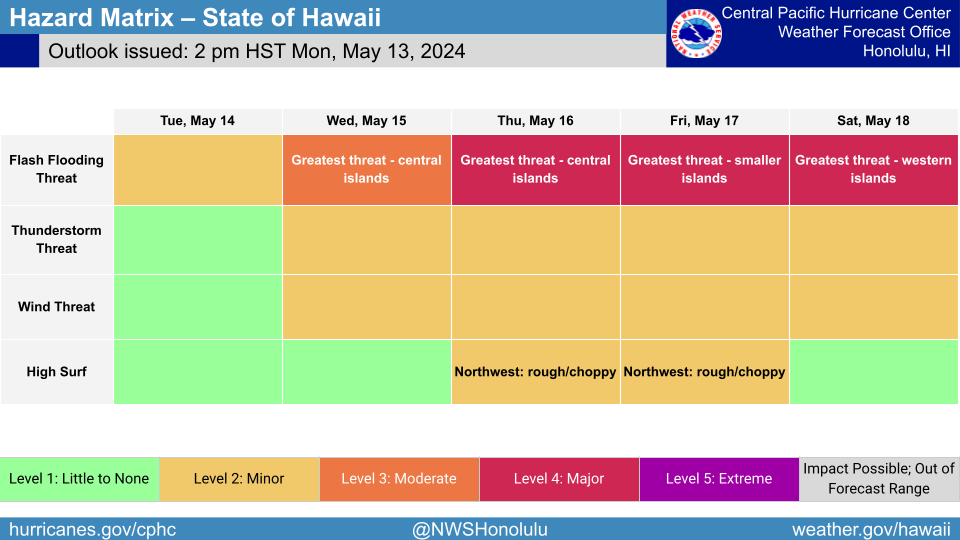
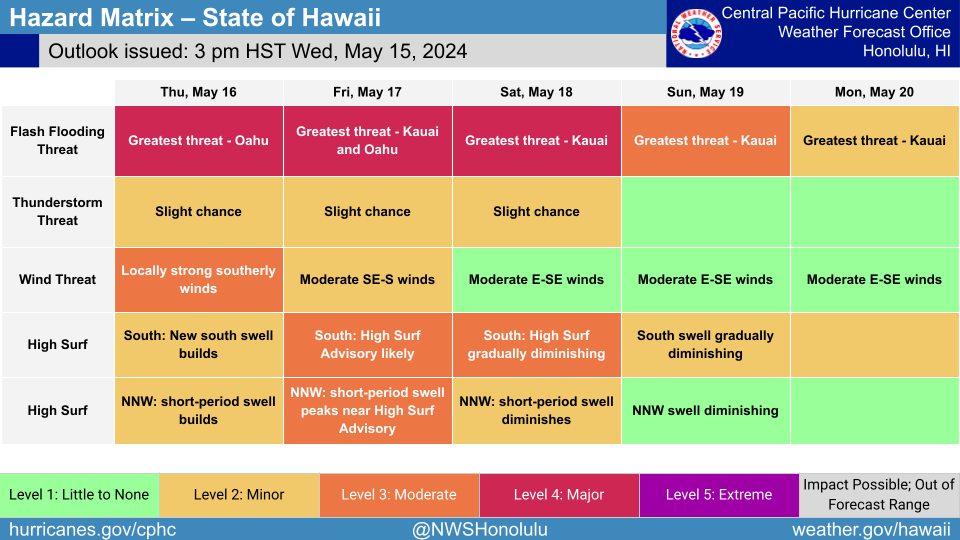
GOES-18 estimates of clear-sky total precipitable water (TPW), below, from 0000 UTC 15 May to 1200 UTC 16 May, also show the gradual increase in moisture and convection over Oahu and Kauai as the circulation of the Kona low to the north of Hawai’i draws moisture northward. Convection associated with the storm on the 15th testifies to the strength of this system. The threat matrix issued late on 15 May is here. The potential for flooding on Hawai’i, particularly on Oahu and Kauai is present on 16 May, and residents of the state should be alert and aware.
GOES-18 Clean Window (Band 13, 10.3 µm) infrared imagery and clear-sky Total Precipitable Water, 0000 UTC 15 May – 1200 UTC 16 May 2024 (Click to enlarge)
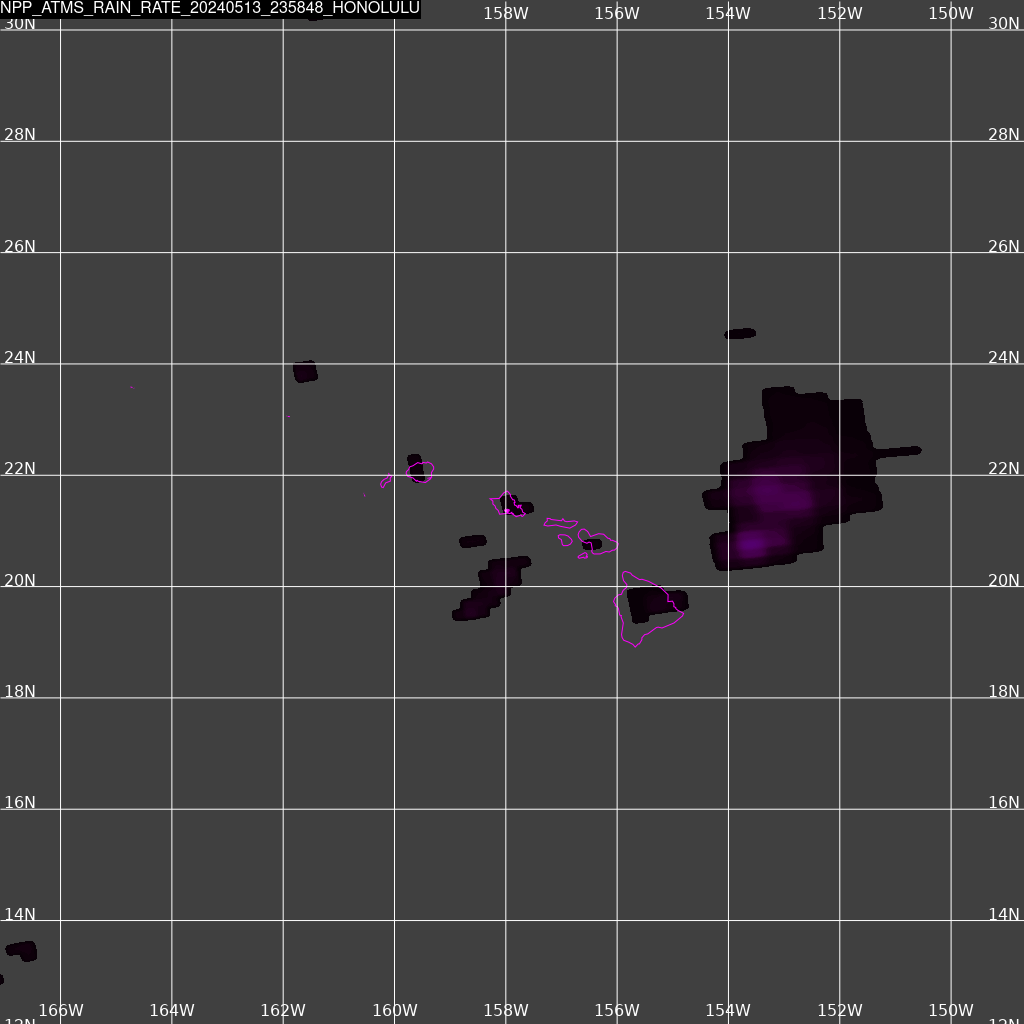
The direct broadcast site at Hawaii Community College (link) included fields of Rain Rate created from NOAA-20 and Suomi-NPP ATMS data. An image from 13 May, below, shows very little precipitation detected over Oahu, testimony perhaps to the very small scale of the rains occurring on that day.
ATMS-derived Rain Rate from Suomi NPP, 13 May 2024 at 2358 UTC (Click to enlarge)
In contrast, the ATMS Rain Rates for 16 May 2024 show a large-scale feature affecting Oahu.
ATMS-derived rain rate centered on Honolulu, 1149 UTC (NOAA-20) and 1215 UTC (Suomi-NPP) on 16 May 2024 (Click to enlarge)
______________
GOES-18 Visible/Infrared Sandwich RGB images from 1701-2101 UTC on 16 May, with 1-hour precipitation accumulation plotted in cyan (courtesy Scott Bachmeier, CIMSS) [click to play animated GIF | MP4]
One round of precipitation occurred on Oahu as a cluster of convection moved northeast across the island from 1801-1936 UTC on 16 May (above).
Cursor sampling of the GOES-18 Rain Rate derived product (red) for convection approaching Oahu at 1826 UTC and 1831 UTC on 16 May (below) showed 0.31 in/hr — which was commensurate with the resulting 1-hour precipitation accumulations across Oahu ending at 1900 UTC and 2000 UTC.
Cursor sampling of the GOES-18 Rain Rate derived product (red) for convection approaching Oahu at 1826 UTC and 1831 UTC on 16 May (courtesy Scott Bachmeier, CIMSS) [click to enlarge]
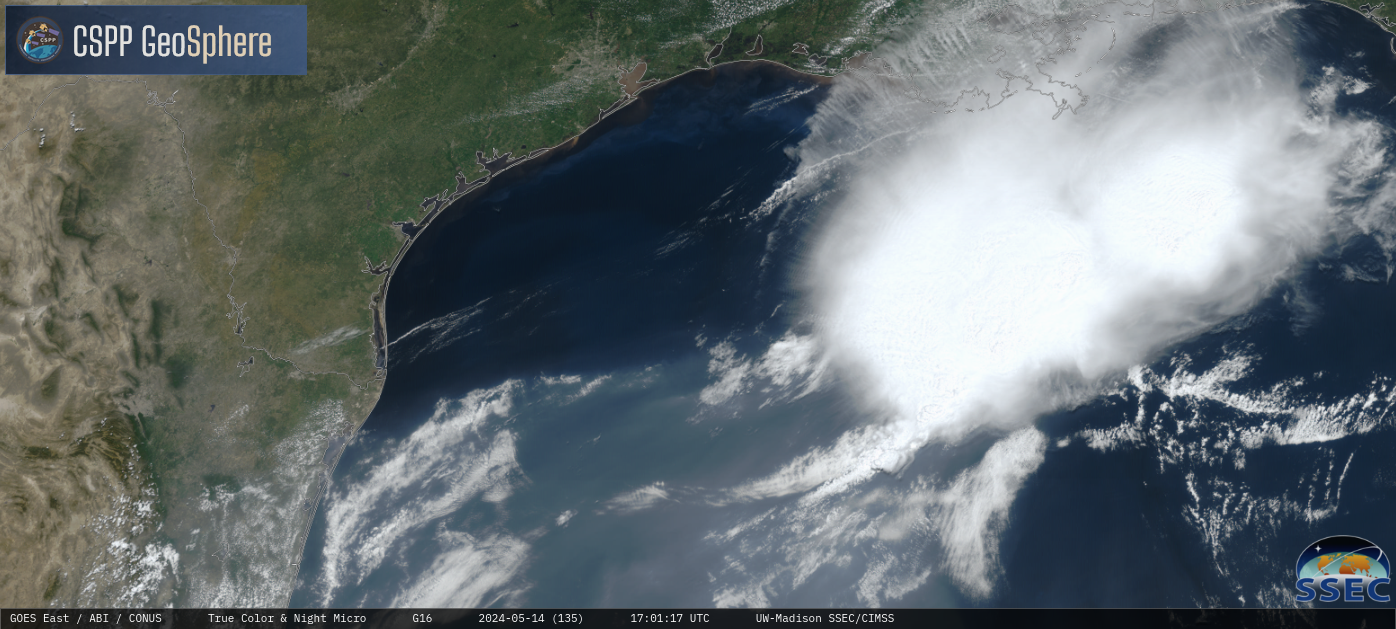
5-minute CONUS Sector GOES-16 (GOES-East) images of the Aerosol Optical Depth (AOD) derived product (above) showed very high AOD values of 1.0-1.8 over the Gulf of Mexico on 14 May 2024 — associated with dense smoke from ongoing seasonal burning activity in parts of Mexico and Central America. This smoke had been... Read More
GOES-16 Aerosol Optical Depth derived product, with Surface Fronts plotted in cyan [click to play animated GIF | MP4]
5-minute CONUS Sector GOES-16 (GOES-East) images of the Aerosol Optical Depth (AOD) derived product (above) showed very high AOD values of 1.0-1.8 over the Gulf of Mexico on 14 May 2024 — associated with dense smoke from ongoing seasonal burning activity in parts of Mexico and Central America. This smoke had been moving northward and covering the entire western half of the Gulf of Mexico — and even parts of the Gulf Coast states — since the end of April. However, a cold front moving southward on 14 May was acting to push the northern edge of the smoke farther away from the Texas coast.
The sharp smoke vs. no-smoke boundary was also very apparent in GOES-16 True Color RGB images from the CSPP GeoSphere site (below).
GOES-16 True Color RGB images [click to play MP4 animation]


