
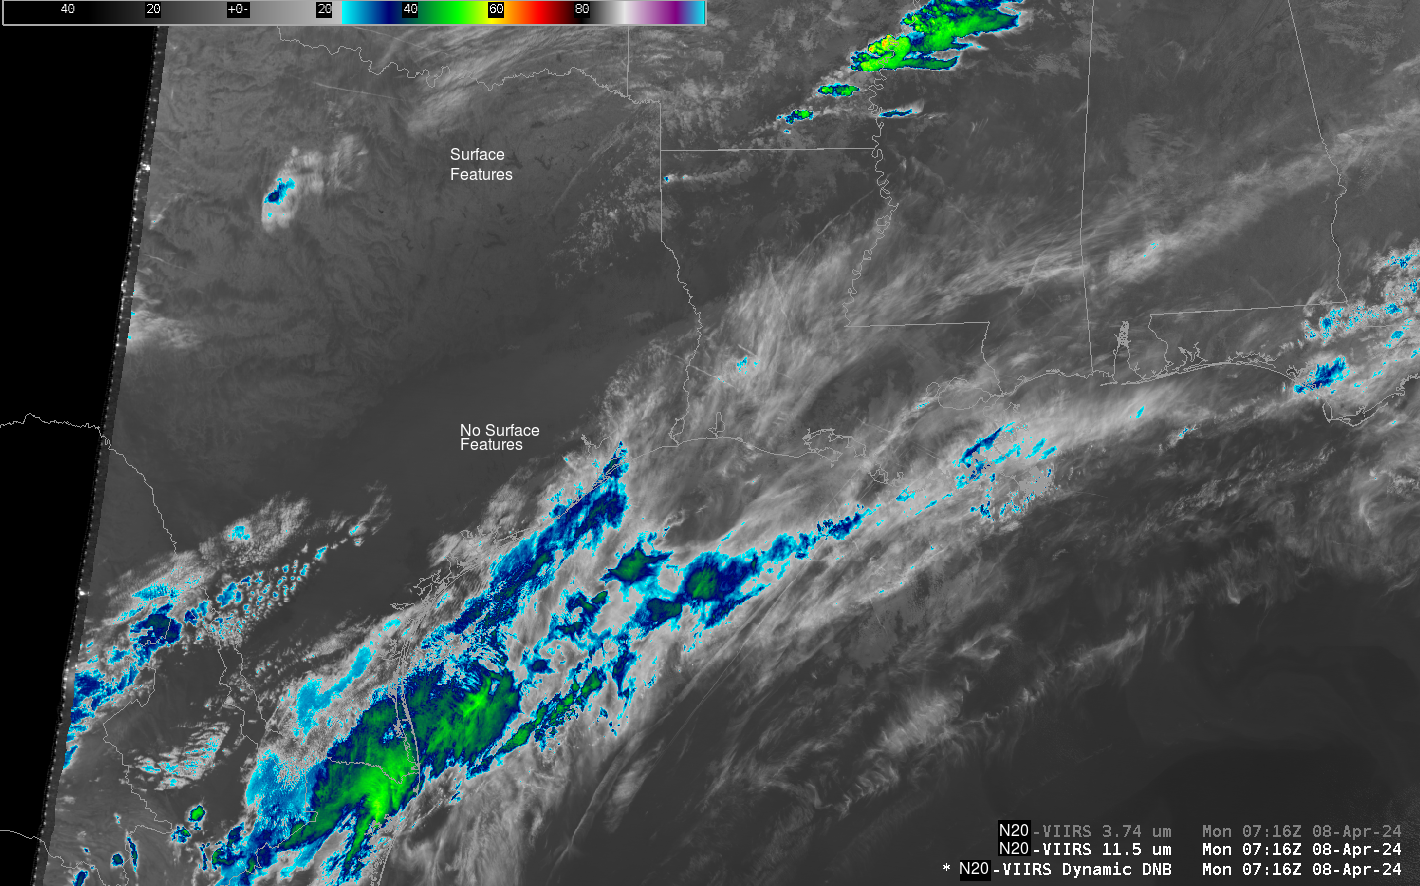
For a solar eclipse to occur, the moon must be in between the Earth and the Sun. This occurs when the Moon is new — that is, when the side of the moon facing the Earth receives no solar illumination. The Day Night Band on Suomi-NPP, or NOAA-21, or NOAA-20 (NOAA-20 is shown above), is therefore only detecting light Cities/Towns, from Gas Flares (as in the arc of light over parts of south Texas, or over the Gulf of Mexico), from Aurora (not in this picture), from fires (none burning in this imagery) or from reflected Earth Air Glow. What information in the Day Night Band tells you where clouds are in such as case? Clouds are faintly visible over the western Gulf of Mexico because of reflected Air Glow. Note also how the city lights over western Louisiana and over northern Mississippi (for example), are slightly blurred. This occurs when visible light energy from city lights is scattered as it moves upward through clouds.
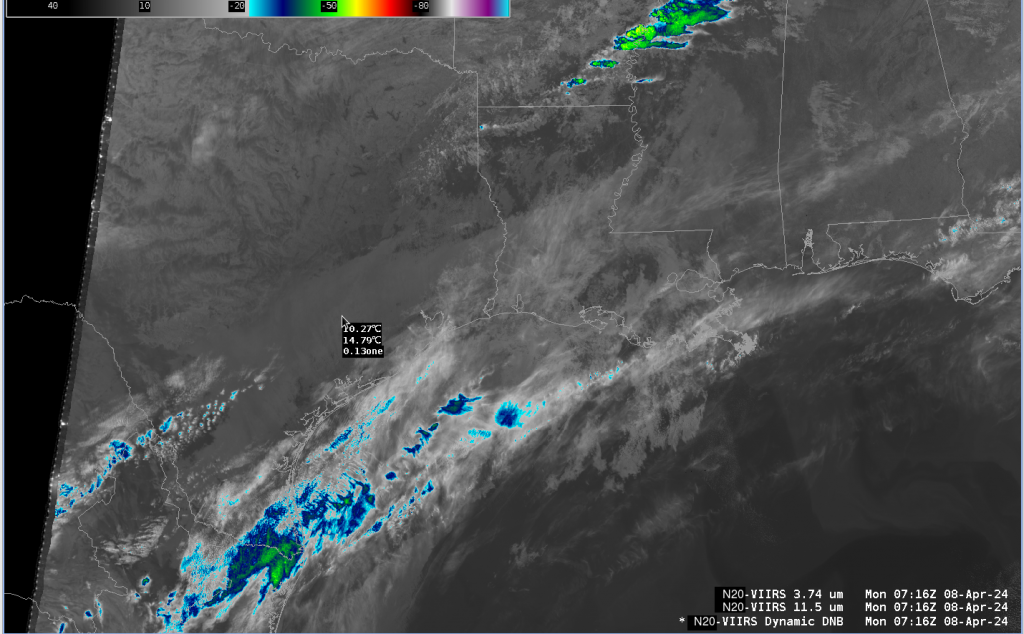
The VIIRS instrument also includes infrared detectors that can better articulate (compared to the Day Night Band image above) where clouds occur. A line of convection (with cold cloud tops) over eastern Arkansas/northern Mississippi is responsible for the attenuation of the visible light there. Cirrus and mid-level clouds are present over western Louisiana. Note in the toggle below the lack of apparent surface features in both the 11.45 µm and 3.74 µm infrared imagery over southeast Texas — compared to the presence of warmer features (likely lakes) over northern Texas. (Click here for an annotated 11.45 µm image).
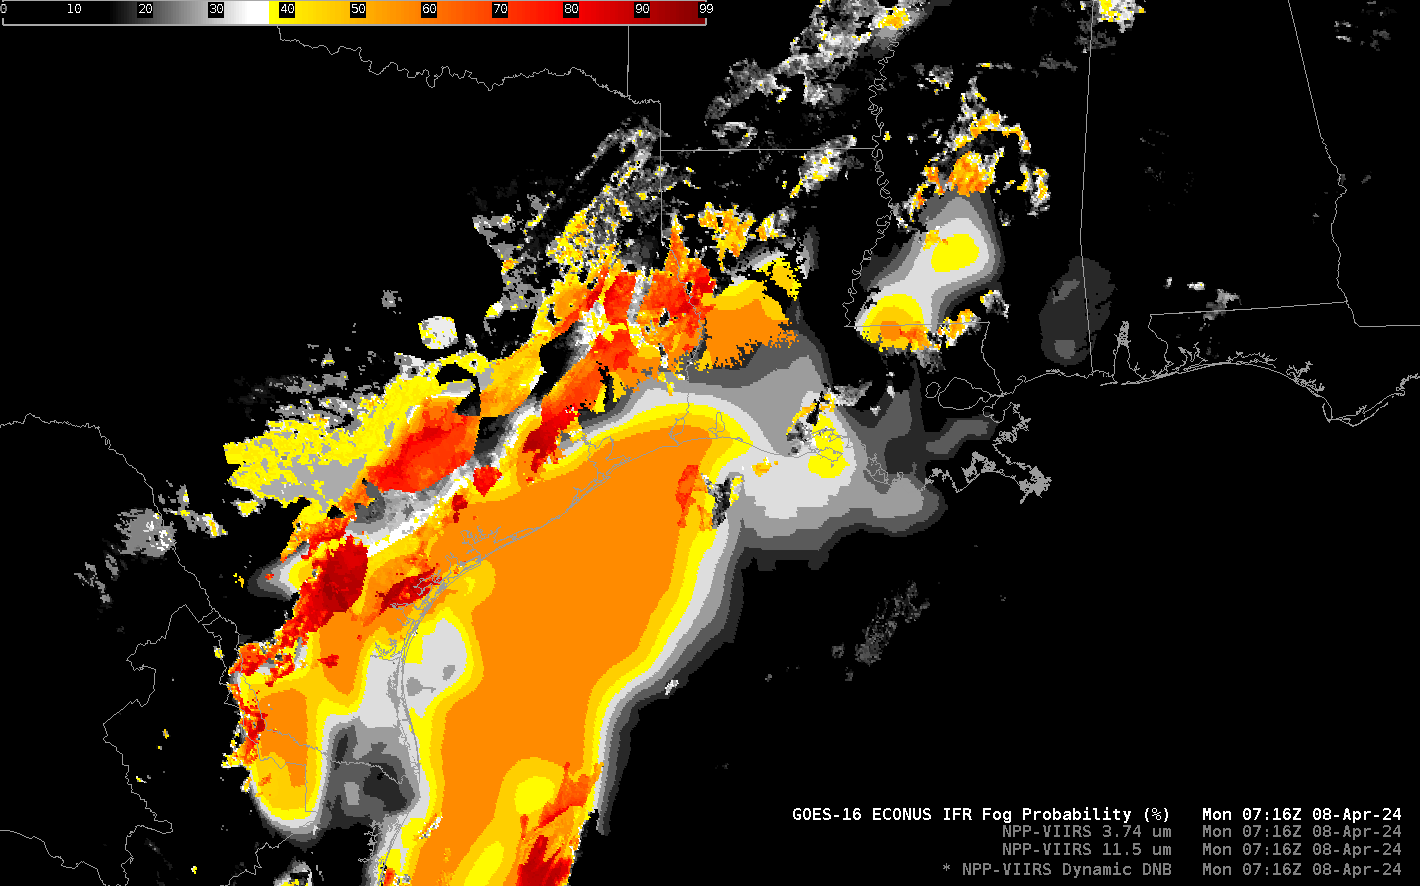
The 3.74 µm brightness temperature in that uniform region is cooler than the 11.45 µm brightness temperature. This is consistent with the presence of low stratus in that location, and IFR Probability fields at that time agree with the likelihood of low stratus.
View only this post Read Less


