This website works best with a newer web browser such as Chrome, Firefox, Safari or Microsoft
Edge. Internet Explorer is not supported by this website.
1-minute Mesoscale Domain Sector GOES-16 (GOES-East) images from all 16 of the ABI spectral bands along with a Rocket Plume RGB (above) displayed signatures of the SpaceX Falcon Heavy rocket booster that launched GOES-U from NASA Kennedy Space Center in Florida at 2126 UTC (5:26 PM EST) on 25 June 2024. A warm thermal signature of the rocket booster (moving rapidly... Read More
Stepped sequence of 1-minute GOES-16 images from all 16 ABI spectral bands, plus a Rocket Plume RGB; KXMR denotes the location of the Cocoa Beach rawinsonde site [click to play animated GIF | MP4]
1-minute Mesoscale Domain Sector GOES-16 (GOES-East) images from all 16 of the ABI spectral bands along with a Rocket Plume RGB(above) displayed signatures of the SpaceX Falcon Heavy rocket booster that launched GOES-U from NASA Kennedy Space Center in Florida at 2126 UTC (5:26 PM EST) on 25 June 2024. A warm thermal signature of the rocket booster (moving rapidly to the east-northeast) and/or the relatively bright in bands 01-06 or cold in bands 07-16 rocket condensation cloud (which remained just off the coast, due to wind shear with height) were evident in all 16 of the ABI spectral band images, as well as the Rocket Plume RGB imagery. One of the more notable rocket signatures was seen in imagery at 2129 UTC: the very warm thermal anomaly of the boostback burn of the two Stage 1 side boosters, along with the warm thermal anomaly of the Stage 2 engine start (located farther downrange).
30-second images from GOES-18 (GOES-West) are shown below.
Stepped sequence of 30-second GOES-18 images from all 16 ABI spectral bands, plus a Rocket Plume RGB; KXMR denotes the location of the Cocoa Beach rawinsonde site [click to play animated GIF | MP4]
1-minute GOES-16 Visible/Infrared Sandwich RGB images with/without an overlay of GLMFlash Extent Density(below) showed the cold overshooting tops and lightning activity associated with a small cluster of thunderstorms that was moving eastward toward the coast — at the 2126 UTC launch time, the edge of a thunderstorm anvil (and its associated lightning) was about 20 miles southwest of Launch Complex 39A at Kennedy Space Center (where the Falcon Heavy condensation cloud originated).
1-minute GOES-16 Visible/Infrared Sandwich RGB images with/without an overlay of GLM Flash Extent Density; KXMR denotes the location of the Cocoa Beach rawinsonde site [click to play animated GIF | MP4]
Note that the Falcon Heavy condensation cloud became sheared, and eventually began drifting back toward the coast — a plot of rawinsonde data (source) from Cocoa Beach KXMR (below) depicted the shift to northeasterly winds at the 100 hPa pressure level (an altitude of about 17-18 km).
Plot of rawinsonde data from Cocoa Beach (KXMR) at 1500 UTC on 25 June [click to enlarge]
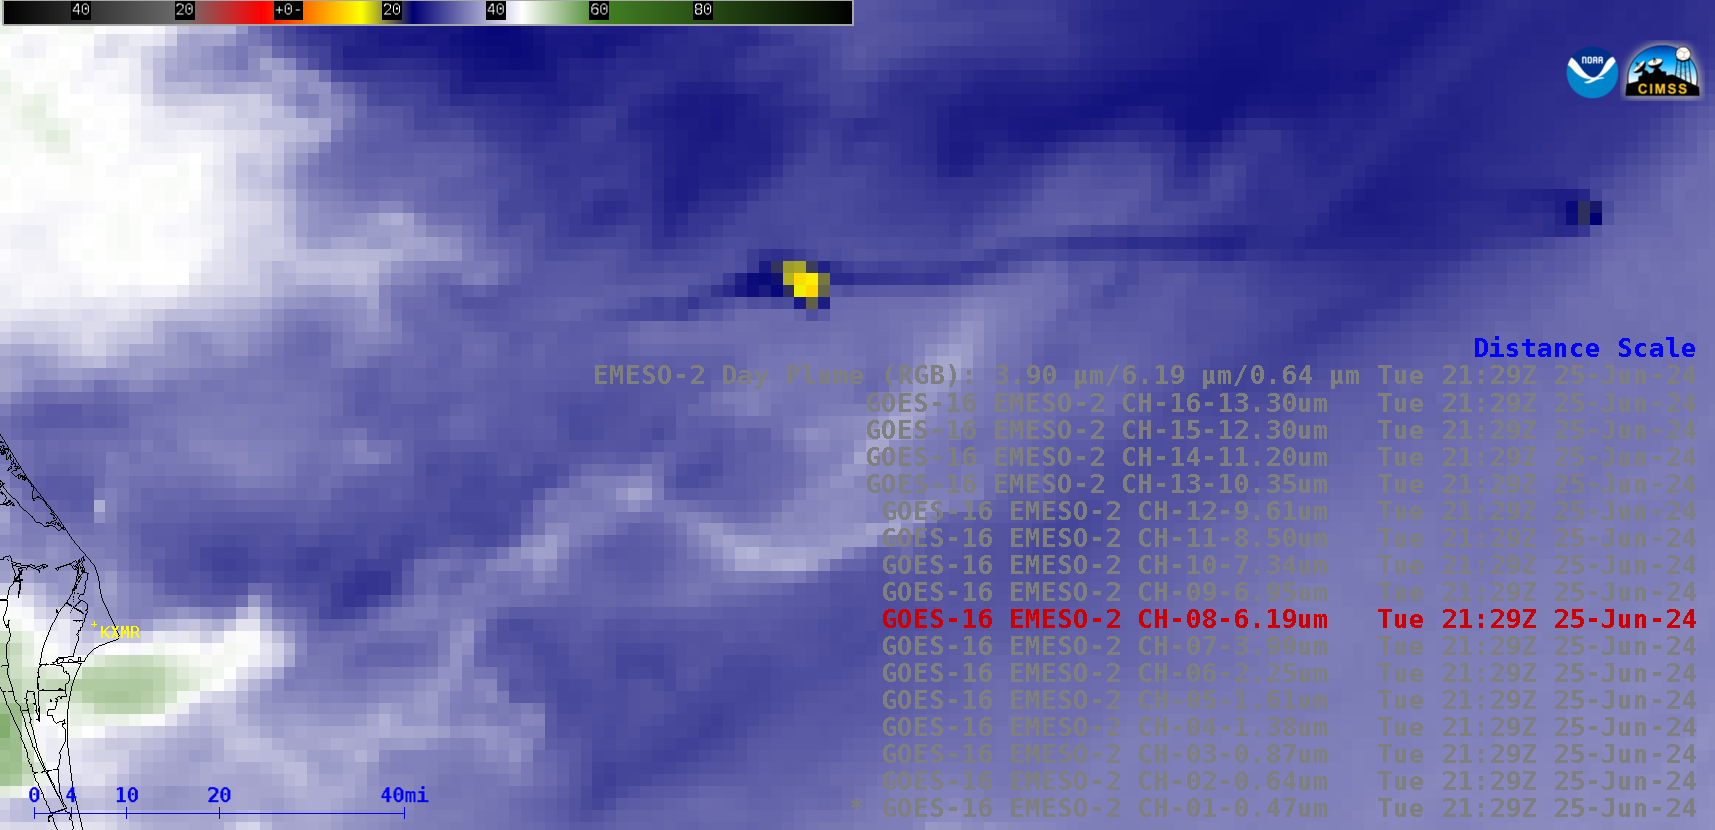
GOES-16 ABI water vapor band (8) on June 25, 2024. The red circle shows the initial rocket plume, while the white circle the booster re-entry. Click to Play.
The same loop as above, minus the red and white circles. These loops were created by T. Schmit, NOAA/NEDIS/STAR.
1-minute Mesoscale Domain Sector GOES-16 (GOES-East) “Red” Visible (0.64 µm) and “Clean” Infrared Window (10.3 µm) images (above) showed thunderstorms that produced 7 tornadoes, hail as large as 2.00 inch in diameter and damaging wind gusts across southern Wisconsin (SPC Storm Reports) on 22 June 2024. The Infrared images revealed pulses of thunderstorm overshooting tops that exhibited 10.3 µm brightness temperatures as cold as -75ºC (brighter... Read More
1-minute GOES-16 “Red” Visible (0.64 µm, top) and “Clean” Infrared Window (10.3 µm, bottom) images with time-matched (+/- 3 minutes) SPC Storm Reports plotted in red/blue, from 2232 UTC on 22 June to 0122 UTC on 23 June [click to play animated GIF | MP4]
1-minute Mesoscale Domain Sector GOES-16 (GOES-East) “Red” Visible (0.64 µm) and “Clean” Infrared Window (10.3 µm) images (above) showed thunderstorms that produced 7 tornadoes, hail as large as 2.00 inch in diameter and damaging wind gusts across southern Wisconsin (SPC Storm Reports) on 22 June 2024. The Infrared images revealed pulses of thunderstorm overshooting tops that exhibited 10.3 µm brightness temperatures as cold as -75ºC (brighter white pixels embedded within dark black regions) — and brief Enhanced-V cloud-top signatures were evident with some of the storms. A few short-lived Above-Anvil Cirrus Plumes (reference | VISIT training) could be seen in the Visible images (although there was no corresponding distinct AACP signature in the lower-resolution Infrared images).
1-minute GOES-16 Visible and Infrared images with an overlay of GLMFlash Extent Density(below) showed the lightning activity associated with these thunderstorms, which included a few brief lightning jumps.
1-minute GOES-16 “Red” Visible (0.64 µm, top) and “Clean” Infrared Window (10.3 µm, bottom) images, with/without an overlay of GM Flash Extent Density, from 2230 UTC on 22 June to 0120 UTC on 23 June [click to play animated GIF | MP4]
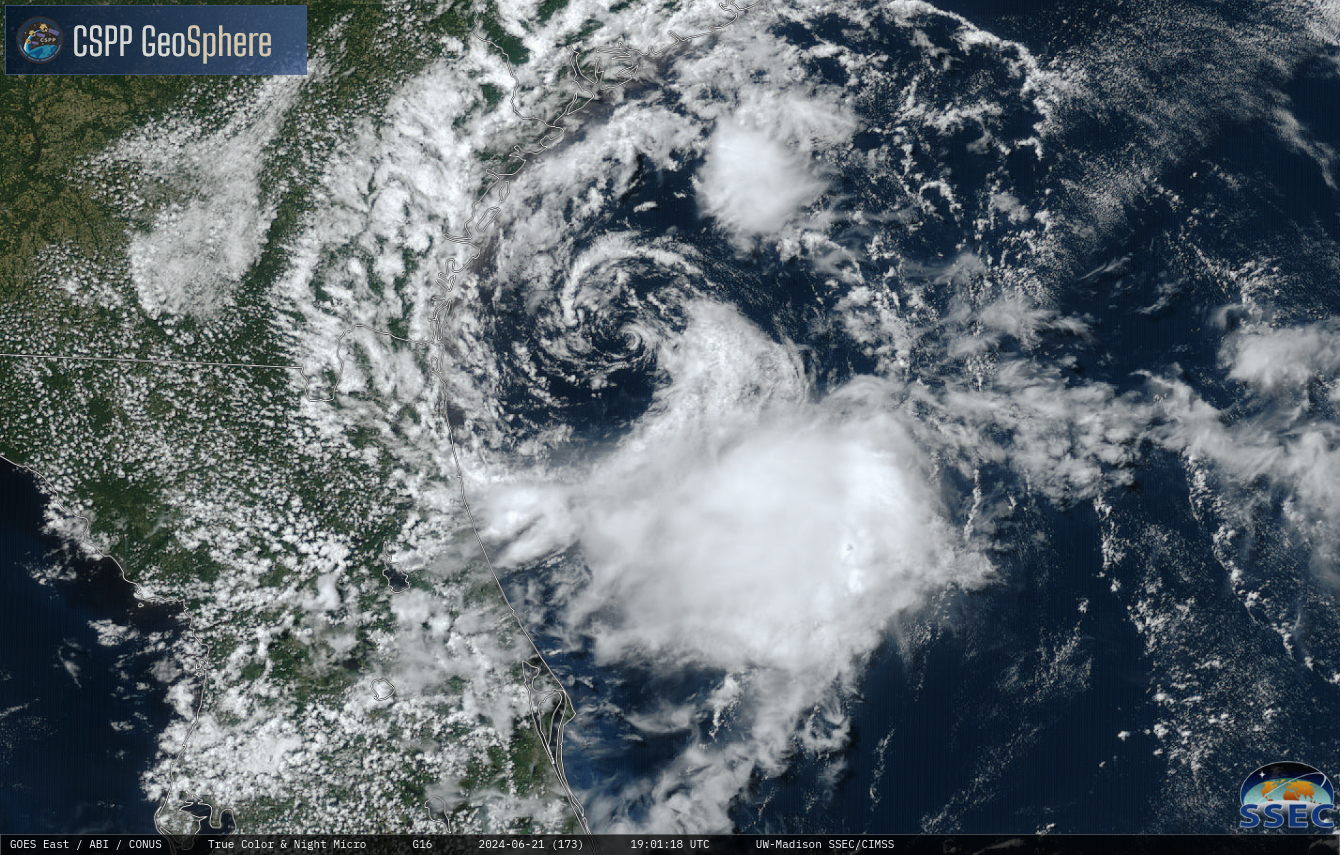
Geosphere true-color imagery over the Atlantic Ocean to the east of Florida and Georgia, above, shows a low-level cyclonic circulation with strong convection to its south. The appearance of the system suggests strong shear; an analysis of shear from the SSEC Tropical Weather website, below, shows the northerly shear over the storm... Read More
CSPP Geosphere True Color Imagery (as an mp4 animation) over the Atlantic Ocean east of Florida and Georgia, 1546-1901 UTC on 21 June 2024
Geosphere true-color imagery over the Atlantic Ocean to the east of Florida and Georgia, above, shows a low-level cyclonic circulation with strong convection to its south. The appearance of the system suggests strong shear; an analysis of shear from the SSEC Tropical Weather website, below, shows the northerly shear over the storm that displaces the convection.
850-200 mb shear, 1800 UTC on 21 JUne 2024 (Click to enlarge)
__________
1-minute GOES-16 “Red” Visible (0.64 µm) images, from 1400 UTC on 21 June to 0000 UTC on 22 June (courtesy Scott Bachmeier, CIMSS) [click to play animated GIF | MP4]
1-minute Mesoscale Domain Sector GOES-16 (GOES-East) “Red” Visible (0.64 µm) images (above) showed a closer view of the exposed low level circulation center (LLCC) of Invest 92L. A slight amount of trochoidal motion (wobble) was seen as the LLCC moved toward the coast.
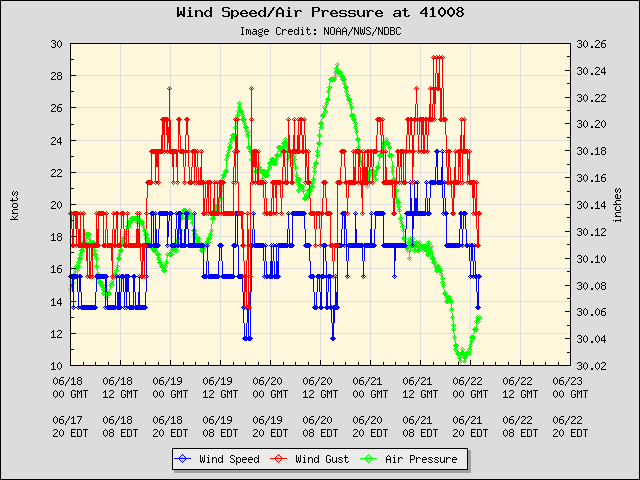
1-minute GOES-16 Visible images with plots of 5-minute Derived Motion Winds(below) depicted slightly higher wind speeds (30-35 knots, yellow wind barbs) within the northeast quadrant of 92L — but satellite-derived wind speeds with the circulation of 92L were generally in the 10-25 knot range. Invest 92L passed between Buoy 41008 to the north and Buoy SAUF1 to the south; on 21 June the highest wind speeds/gusts at those two buoys were in the 22-29 knot range. 92L eventually moved inland several hours after sunset, near the Georgia/Florida border — between Brunswick GA (KSSI) and Jacksonville FL (KCRG). Wind speeds/gusts remained below 30 knots at those two sites as well.
1-minute GOES-16 “Red” Visible (0.64 µm) images with plots of Derived Motion Winds, from 1500-2330 UTC on 21 June (courtesy Scott Bachmeier, CIMSS) [click to play animated GIF | MP4]
__________
GOES-16 Geocolor imagery, overlain with GLM Flash Extent Density fields, below, (from this source), show meager lightning within the convection to the south of the low-level cyclonic circulation.
GOES-16 Geocolor and GLM Flash Extent Density, 1521 – 1911 UTC on 21 June 2024 (Click to enlarge)
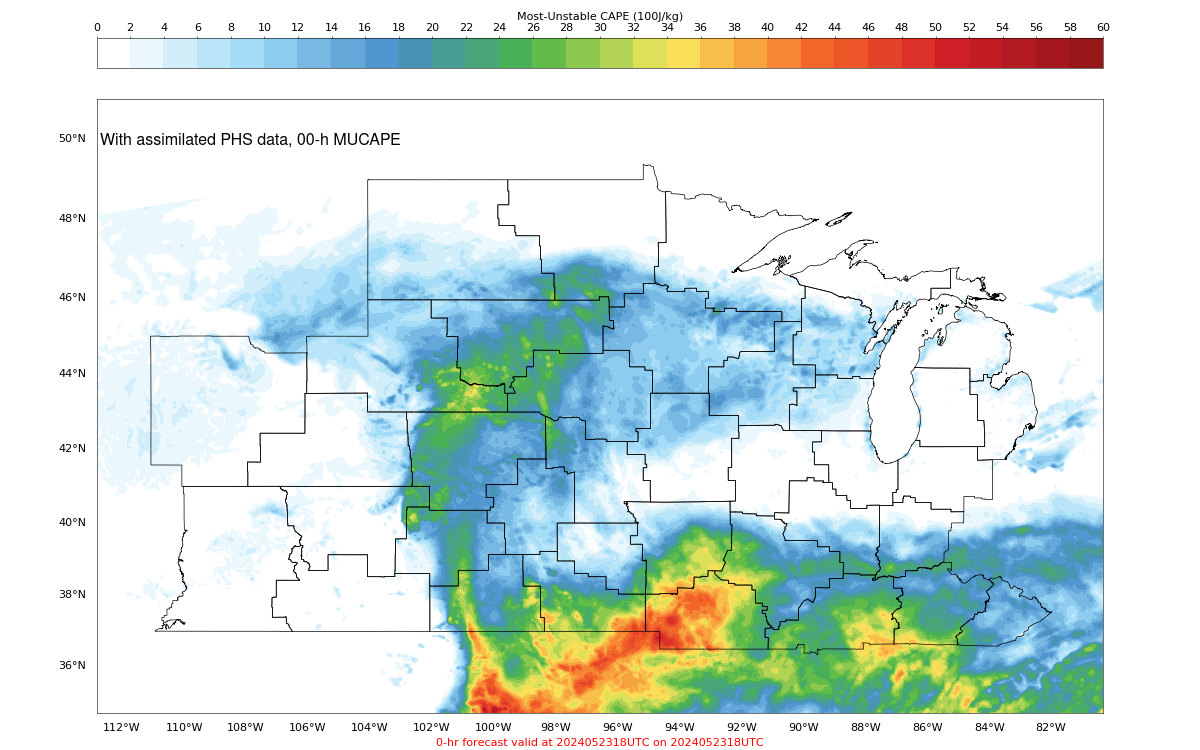
Polar Hyperspectral Data (PHS) can be married to ABI data via Data Fusion, and that data that exploits the high spectral resolution of Polar Hyperspectral Data (from IASI and CrIS data on Metop and JPSS satellites, respectively) and the high spatial/temporal resolution of ABI data can be assimilated into a... Read More
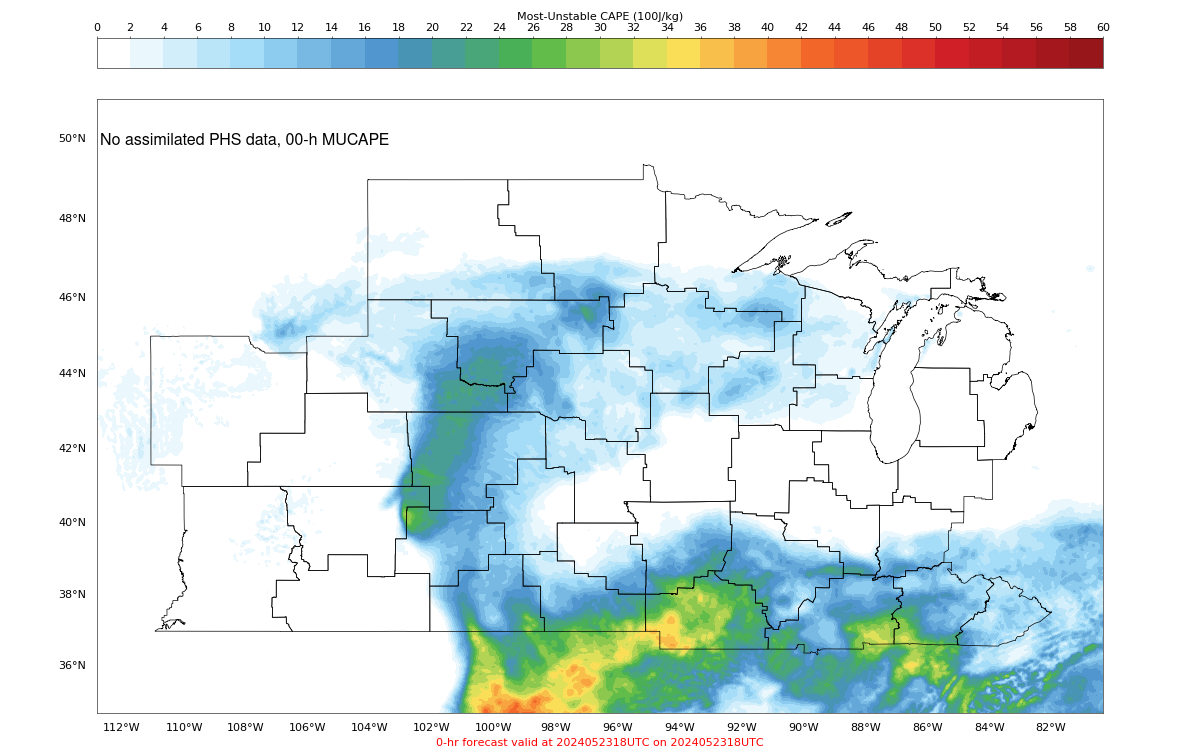
WRF model fields (4-km resolution) of MUCAPE at 00h in a simulation that starts at 1800 UTC on 23 May 2024; the toggle compares WRF runs with and without PHS data within the initial fields (Click to enlarge)
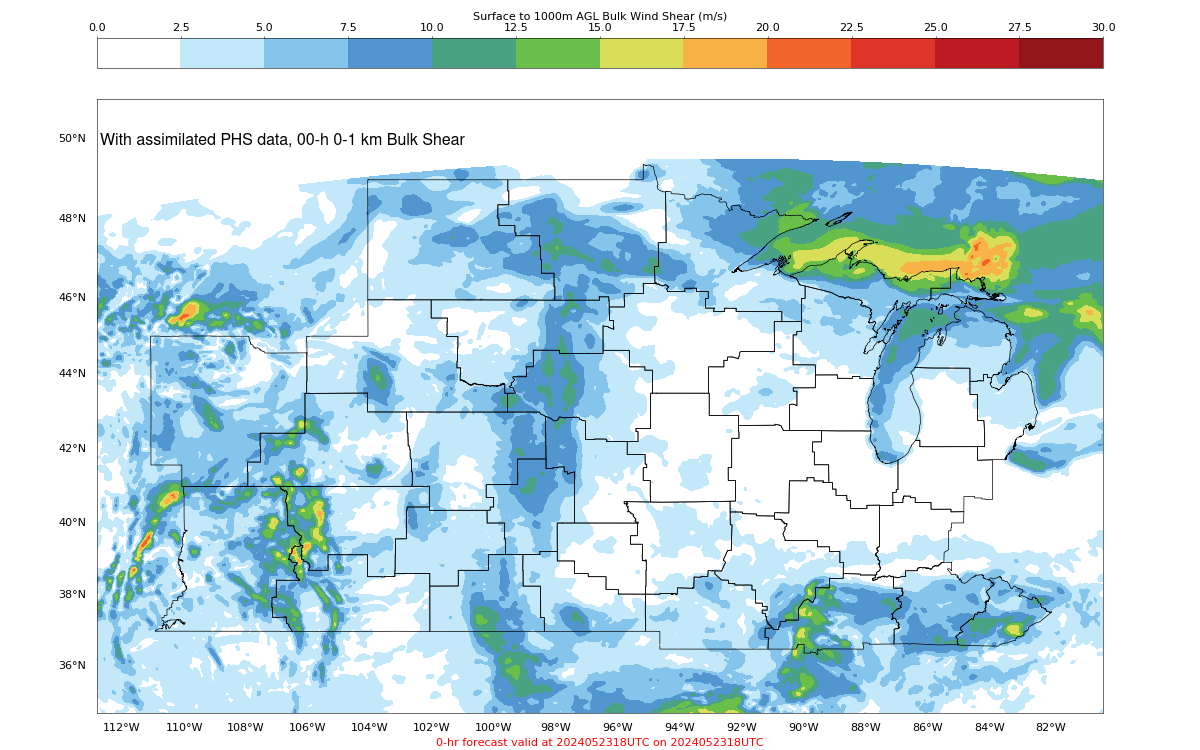
Polar Hyperspectral Data (PHS) can be married to ABI data via Data Fusion, and that data that exploits the high spectral resolution of Polar Hyperspectral Data (from IASI and CrIS data on Metop and JPSS satellites, respectively) and the high spatial/temporal resolution of ABI data can be assimilated into a numerical model. The toggle above compares MUCAPE fields at 0000 UTC from an 1800 UTC 23 May 2024 initialization (more output from this day is shown in this blog post) created with and without PHS data. A similar toggle that compares 0-1 km Bulk Shear (with and without PHS data) is below. In both fields, the PHS data has introduced low-level variability that should better reflect the actual distribution of thermodynamics as measured by the sounders on the LEO satellites.
WRF model fields (4-km resolution) of 0-1 km Bulk Shear at 00h in a simulation that starts at 1800 UTC on 23 May 2024; the toggle compares WRF runs with and without PHS data within the initial fields (Click to enlarge)
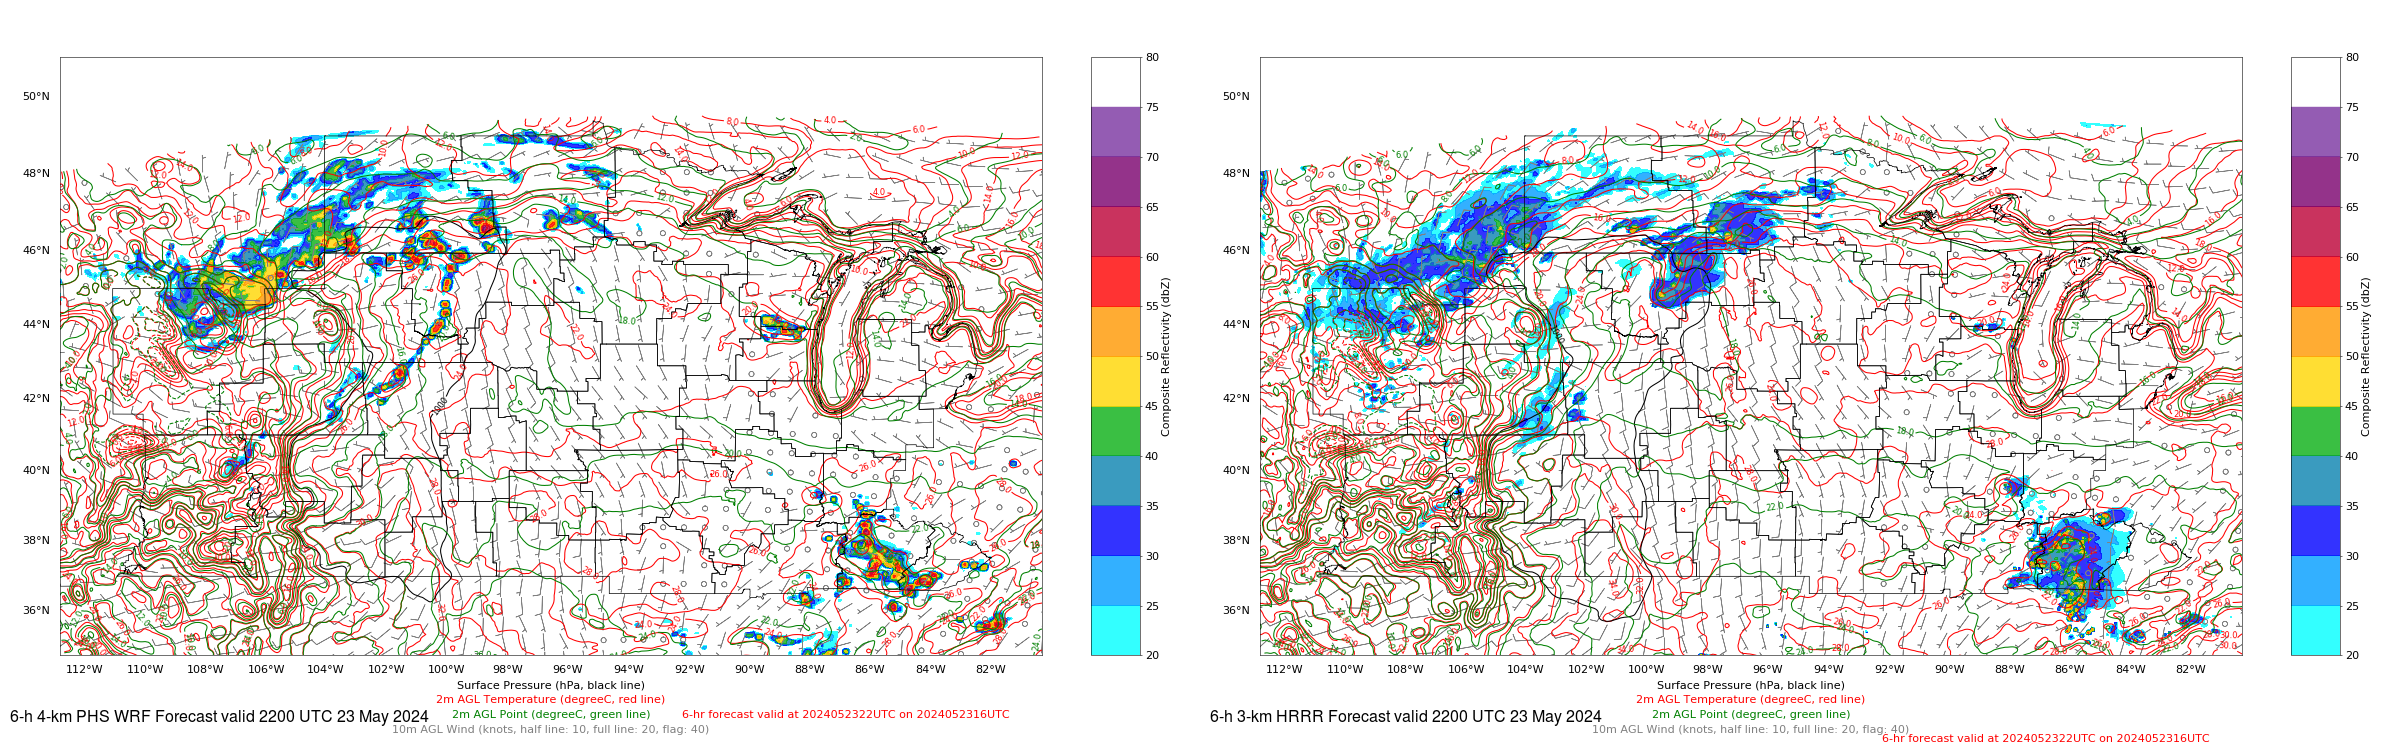
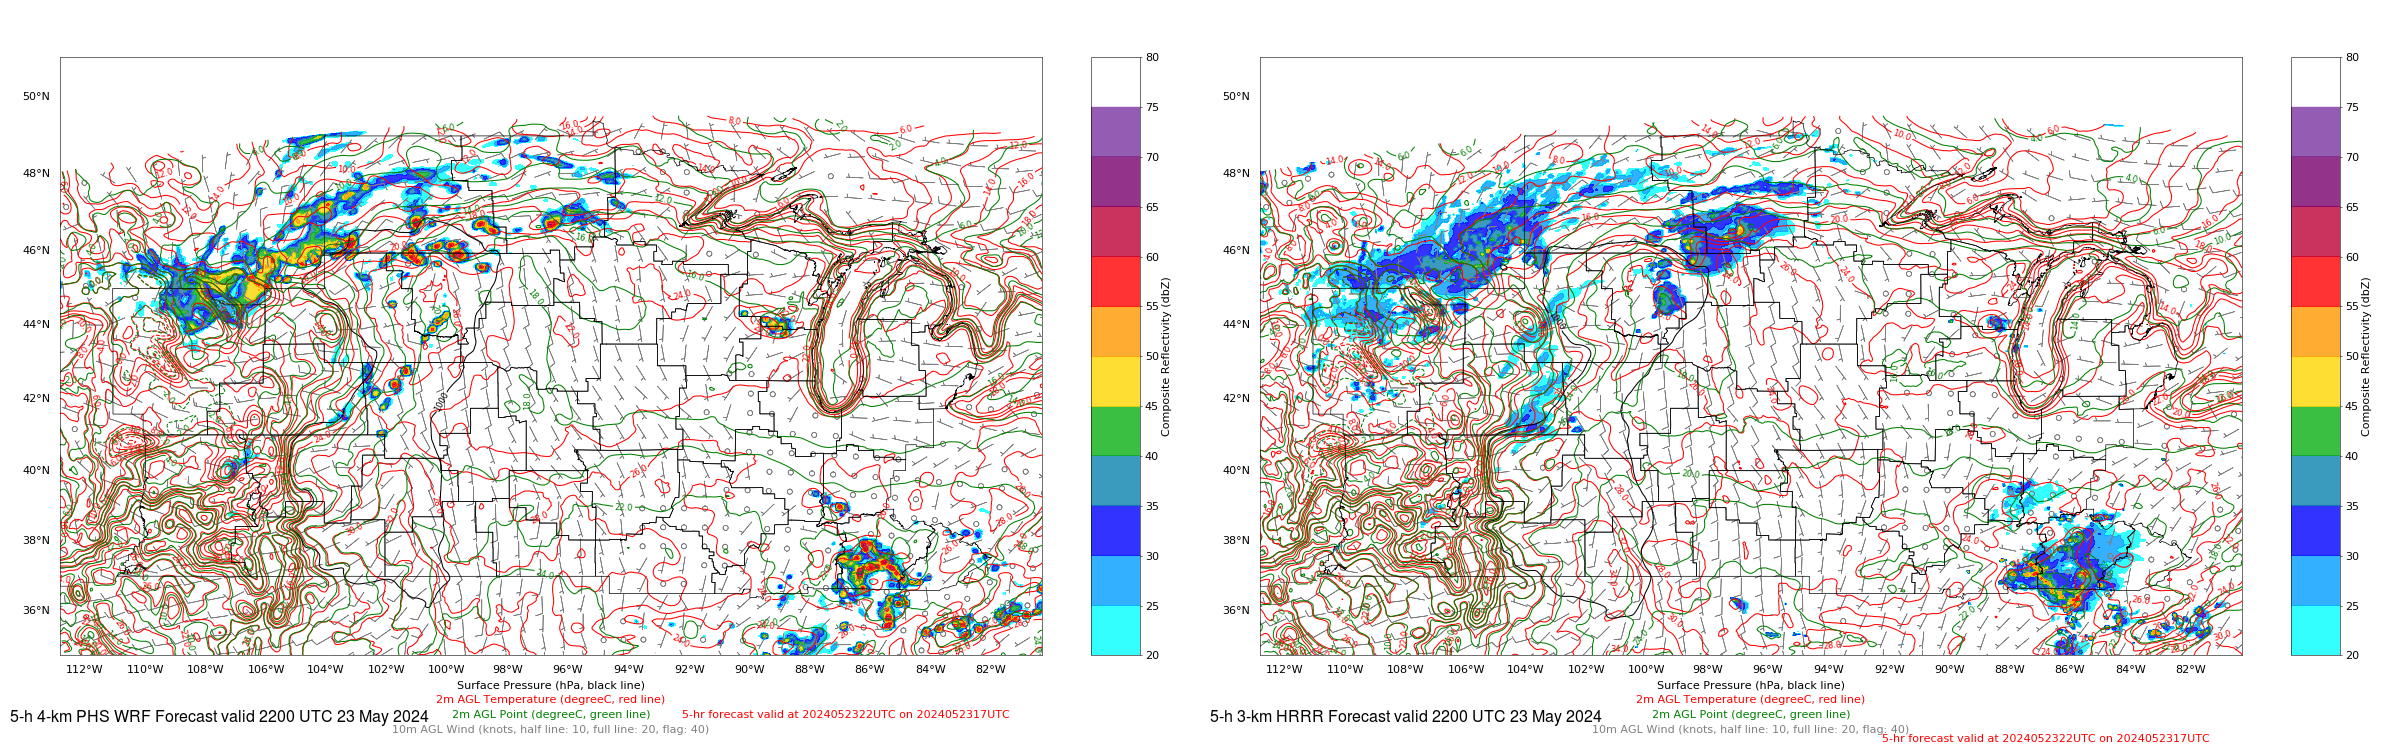
Does the better representation of thermodynamic variability (and variability in dynamics) translate in this case to a better forecast. In the previous blog post, the WRF simulation with PHS data starting at 1600 UTC and 1700 UTC did show better convective initiation times than the HRRR simulation that did not benefit from the inclusion of PHS data (i.e, this figure, and this one, respectively). The 4-h forecast valid at 2200 UTC (that compares 4-km WRF with PHS data and 3-km HRRR data, here, shows better initialization in the WRF with PHS data). The toggle below compares 4-h forecasts from a 4-km WRF model initialized at 1800 UTC, and valid at 2200 UTC; one simulation includes assimilated PHS data, and one does not. The initiation of convection is not substantially different in the model runs initialized at 1800 UTC. The higher spatial variability for this case at this time does not lead to a better forecast of initiation as was apparent in the earlier model runs described in this blog post.
WRF model fields (4-km resolution) of Surface fields including Composite Reflectivity at 04h in a simulation that starts at 1800 UTC on 23 May 2024; the toggle compares WRF runs with and without PHS data within the initial fields (Click to enlarge)


