A toggle between Suomi-NPP VIIRS Visible (0.64 µm) and Infrared Window (11.45 µm) images valid at 1335 UTC on 27 June 2024 (above) showed a severe-warned thunderstorm just west of Noatak, Alaska. This thunderstorm — located north of the Arctic Circle — exhibited a cloud-top infrared brightness temperature as cold as... Read More
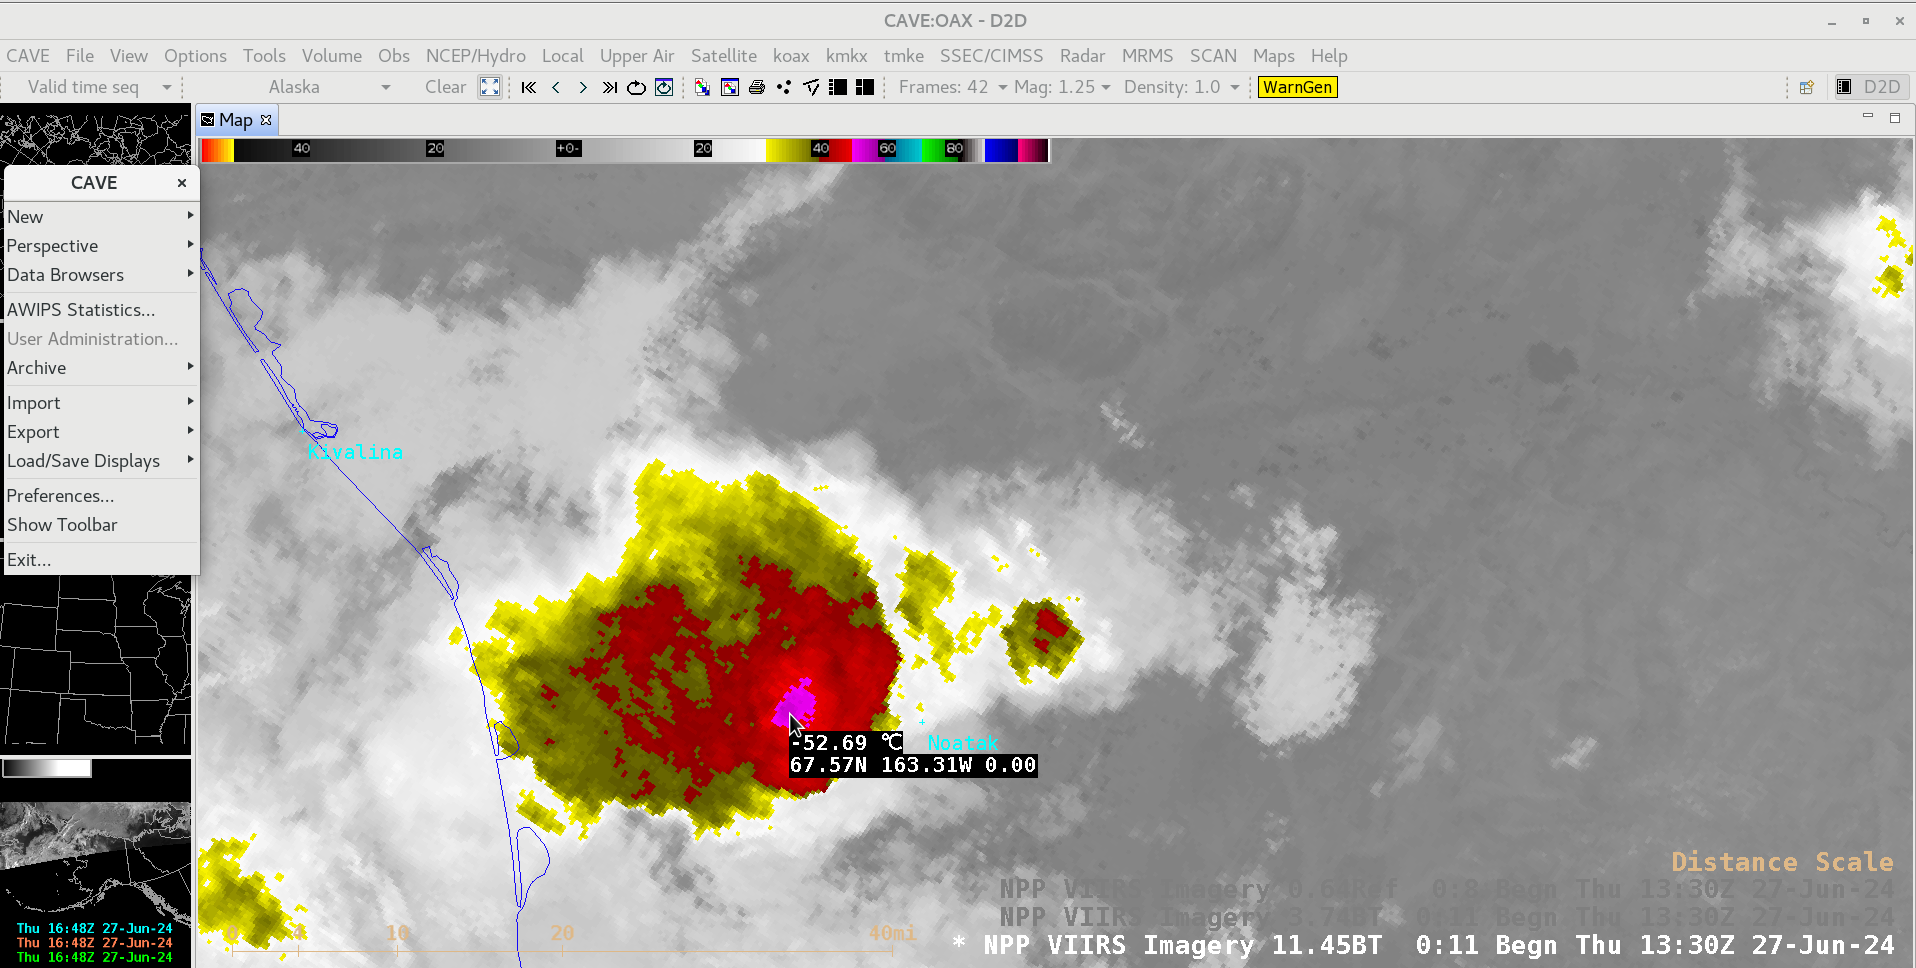
Suomi-NPP VIIRS Visible (0.64 µm) and Infrared Window (11.45 µm) images valid at 1335 UTC on 27 June [click to enlarge]
A toggle between Suomi-NPP VIIRS Visible (0.64 µm) and Infrared Window (11.45 µm) images valid at 1335 UTC on 27 June 2024 (above) showed a severe-warned thunderstorm just west of Noatak, Alaska. This thunderstorm — located north of the Arctic Circle — exhibited a cloud-top infrared brightness temperature as cold as -52.69ºC.
1-minute Mesoscale Domain Sector GOES-18 (GOES-West) “Red” Visible (0.64 µm) and “Clean” Infrared Window (10.3 µm) images (below) showed the thunderstorm activity as it moved northwest past the Noatak (PAWN) area and continued to approach the coast.
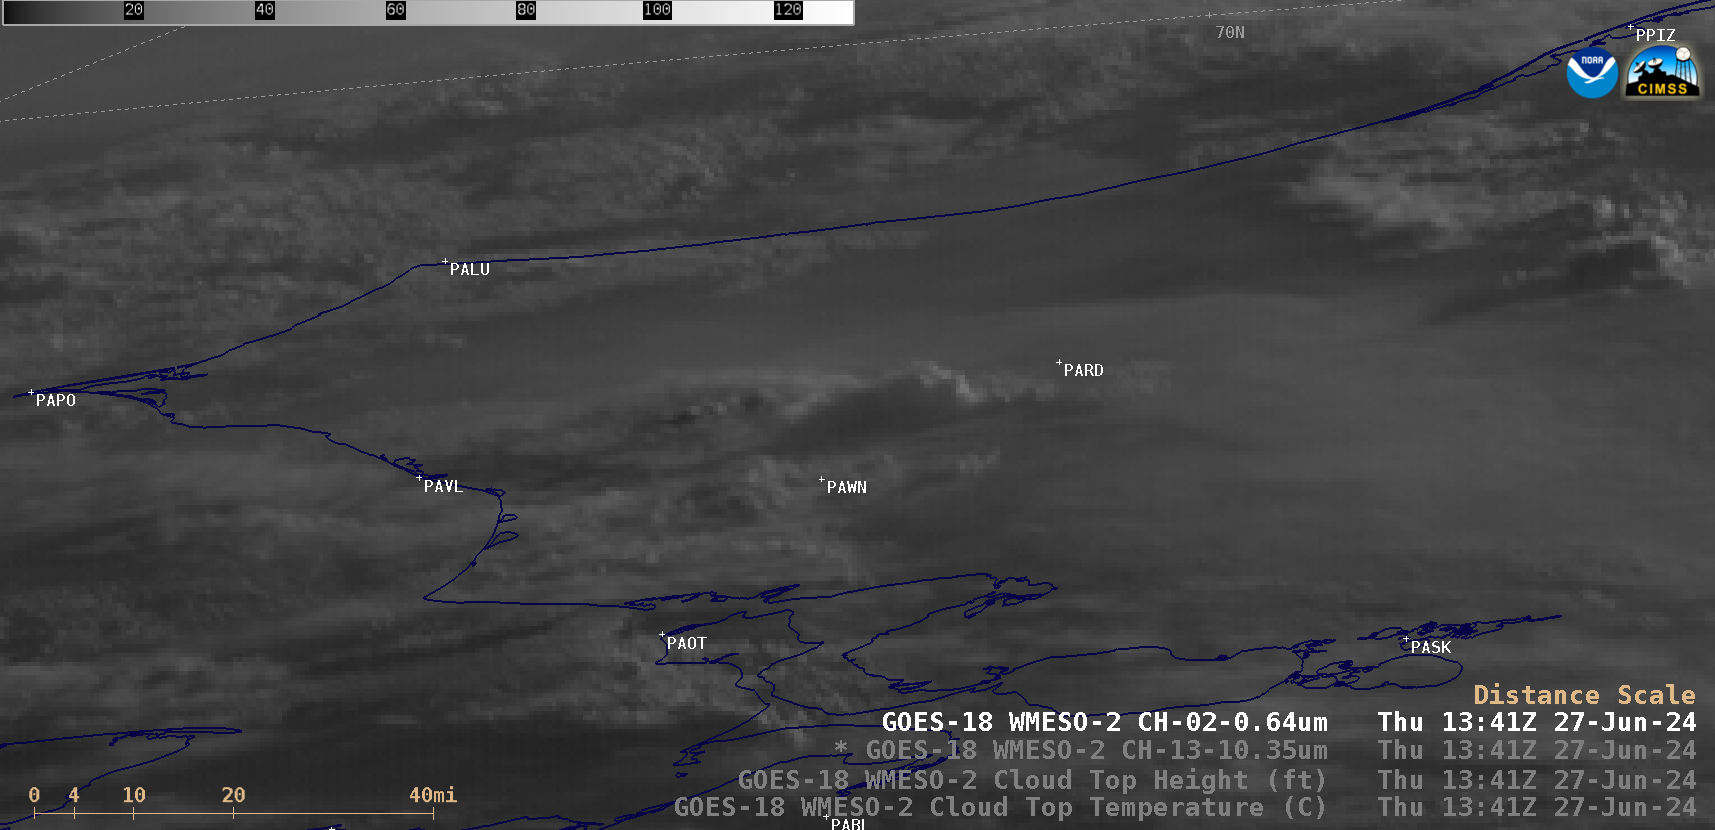
1-minute GOES-18 “Red” Visible (0.64 µm) and “Clean” Infrared Window (10.3 µm) images, from 1200-1600 UTC on 27 June [click to play animated GIF | MP4]
A cursor sample of GOES-18 Infrared (10.3 µm) cloud-top brightness temperature along with the corresponding Cloud Top Height and Cloud Top Temperature derived products at 1418 UTC on 27 June (below) depicted values of -42.13ºC, 25627.90 ft and -44.59ºC, respectively.
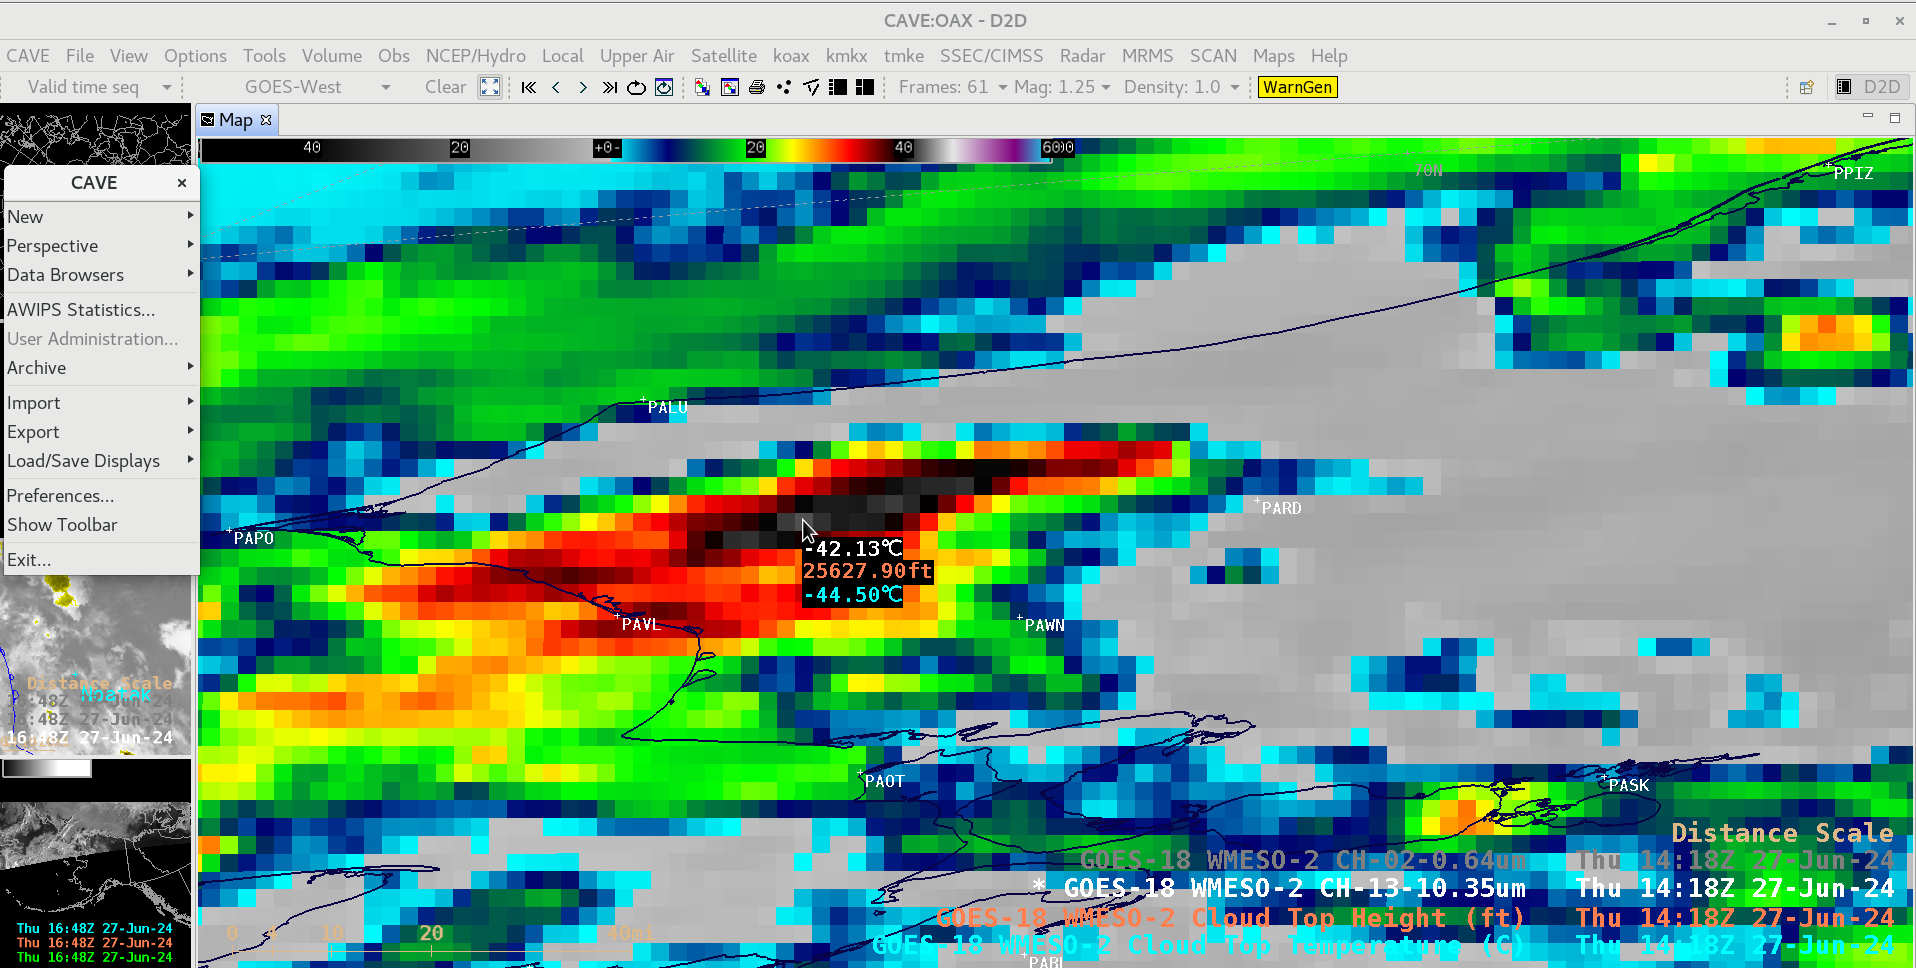
Cursor sample of GOES-18 Infrared (10.3 µm, white), Cloud Top Height (coral) and Cloud Top Temperature (cyan) at 1418 UTC on 27 June [click to enlarge]
For a cloud top height of 30000 ft, the GOES-18 parallax correction near Noatak would be 58-60 km (36-37 mi) to the south-southeast (below).
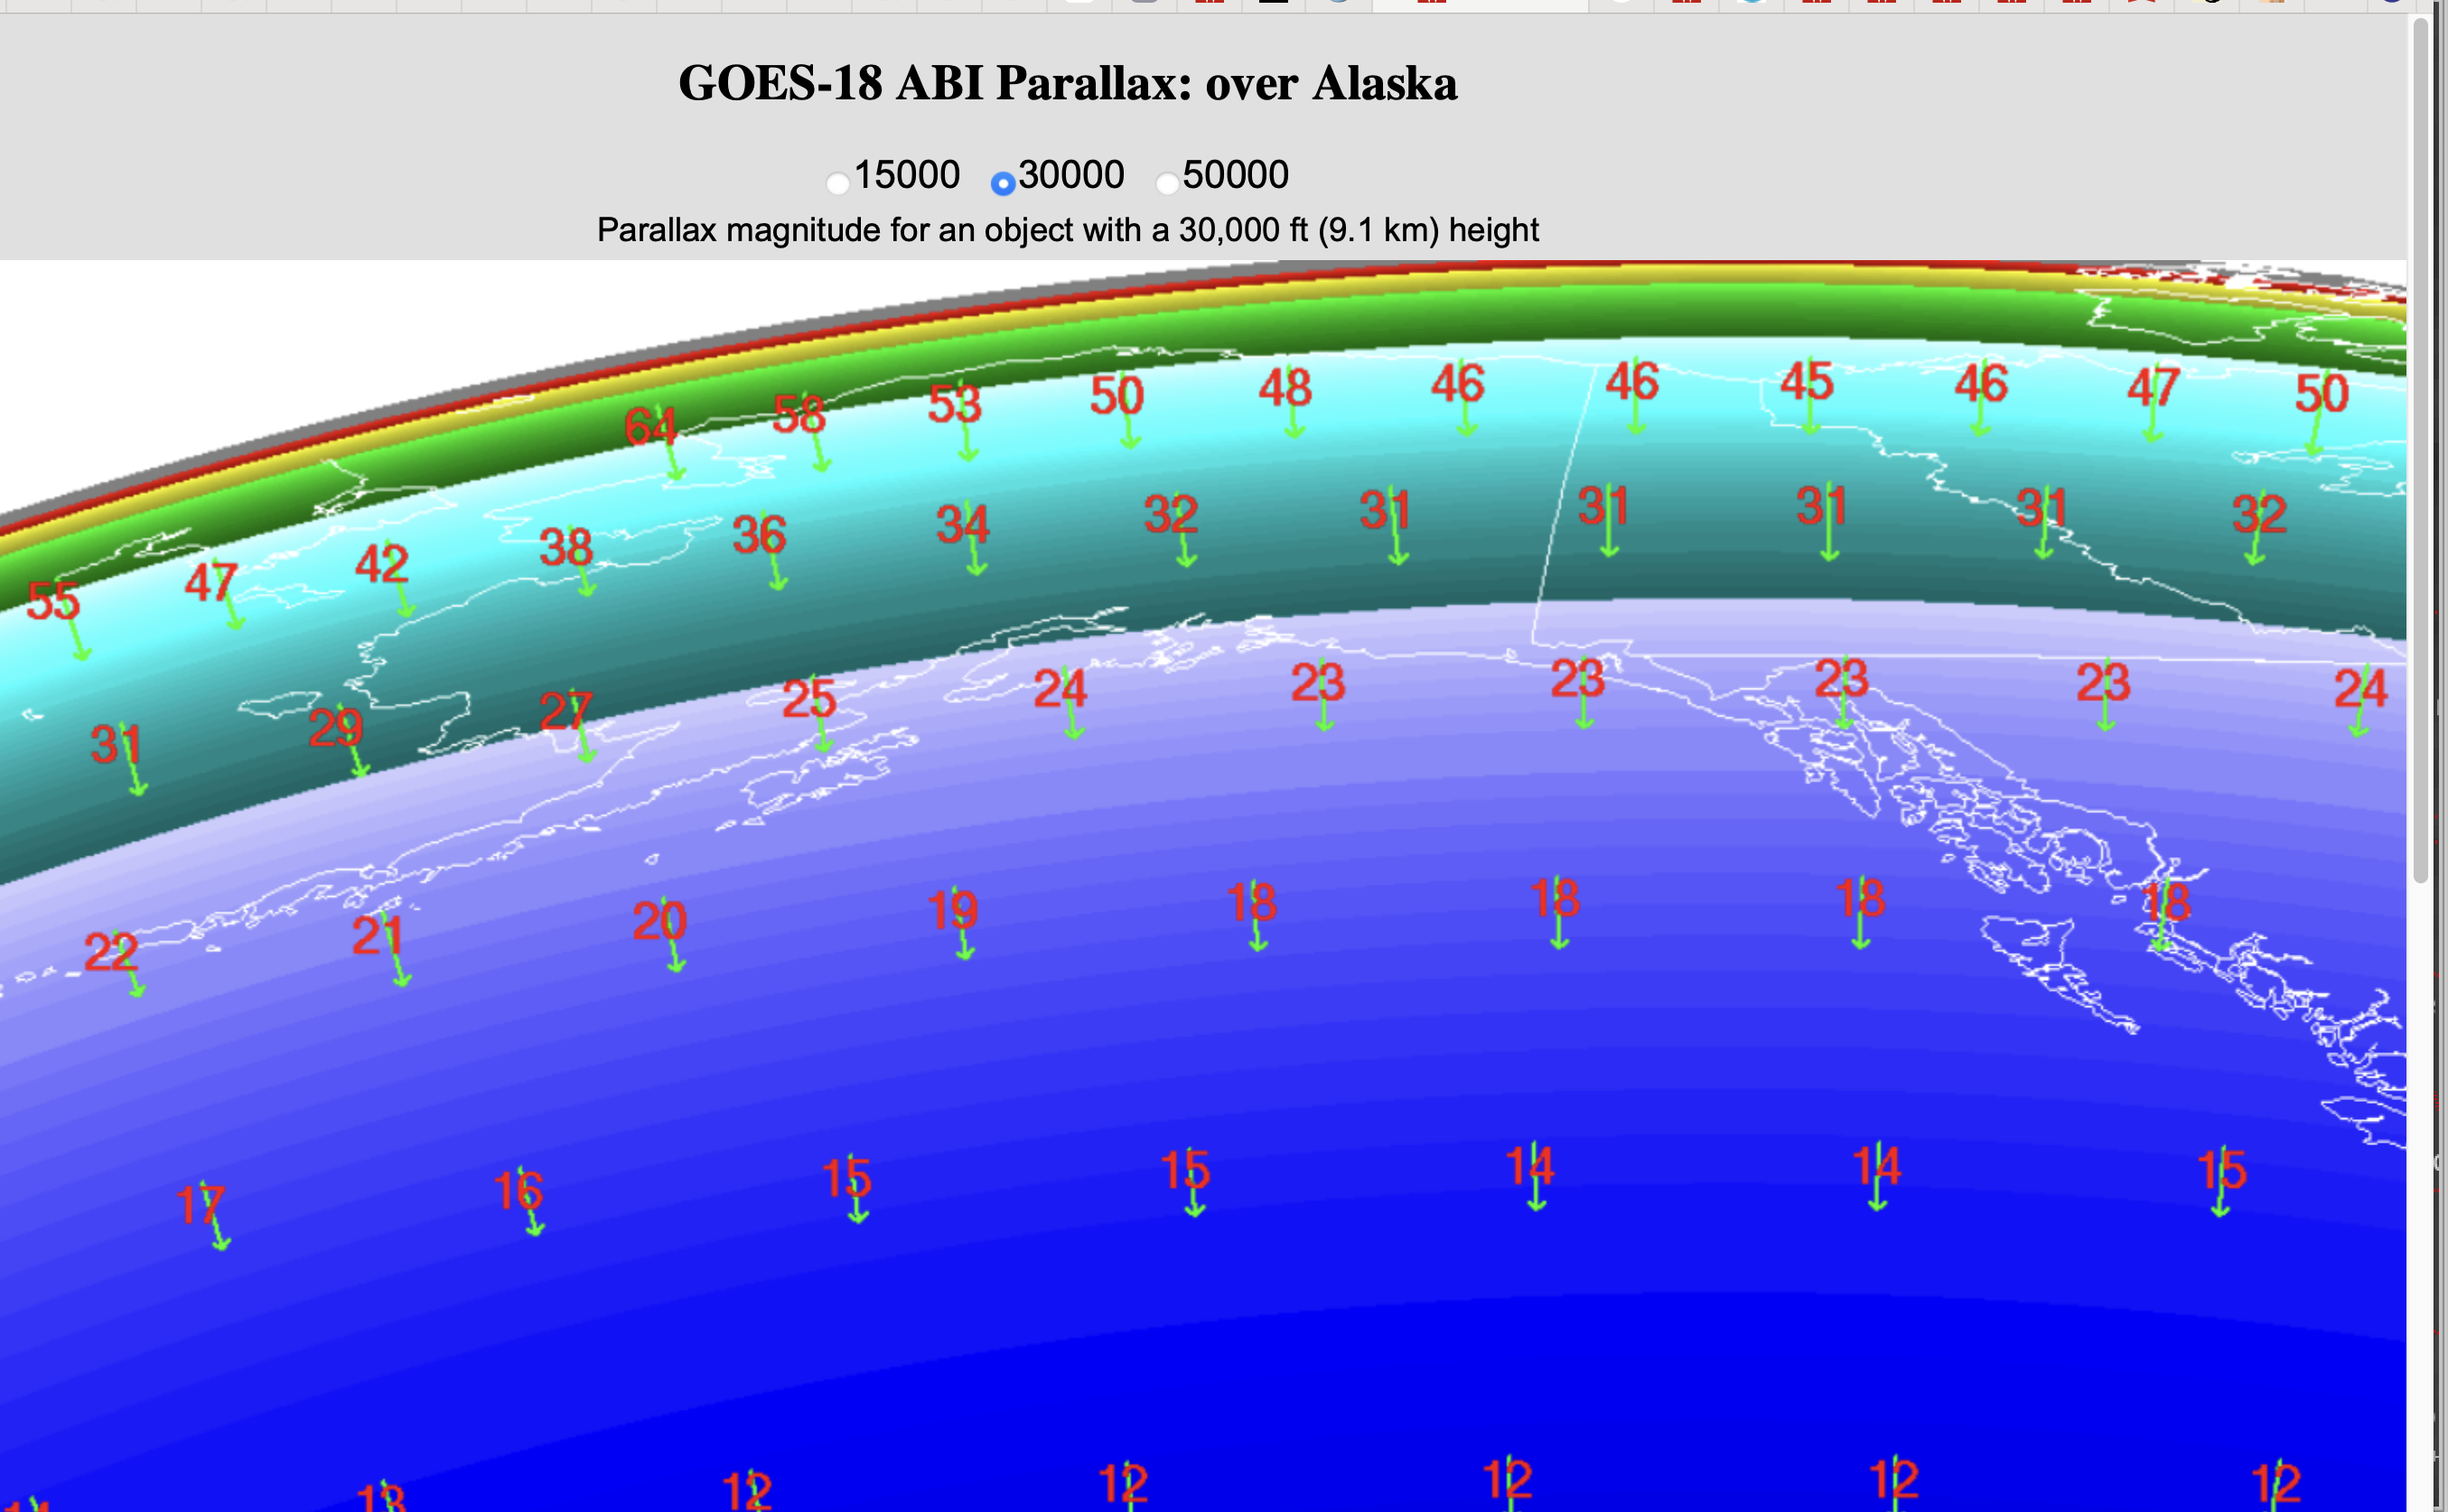
GOES-18 parallax direction (green arrows) and magnitude (red, in km) for a cloud top of 30000 ft (9.1 km) [click to enlarge]
Examining a plot of rawinsonde data from Kotzebue, Alaska (PAOT) at 1200 UTC on 27 June (below), the GOES-18 cloud-top infrared brightness temperature of -42.13ºC was near the altitude of the Most Unstable air parcel’s Equilibrium Level (EL) at 28984 ft or 8.8 km — while the -52.69ºC sensed by Suomi-NPP suggested an EL overshoot of about 1 km.

Plot of rawinsonde data from Kotzebue, Alaska (PAOT) at 1200 UTC on 27 June [click to enlarge]
___________________________
Author’s note: given that I’m retiring at the end of the day, this likely represents my last CIMSS Satellite Blog post. When I started this blog back in August 2006, it was really just meant to slowly build myself a library of cases from which I could easily borrow imagery to use in developing VISIT and SHyMet distance learning modules. As it grew in size and scope, I was quite surprised how popular the blog became, both on a national and an international level. The many comments that we received from our blog readers (which often included NWS forecasters and people from academia) always led to fruitful dialogue, and some great blog posts. Over time, more CIMSS authors joined in, which helped to diversify the blog content.
Fast-forward 18 years to 2024, and after growing to over 4000 posts, I feel quite satisfied with what the CIMSS Satellite Blog has become. Our readers learn from it, and we’ve received countless requests for permission to use blog post images/animations (which we happily grant). Hopefully this blog even helps to spark the imagination of future meteorologists-to-be (just like the glossy paper copy of a satellite image did for me, received while attending an open house at the NWS forecast office in Sioux Falls SD, at the impressionable age of 13).
View only this post
Read Less


