
GOES-16 “Red” Visible (0.64 µm), Dust RGB and Split Cloud Top Phase (11.2 µm – 8.4 µm) BTD images [click to play animated GIF | MP4]

GOES-16 “Red” Visible (0.64 µm) images, with METAR surface reports plotted in cyan [click to enlarge]
![]() ![]() |
|
Blowing dust in Argentina
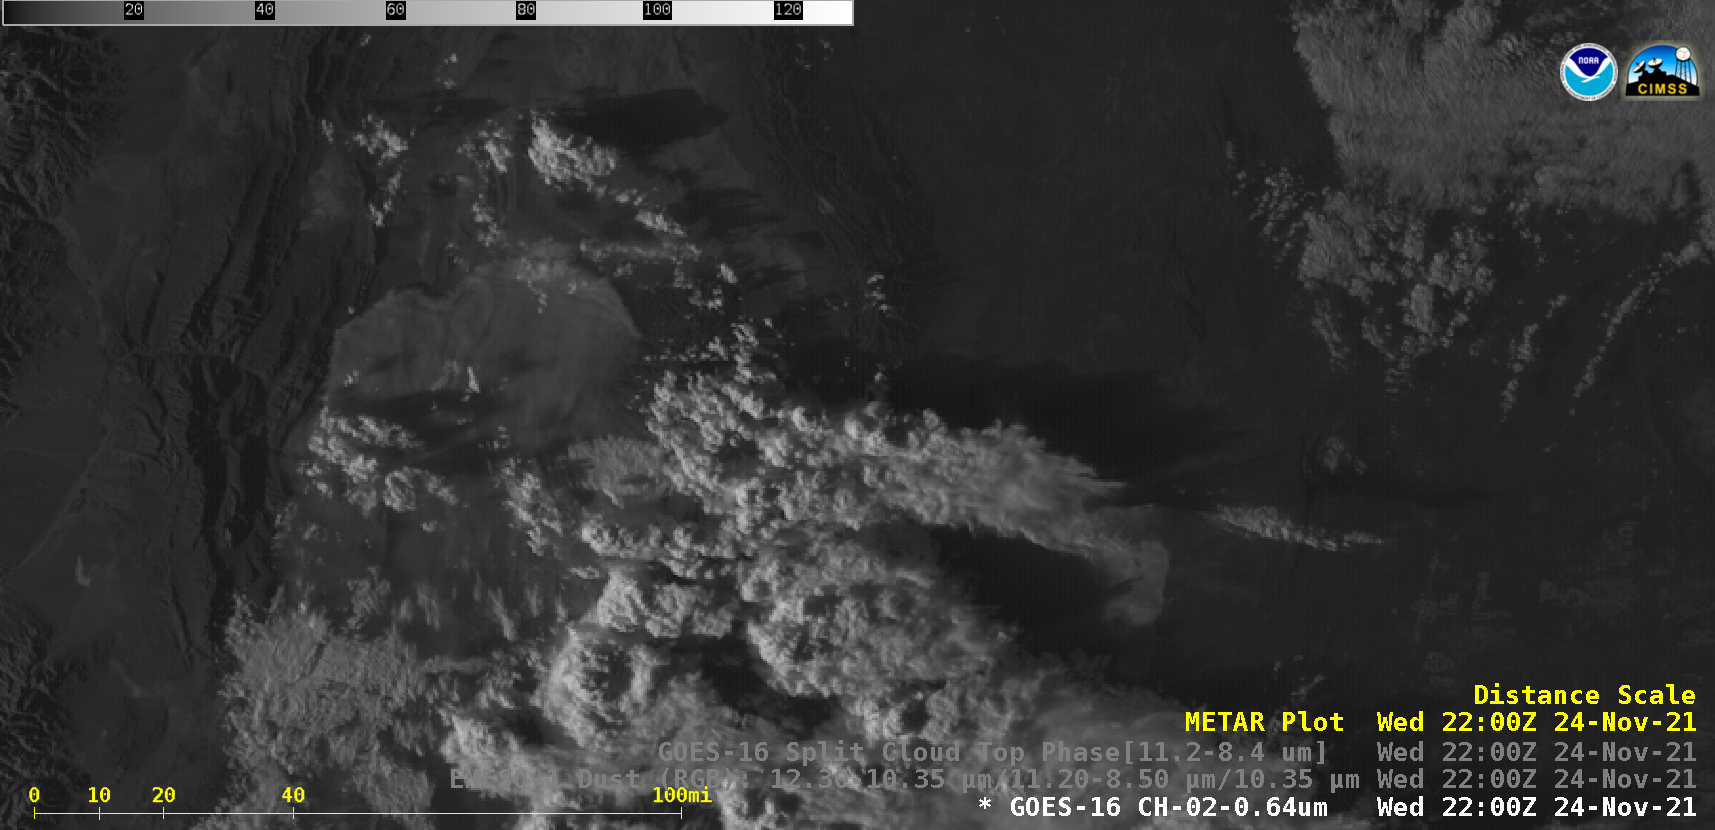
November 24th, 2021 | Scott Bachmeier![]() GOES-16 “Red” Visible (0.64 µm), Dust RGB and Split Cloud Top Phase (11.2 µm – 8.4 µm) BTD images [click to play animated GIF | MP4] ![]() GOES-16 “Red” Visible (0.64 µm) images, with METAR surface reports plotted in cyan [click to enlarge] Showers over the south PacificNovember 24th, 2021 | Scott Lindstrom![]() GOES-17 Infrared imagery, above, centered on American Samoa, shows several low-level cloud lines from which showers are developing (and then rapidly dying, suggestive of strong shear, as noted in this 0600 UTC shear analysis taken from this website). There are also convective elements developing over/near some of the islands. What is the moisture/stability distribution around these showers? GOES-17 Total Precipitable Water fields, below, show American Samoa at the edge of a moist (TPW exceeding 2″) band (associated with the South Pacific Convergence Zone), dryer air (TPW is around 1.2″) to the northeast and relatively dry air to the south (TPW is around 1.3-1.4″ in patches). There is an increasing amount of noise in this Level 2 product starting around 1200 UTC, manifest as horizontal lines, that arise because of the poor functioning of the GOES-17 Loop Heat Pipe. As the ABI instrument’s focal plane’s temperature increases, bands that are used in the computation of Total Precipitable Water (including Band 15), become noisy. (Note that Band 13 on this day is not obviously affected by the increase in the focal plane temperature). ![]() GOES-17 ABI data can also be used to estimate atmospheric stability, as shown below. Lifted Index fields (also showing Loop Heat Pipe-related striping at the end of the animation) show strongest instability in the region where showers are most common to the north of American Samoa — in the moist band. The strongest instability is over the southwestern part of this domain (the diagnosed Lifted Index there is near -5). Level 2 products from GOES-17 can give hints as to where convection will form out over the open ocean where conventional observations are sparse, even when Loop Heat Pipe issues with GOES-17 start to become obvious. ![]() Special note for the Lifted Index animation above: The bounds of the Lifted Index values have been changed from the AWIPS default — -10 to 20 — to -5 to 7; this was done to better differentiate between small variations in stability. NUCAPS use over AlaskaNovember 24th, 2021 | Scott Lindstrom![]() A useful strength of NUCAPS profiles over Alaska is that at that northern Latitude, sequential overpasses will overlap so that one location will be sampled sequential times. In the example above, note for example that portions of Canada’s Northwest Territories are sampled three times. Much of southern Alaska is sampled twice. Thus, NUCAPS profiles there allow a user to ascertain routinely how the atmosphere is changing over 90 minutes, usually at times surrounding radiosonde observations at 1200 UTC (and 0000 UTC). The animation below shows NUCAPS soundings and the upper air sounding at CYVQ (Norman Wells) in the Northwest Territories, at the edge of the Sounding Availability Plots imagery above. There is warming between the two NUCAPS profiles, and gross aspects of the NUCAPS and radiosonde profiles agree (for example: Tropopause Height, low-level inversion). Always remember that a NUCAPS profile is representative of a volume of air; radiosondes sample individual points as they ascend. ![]() The plots below compare the 1200 UTC PAFC (Anchorage AK) soundings with nearby NUCAPS soundings. General agreement here is better: Tropopause heights are similar, a low-level inversion is present, as is general drying with height. Note how the sequence of PAFC sounding and the two NUCAPS soundings show a slow lower-tropospheric warming trend. ![]() Use the daily overlap of NUCAPS soundings to give yourself a twice-daily estimate of how the troposphere is changing over Alaska. Gridded NUCAPS fields (not shown) will also overlap and can also be used in this way. NUCAPS are an observational product that is largely independent of model data. Satellite signatures of the DART Mission launchNovember 24th, 2021 | Scott BachmeierGOES-17 Near-Infrared, Shortwave Infrared and Water Vapor images [click to play animated GIF | MP4] The corresponding GOES-17 Visible (spectral bands 1 and 2) and Near-Infrared (spectral bands 3-6) images are shown below. Since the satellite was viewing the rocket from the west, a very faint reflectance signature of the Falcon 9 booster could be seen in the first 3 post-launch 0.64 µm (Band 2) Visible images — but no discernible signature was evident in the lower-resolution 0.47 µm (Band 1) Visible imagery. GOES-17 Visible and Near-Infrared images [click to play animated GIF | MP4] |
|