True-color RGB images from Terra MODIS, Suomi NPP VIIRS and Aqua MODIS, viewed using RealEarth (below) revealed the long ash plume during the late morning and early afternoon on 25 March. The dark signature of ash fall onto the snow-covered terrain was evident on the Terra and Aqua images, just west of the high-altitude ash plume.
26 March Update: a closer view of Terra MODIS true-color images from 25 and 26 March (below) showed that the perimeter of the darker gray surface ash fall signature had fanned out in both the west and east directions.Eruption of Kambalny volcano in Kamchatka, Russia
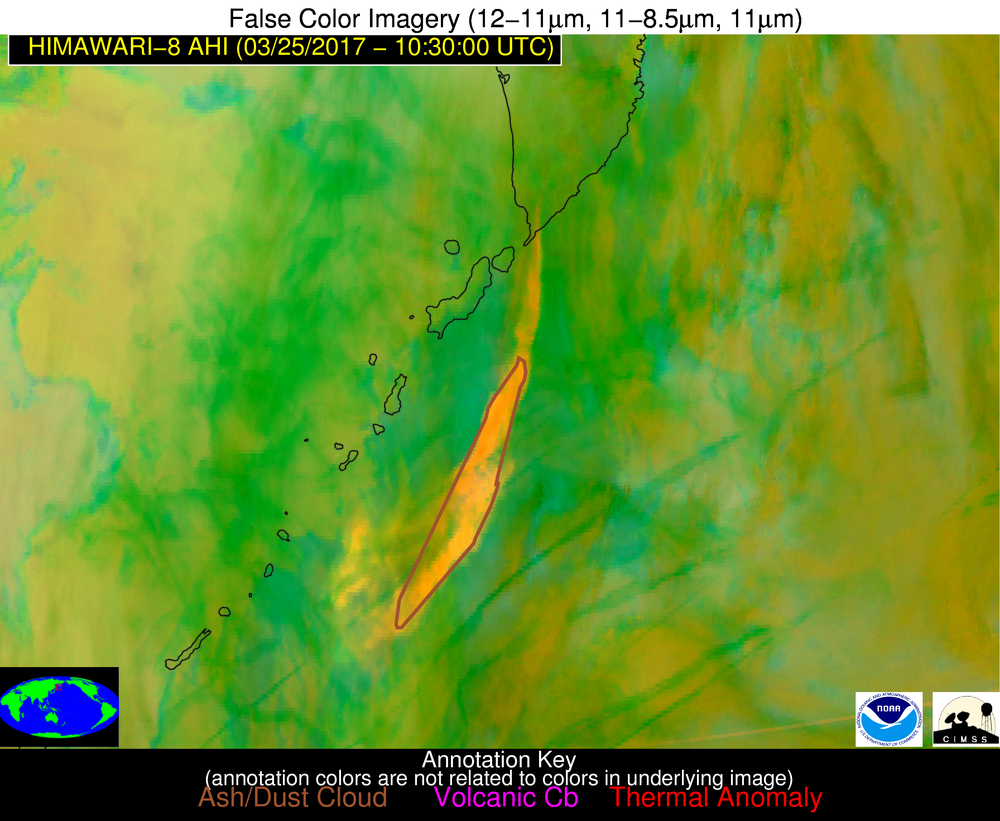
March 25th, 2017 | Scott BachmeierGOES-16 Cirrus Channel and Dust
March 23rd, 2017 | Scott LindstromThe visible animation from late afternoon over west Texas, above, shows a characteristic signature of a shroud of dust around El Paso, TX behind a dryline associated with a developing cyclone in the lee of the Rocky Mountains. This pall of dust was visible in many of the 16 channels on the Advanced Baseline Imager (ABI) that sits on GOES-16. The toggle below cycles through the Red visible (0.64 µm), the Blue visible (0.47 µm), the Cirrus channel (1.38 µm), the Snow/ice channel (1.61 µm) and the Upper-Level and Lower-Level water vapor channels (6.19 µm and 7.34 µm, respectively) (Click here for a faster image toggle). In addition, a 2-panel comparison of GOES-16 Visible and Cirrus band imagery is available here.
![GOES-16 Visible (0.64 µm and 0.47 µm), Cirrus (1.38 µm), Snow/Ice (1.61 µm), Upper level Water Vapor (6.19 µm) and Lower Level Water Vapor (7.34 µm) images, 2132 UTC on 23 March [click to enlarge]](https://cimss.ssec.wisc.edu/satellite-blog/wp-content/uploads/sites/5/2017/03/GOES16_2137UTC_23MARCH2017_6channeltoggleslow.gif)
GOES-16 Visible (0.64 µm and 0.47 µm), Cirrus (1.38 µm), Snow/Ice (1.61 µm), Upper level Water Vapor (6.19 µm) and Lower Level Water Vapor (7.34 µm) images, 2132 UTC on 23 March [click to enlarge]
Thin dust is very difficult to detect in the 1.61 µm snow/ice channel because solar energy at that wavelength reflected from the surface moves unimpeded through thin dust; thus you can generally see the surface in dusty regions in the 1.61 µm channel. On this date the 1.61 µm channel nimbly discriminated between water clouds (over central Mexico) and ice clouds (over much of the rest of the domain, as shown in this toggle between 0.64 µm and 1.61 µm : only the clouds composed of water are reflective (white) in both channels.
The atmosphere was sufficiently dry on this date that the lower-level (7.34 µm) water vapor channel detected surface features (horizontal convective rolls) associated with the blowing dust. (click here for the 6.19 µm image; surface features are not so apparent). Weighting functions computed at those wavelengths show a significant contribution from the surface at 7.4 µm (the red line), and also at 7.0 µm, (the green line), so the mid-level water vapor imagery from GOES-16 likely also shows surface influences); the 6.5 µm weighting function (the blue line) does not extend to the surface (These GOES-13 Sounder Weighting Functions that are similar to those from the GOES-16 ABI are from this site) so it’s unlikely that the 6.19 µm imagery shows surface features.
The GOES-R Website has fact sheets on the 0.47 µm, 0.64 µm, 1.38 µm, 1.61 µm, 6.19 µm and 7.34 µm channels.
Added: The RAMSDIS GOES-16 Loop of the Day from 23 March showed the Dust RGB product.
GOES-16 Visible and Cirrus Channels
March 21st, 2017 | Scott LindstromGOES-16 Visible imagery captured the erosion of near-surface clouds over Ohio on 21 March 2017. A benefit of the routine 5-minute imagery is that it allows better estimates of exactly when the low clouds will clear out. There is ample suggestion in the animation above of the presence of cirrus clouds. The GOES-16 ABI has a channel at 1.38 µm that is specifically designed to detect cirrus clouds because that is a region in the electromagnetic spectrum where strong water vapor absorption occurs. The animation of ‘cirrus channel’ imagery, below, confirms the presence of widespread cirrus clouds.
The MODIS instrument also has a similar near-infrared Cirrus spectral band — and a comparison of Terra MODIS Visible (0.65 µm) and Cirrus (1.375 µm) images at 1601 UTC is shown below.GOES-16 Mesoscale Sector visible images: severe thunderstorms in Illinois/Indiana, and Tennessee/Georgia/South Carolina
March 20th, 2017 | Scott Bachmeier1-minute interval 0.5-km resolution GOES-16 Visible (0.64 µm) images (above; also available as a 130 Mbyte animated GIF) showed a cluster of thunderstorms that moved southeastward across Illinois and Indiana, producing a swath of hail as large as 2.75 inches in diameter (SPC storm reports) on 20 March 2017. The shadowing and textured signature of overshooting tops could be seen in the vicinity of many of the hail reports (hail sizes, red, are plotted in 1/100th of an inch; 275 = 2.75 inches).
On 21 March, a larger-scale outbreak of wind and hail-producing thunderstorms developed which primarily impacted parts of Tennessee, Georgia and South Carolina. Trees falling on homes were responsible for injuries and a fatality in Georgia, and hail as large as 3.0 inches occurred in South Carolina (SPC storm reports). As discussed on the Satellite Liaison Blog, the co-location of both Mesoscale Sectors provided images at 30-second intervals — GOES-16 Visible (0.64 µm) images (below; also available as a 168 Mbyte animated GIF) again displayed very detailed cloud-top structure which included overshooting tops and gravity waves.